The following pie-chart shows the market share of four companies S, T, U and V. Total market is worth Rs. 72 crores. Study the pie-chart and answer the questions.
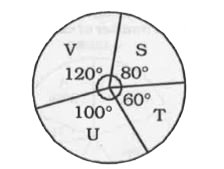
The company having maximum market share is
T
U
S
V
The correct Answer is:D
Step by step video, text & image solution for The following pie-chart shows the market share of four companies S, T, U and V. Total market is worth Rs. 72 crores. Study the pie-chart and answer the questions. The company having maximum market share is by Maths experts to help you in doubts & scoring excellent marks in Class 14 exams.
Updated on:21/07/2023Topper's Solved these Questions
- STATISTICS AND DATA INTERPRETATIONBOOK - KIRAN PUBLICATIONCHAPTER - STATISTICS AND DATA INTERPRETATIONEXERCISE - TYPE-VIII
8 Videos
- STATISTICS AND DATA INTERPRETATIONBOOK - KIRAN PUBLICATIONCHAPTER - STATISTICS AND DATA INTERPRETATIONEXERCISE - TYPE-VI
86 Videos
- SIMPLIFICATIONBOOK - KIRAN PUBLICATIONCHAPTER - SIMPLIFICATIONEXERCISE - TEST YOURSELF
25 Videos
- TIME AND DISTANCEBOOK - KIRAN PUBLICATIONCHAPTER - TIME AND DISTANCEEXERCISE - Type -XI
74 Videos
Similar Questions
The following Bar chart shows the sales of a company XYZ (in Rs Crore). Study the chart and answer the following questions.
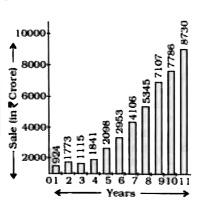
Total sales in 2nd and 3rd years together is :
View SolutionThe following Bar chart shows the sales of a company XYZ (in Rs Crore). Study the chart and answer the following questions.
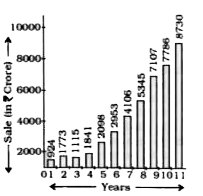
The mean of the highest and the lowest sale (in Rs Crore) is :
View Solution
Knowledge Check
The following pie-chart shows the market share of four companies S, T, U and V. Total market is worth Rs. 72 crores. Study the pie-chart and answer the questions.
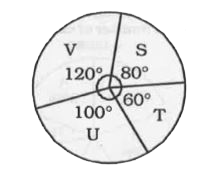
The difference of market shares of companies V and U isARs. 8 croresBRs. 9 croresCRs. 6 croresDRs. 4 croresThe following pie chart shows percentage expenditure of a country on different heads .The total expenditure is Rs. 1,680 (in billions).Study the chart and answer the question.
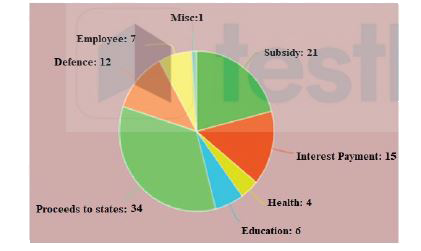
The total amount of expenditure for education and Health (in billions Rs. )is:Aa)84Bb)168Cc)126Dd)186The following pie-chart shows the study-time of different subjects of a student in a day. Study the pie-chart and answer the following questions
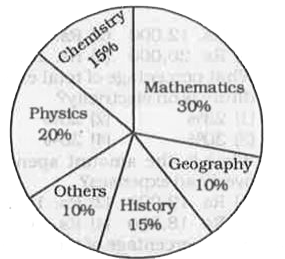
The time spent to study history and chemistry is 4 hours 30 minutes, Then the student studied physics forA1 hour 30 minutesB2.9 hours (approx.)C2 hoursD3 hours
The following Bar chart shows the sales of a company XYZ (in Rs Crore). Study the chart and answer the following questions.
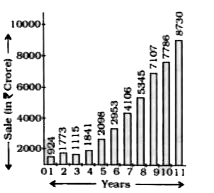
The sale in the year 4 is less than the sale in the year 8, by
View SolutionThe following Bar chart shows the sales of a company XYZ (in Rs Crore). Study the chart and answer the following questions.
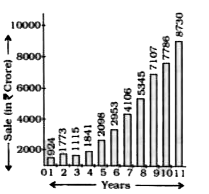
The 2nd least sale is in the year :
View SolutionThe Pie-chart shows the result of a survey among 119060 people concerning the use of tobacco. Study the Pie-chart and answer the questions.
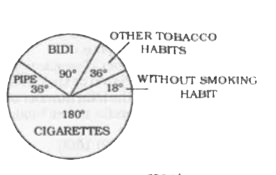
The number of people smoking Cigarettes is :
View SolutionThe Pie-chart shows the result of a survey among 119060 people concerning the use of tobacco. Study the Pie-chart and answer the questions.
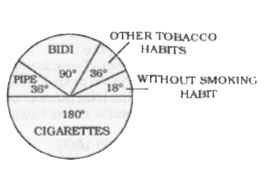
The number of people preferring Bidi is :
View SolutionThe following Bar chart shows the sales of a company XYZ (in Rs Crore). Study the chart and answer the following questions.
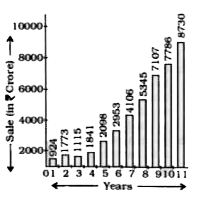
The 2nd highest sale in the year :
View Solution
