Study the pie chart and answer the given questions.
The total expenditure of a company for a particular month is Rs. 60000. The various heads of expenditure I to IV are indicated in a pie chart given below. These heads are :
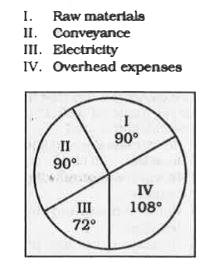
What is the amount spent on overhead expenses?
Rs 12,000
Rs. 15,000
Rs. 18,000
Rs. 10,000
The correct Answer is:C
Step by step video, text & image solution for Study the pie chart and answer the given questions. The total expenditure of a company for a particular month is Rs. 60000. The various heads of expenditure I to IV are indicated in a pie chart given below. These heads are : What is the amount spent on overhead expenses? by Maths experts to help you in doubts & scoring excellent marks in Class 14 exams.
Updated on:21/07/2023Topper's Solved these Questions
- STATISTICS AND DATA INTERPRETATIONBOOK - KIRAN PUBLICATIONCHAPTER - STATISTICS AND DATA INTERPRETATIONEXERCISE - TYPE-VIII
8 Videos
- STATISTICS AND DATA INTERPRETATIONBOOK - KIRAN PUBLICATIONCHAPTER - STATISTICS AND DATA INTERPRETATIONEXERCISE - TYPE-VI
86 Videos
- SIMPLIFICATIONBOOK - KIRAN PUBLICATIONCHAPTER - SIMPLIFICATIONEXERCISE - TEST YOURSELF
25 Videos
- TIME AND DISTANCEBOOK - KIRAN PUBLICATIONCHAPTER - TIME AND DISTANCEEXERCISE - Type -XI
74 Videos
Similar Questions
Knowledge Check
Study the pie chart and answer the given questions.
The total expenditure of a company for a particular month is Rs. 60000. The various heads of expenditure I to IV are indicated in a pie chart given below. These heads are :
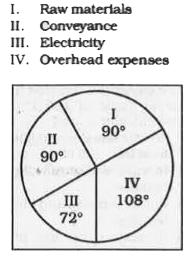
Total expenditure on conveyance is :ARs. 12,000BRs. 15,000CRs. 20,000DRs. 10,000Study the pie chart and answer the given questions.
The total expenditure of a company for a particular month is Rs. 60000. The various heads of expenditure I to IV are indicated in a pie chart given below. These heads are :
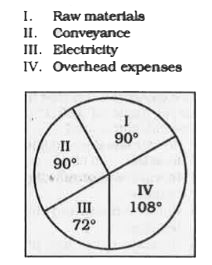
What percentage of total expenditure is an electricity?A23%B25%C30%D20%Study the pie chart and answer the given questions.
The total expenditure of a company for a particular month is Rs. 60000. The various heads of expenditure I to IV are indicated in a pie chart given below. These heads are :
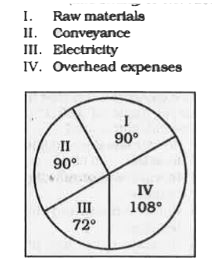
What percentage of total expenditure is on raw materials?A25%B30%C60%D23%
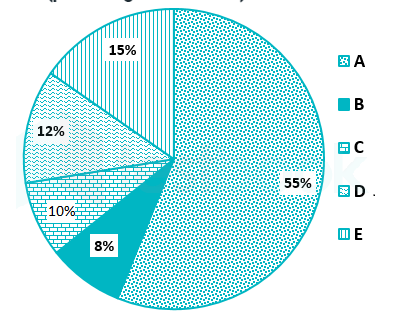
Study the following pie-chart and answer the given question.
The pie-chart shows the Budget Expenditure of a company in the year 2018 (percentage distribution) on different heads AB.C,D & E.
The central angle of the sector representing expenditure on head E is:
View SolutionStudy the following pie-chart and answer the given question.
The pie-chait shows Budget Expenditure of a company in the year 2015 (percentage distribution) on different heads A. B.C.D&E.
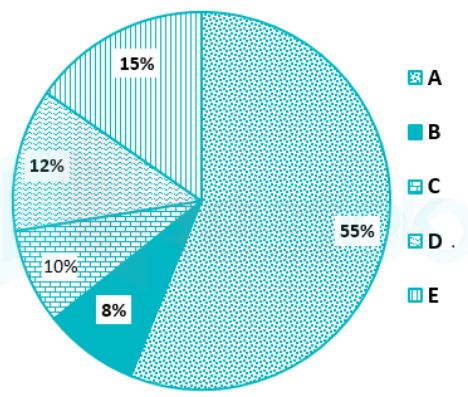
If Rs 165 crore were spent in year 2018 on A, what would have been the total expenditure for that year (in 3 crores)?
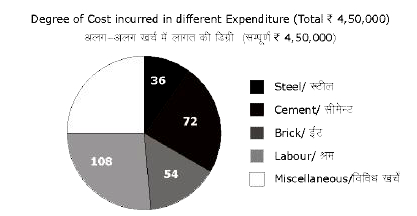
View SolutionIn the given pie chart what is the ratio of the total expenditure on steel, cement and bricks to the total expenditure on labour and miscellaneous expenses
View SolutionThe given pie chart shows the distribution of expenditure of a company (in percenatge). The total expenditure of the company is Rs. 136000.
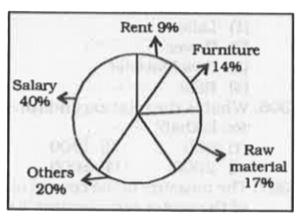
What is the total expenditure (in Rs.) incurred on Furniture and Others by the company?
View SolutionThe given pie chart shows the distribution of expenditure of a company (in percentage) . The total expenditure of the company is Rs. 136000.
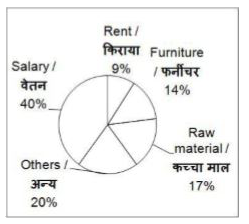
What is the total expenditure (in Rs) incurred on Furniture and Others by the company?
View Solution

