Examine the following graph carefully and answer the questions given below it :
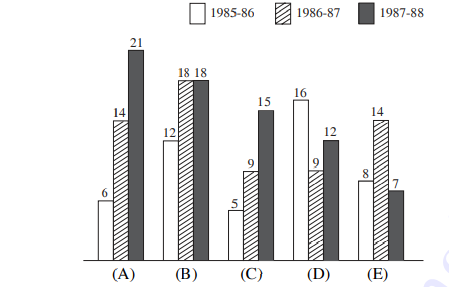
Which of the following statements is false ?
States A and E showed the same production in 1986-87
There was no improvement in the production of cotton in state B during 1987-88
State A has produced maximum cotton during the given period
Products of states C and D together is equal to that of state B during 1986-87
The correct Answer is:C
Step by step video, text & image solution for Examine the following graph carefully and answer the questions given below it : Which of the following statements is false ? by Maths experts to help you in doubts & scoring excellent marks in Class 14 exams.
Updated on:21/07/2023Topper's Solved these Questions
Similar Questions
Read the following graph carefully and answer the questions given below:
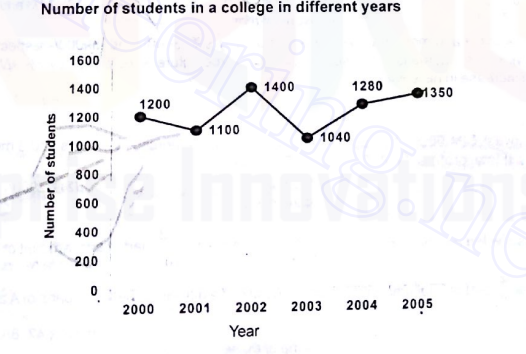
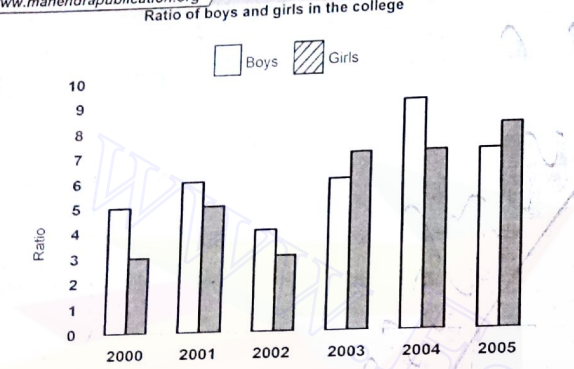
In which two years the number of girls is equal ?
View SolutionExamine the following graph carefully and answer the questions given below it :
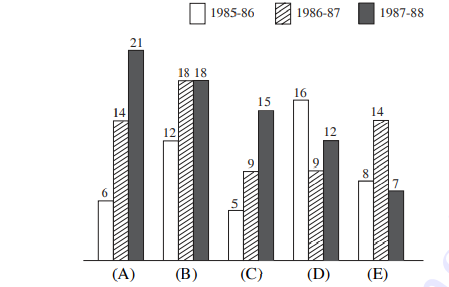
In which states is there a steady increase in the production of cotton during the given period ?
View Solution
Knowledge Check
Study the following graph carefully and answer the questions given below it -----
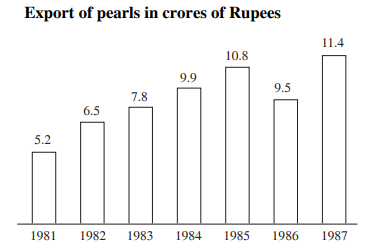
In which of the following pairs of years was the average export of pearls around 9 crores ?A1982 and 1983B1983 and 1984C1984 and 1985D1985 and 1986Study the following graph carefully and answer the questions given below –
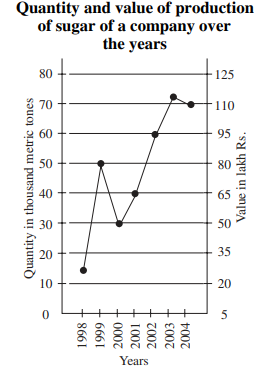
In which of the following years was the percentage increase in value of sugar per metric ton from the previous year the maximum?A1999B2000C2001D2003Study the graph carefully and answer the following questions.
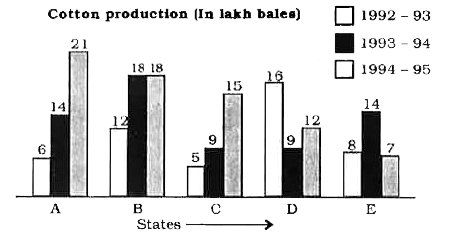
Which of the following statement is false ?AState A and E showed the same production in 1993-94.BThere was no improvement in the production of cotton in state B during 1994-95.CState A has produced maximum cotton during the given period.DProduction of state C and D together is equal to that of state B dring 1993-94.
Study the following graph carefully and answer the questions given below –
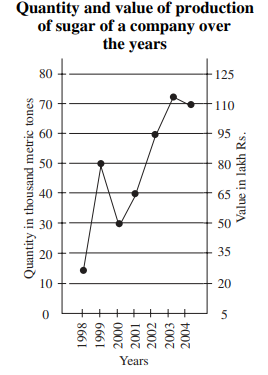
In which of the following years was the value of sugar per metric ton the lowest among the given years?
View SolutionStudy the following graph carefully and answer the questions given below
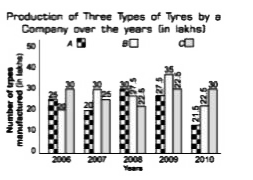
In which of the following years, was the percentage production of B type to C type the maximum?
View SolutionStudy the following graph carefully and answer the questions that follow
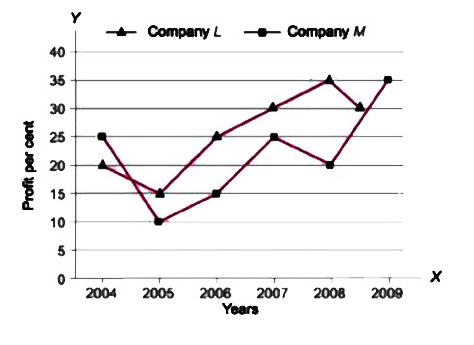
Which of the following statements is true with respect to the above graph ?
View SolutionStudy the following graph carefully and answer the question given below-----
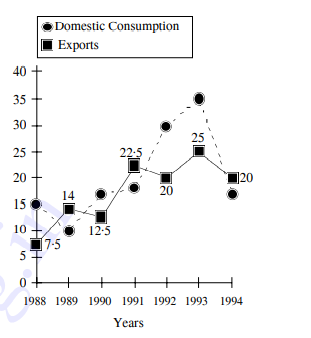
In which of the following years was the value of sugar per metric ton the lowest among the given years ?
View SolutionExamine the following graph carefully and answer the questions given below it :
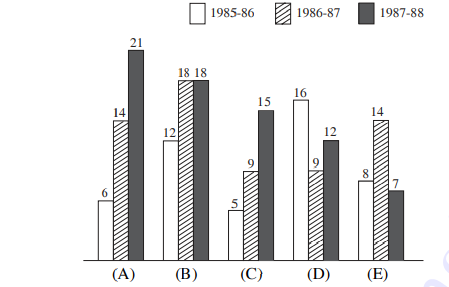
The production of state D in 1986-87 is how many times its production in 1987-88 ?
View Solution
