The following graph represents the transport used by children. Study the graph and answer the given questions.
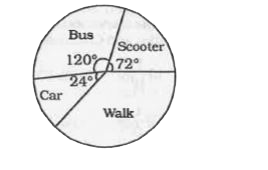
If 10 students come by car, how many come by bus ?
60
50
30
100
The correct Answer is:B
Step by step video, text & image solution for The following graph represents the transport used by children. Study the graph and answer the given questions. If 10 students come by car, how many come by bus ? by Maths experts to help you in doubts & scoring excellent marks in Class 14 exams.
Related Playlists
- BOOK - KIRAN PUBLICATIONCHAPTER - STATISTICS AND DATA INTERPRETATIONEXERCISE - TYPE-VIII8videos
STATISTICS AND DATA INTERPRETATION
- BOOK - KIRAN PUBLICATIONCHAPTER - STATISTICS AND DATA INTERPRETATIONEXERCISE - TYPE-VI86videos
STATISTICS AND DATA INTERPRETATION
- BOOK - KIRAN PUBLICATIONCHAPTER - SIMPLIFICATIONEXERCISE - TEST YOURSELF25videos
SIMPLIFICATION
- BOOK - KIRAN PUBLICATIONCHAPTER - TIME AND DISTANCEEXERCISE - Type -XI74videos
TIME AND DISTANCE
Similar Questions
The following graph represents the transport used by children. Study the graph and answer the given questions.
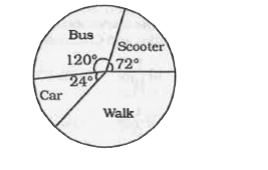
What is the percentage of children using scooter ?View SolutionThe following graph represents the transport used by children. Study the graph and answer the given questions.

What is the percentage of children using scooter ?View SolutionThe following graph represents the transport used by children. Study the graph and answer the given questions.
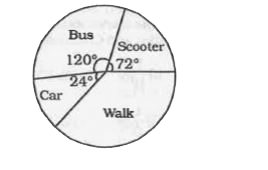
What is the measure of the angle at the centre representing people walking ?View SolutionStudy the following bar graph and answer the question that follows.
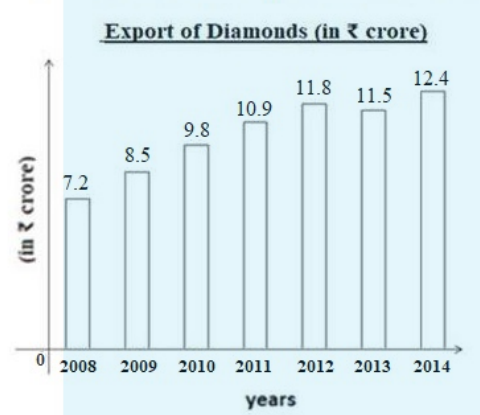
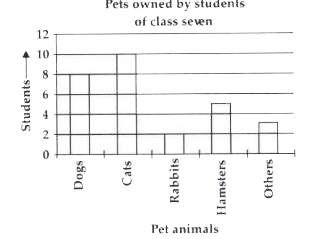
In which year was the maximin percentage increase in diamonds exports compared to the previous year?View SolutionUse the bar graph to answer the following questions
How many students have dog as a pet ?
 View Solution
The following bar graph shows the games played by the students. Study the graph carefully and answer the question given below:
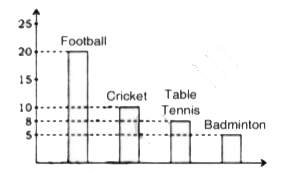
How many students play table tennis?View SolutionIn an Institution there are 800 students. Students use different modes of transport for going to the intitution and return. The given pie diagram represents the requisite data. Study the diagram carefully and answer the questions.
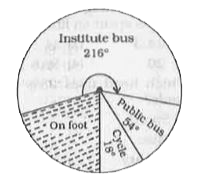
The number of students who travel in public bus isView SolutionIn an Institution there are 800 students. Students use different modes of transport for going to the intitution and return. The given pie diagram represents the requisite data. Study the diagram carefully and answer the questions.
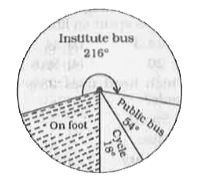
The number of students who do not use institute bus isView SolutionThe following graph shows the sales of cars (in thousands) in four cities in 4 years. Study the graph and answer the question
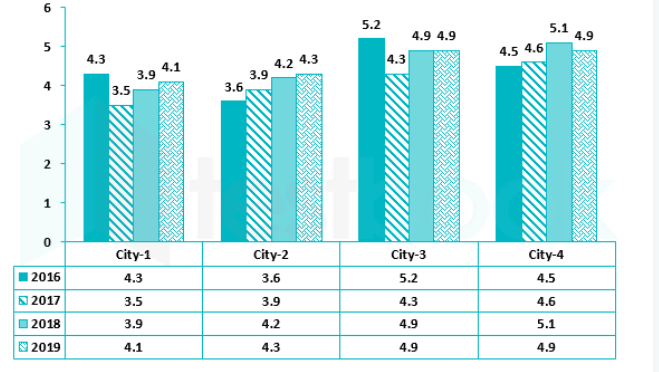
In which year. the sales are highest?View SolutionThe graph shows the result of 10th class students of a school for 4 years. Study the graph and answer the questions :
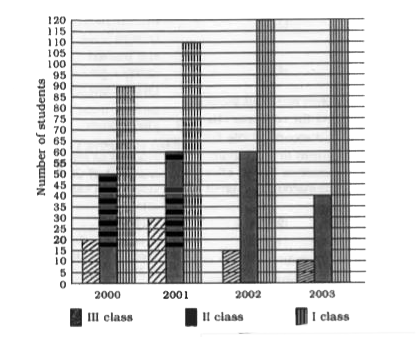
The ratio of students who scored seconds class to the total students appcarcd in the year 2000 isView Solution


