The following bar graph shows the games played by the students. Study the graph carefully and answer the question given below:
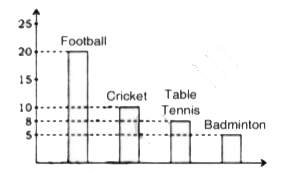
How many students play table tennis?
10
8
18
20
The correct Answer is:B
Step by step video, text & image solution for The following bar graph shows the games played by the students. Study the graph carefully and answer the question given below: How many students play table tennis? by Maths experts to help you in doubts & scoring excellent marks in Class 6 exams.
Updated on:21/07/2023Similar Questions
Read the bar graph carefully and answer the following questions.
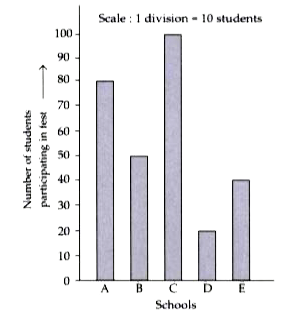 How may students of school B participated in the fest ?
View SolutionThe circle - graph given here shows the spendings of a country on various sports during a prticular year. Study the graph carefully and answer the questions given below It .
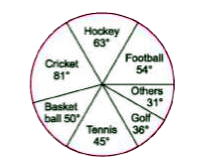
What per cent of the total spendings is Sent on Tennis ?
View Solution
Knowledge Check
Study the following table carefully and answer the questions given below.
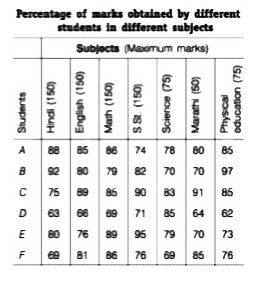
How many students have scored the highest marks in more than one subject?AoneBtwoCthreeDfourStudy the following table carefully and answer the questions given below ?
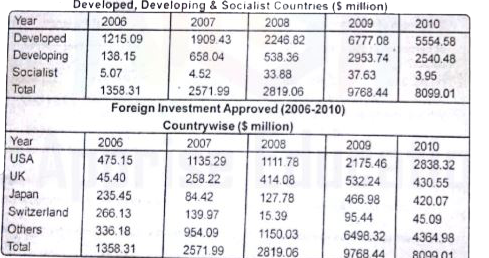
How many countries are developed and developing respectivelyA2, 2B3,1C1,3DData InadequateStudy the following graph carefully and answer the questions given below it -----
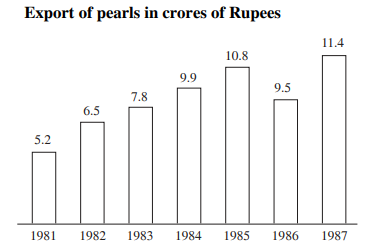
In how many years was the export above the average for the given period ?A2B3C4D5
The following graph represents the transport used by children. Study the graph and answer the given questions.
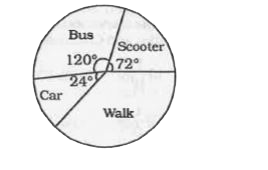
If 10 students come by car, how many come by bus ?
View SolutionThe circle graph given here shows the spendings of a country on various sports during a particular year, study the graph carefully and answer the questions given below it.
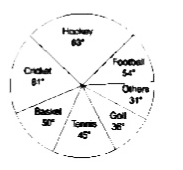
What per cent of the total spendings is spent on tennis ?
View SolutionThe given bar graph shows the biscuit exports of India over a period of five years. Study the graph and answer the questions that follows

In which two year was the value per tonne equal?
View SolutionThe following bar graph shows the number of students in a particular class of school. Then, answer the following questions.
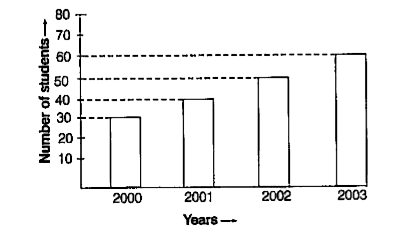
Is the number of students in the year 2002 is twice that in the year 2000?
View SolutionThe line graph shows the average hours per day spent by teenagers playing outdoor games. Study the diagram and answer the following questions.
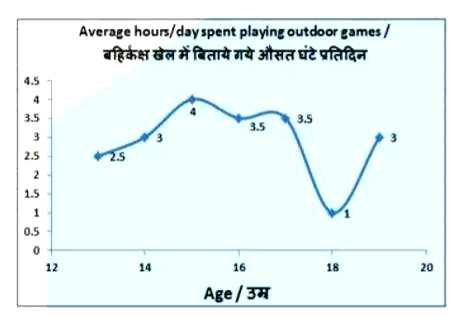
How many hours does a 16 year old spend playing outdoor games in a week?
View Solution
