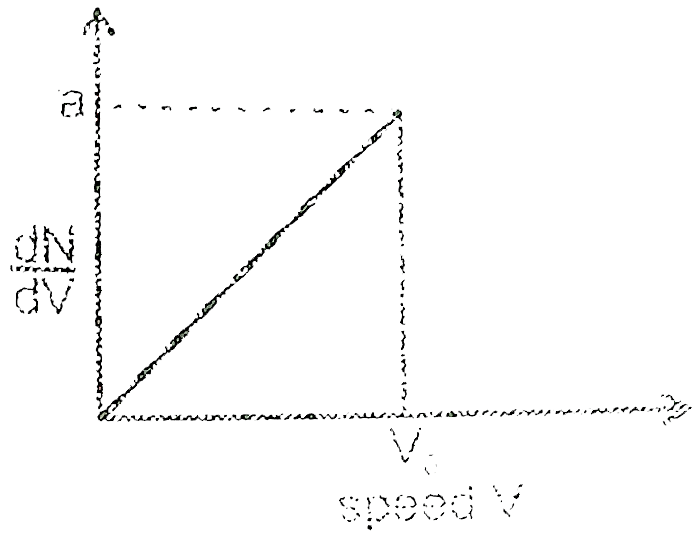
Graph shows a hypothetical speed distribution for a sample of gas particle :- (for)
_E01_138_Q01.png)
The value of a is .
The ratio is equal to .
The ratio is equal to .
Three fourth of the total particle has a speed between and .
The correct Answer is:A, B, C, D
Area under the curves is equal to number of molecules of the gas sample.
Hence
Area under the curve from to is of total area
Topper's Solved these Questions
- GEOMETRICAL OPTICSBook:ALLENChapter:GEOMETRICAL OPTICSExercise:EXERCISE -03
Explore 10 Videos
- GEOMETRICAL OPTICSBook:ALLENChapter:GEOMETRICAL OPTICSExercise:ASSERTION-REASON
Explore 36 Videos
- GEOMETRICAL OPTICSBook:ALLENChapter:GEOMETRICAL OPTICSExercise:EXERCISE -01
Explore 65 Videos
- CURRENT ELECTRICITYBook:ALLENChapter:CURRENT ELECTRICITYExercise:EX.II
Explore 66 Videos
- GRAVITATIONBook:ALLENChapter:GRAVITATIONExercise:EXERCISE 4
Explore 9 Videos
Similar Questions
Graph shows a hypothetical speed distribution for a sample of N gas particle (for V>V0,dNdV=0)

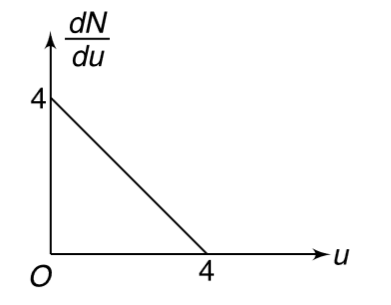
View SolutionA hypothetical gas sample has its molecular speed distribution graph as shown in the figure. The speed (u) and dNdu have appropriate units. Find the root mean square speed of the molecules. Do not worry about units.

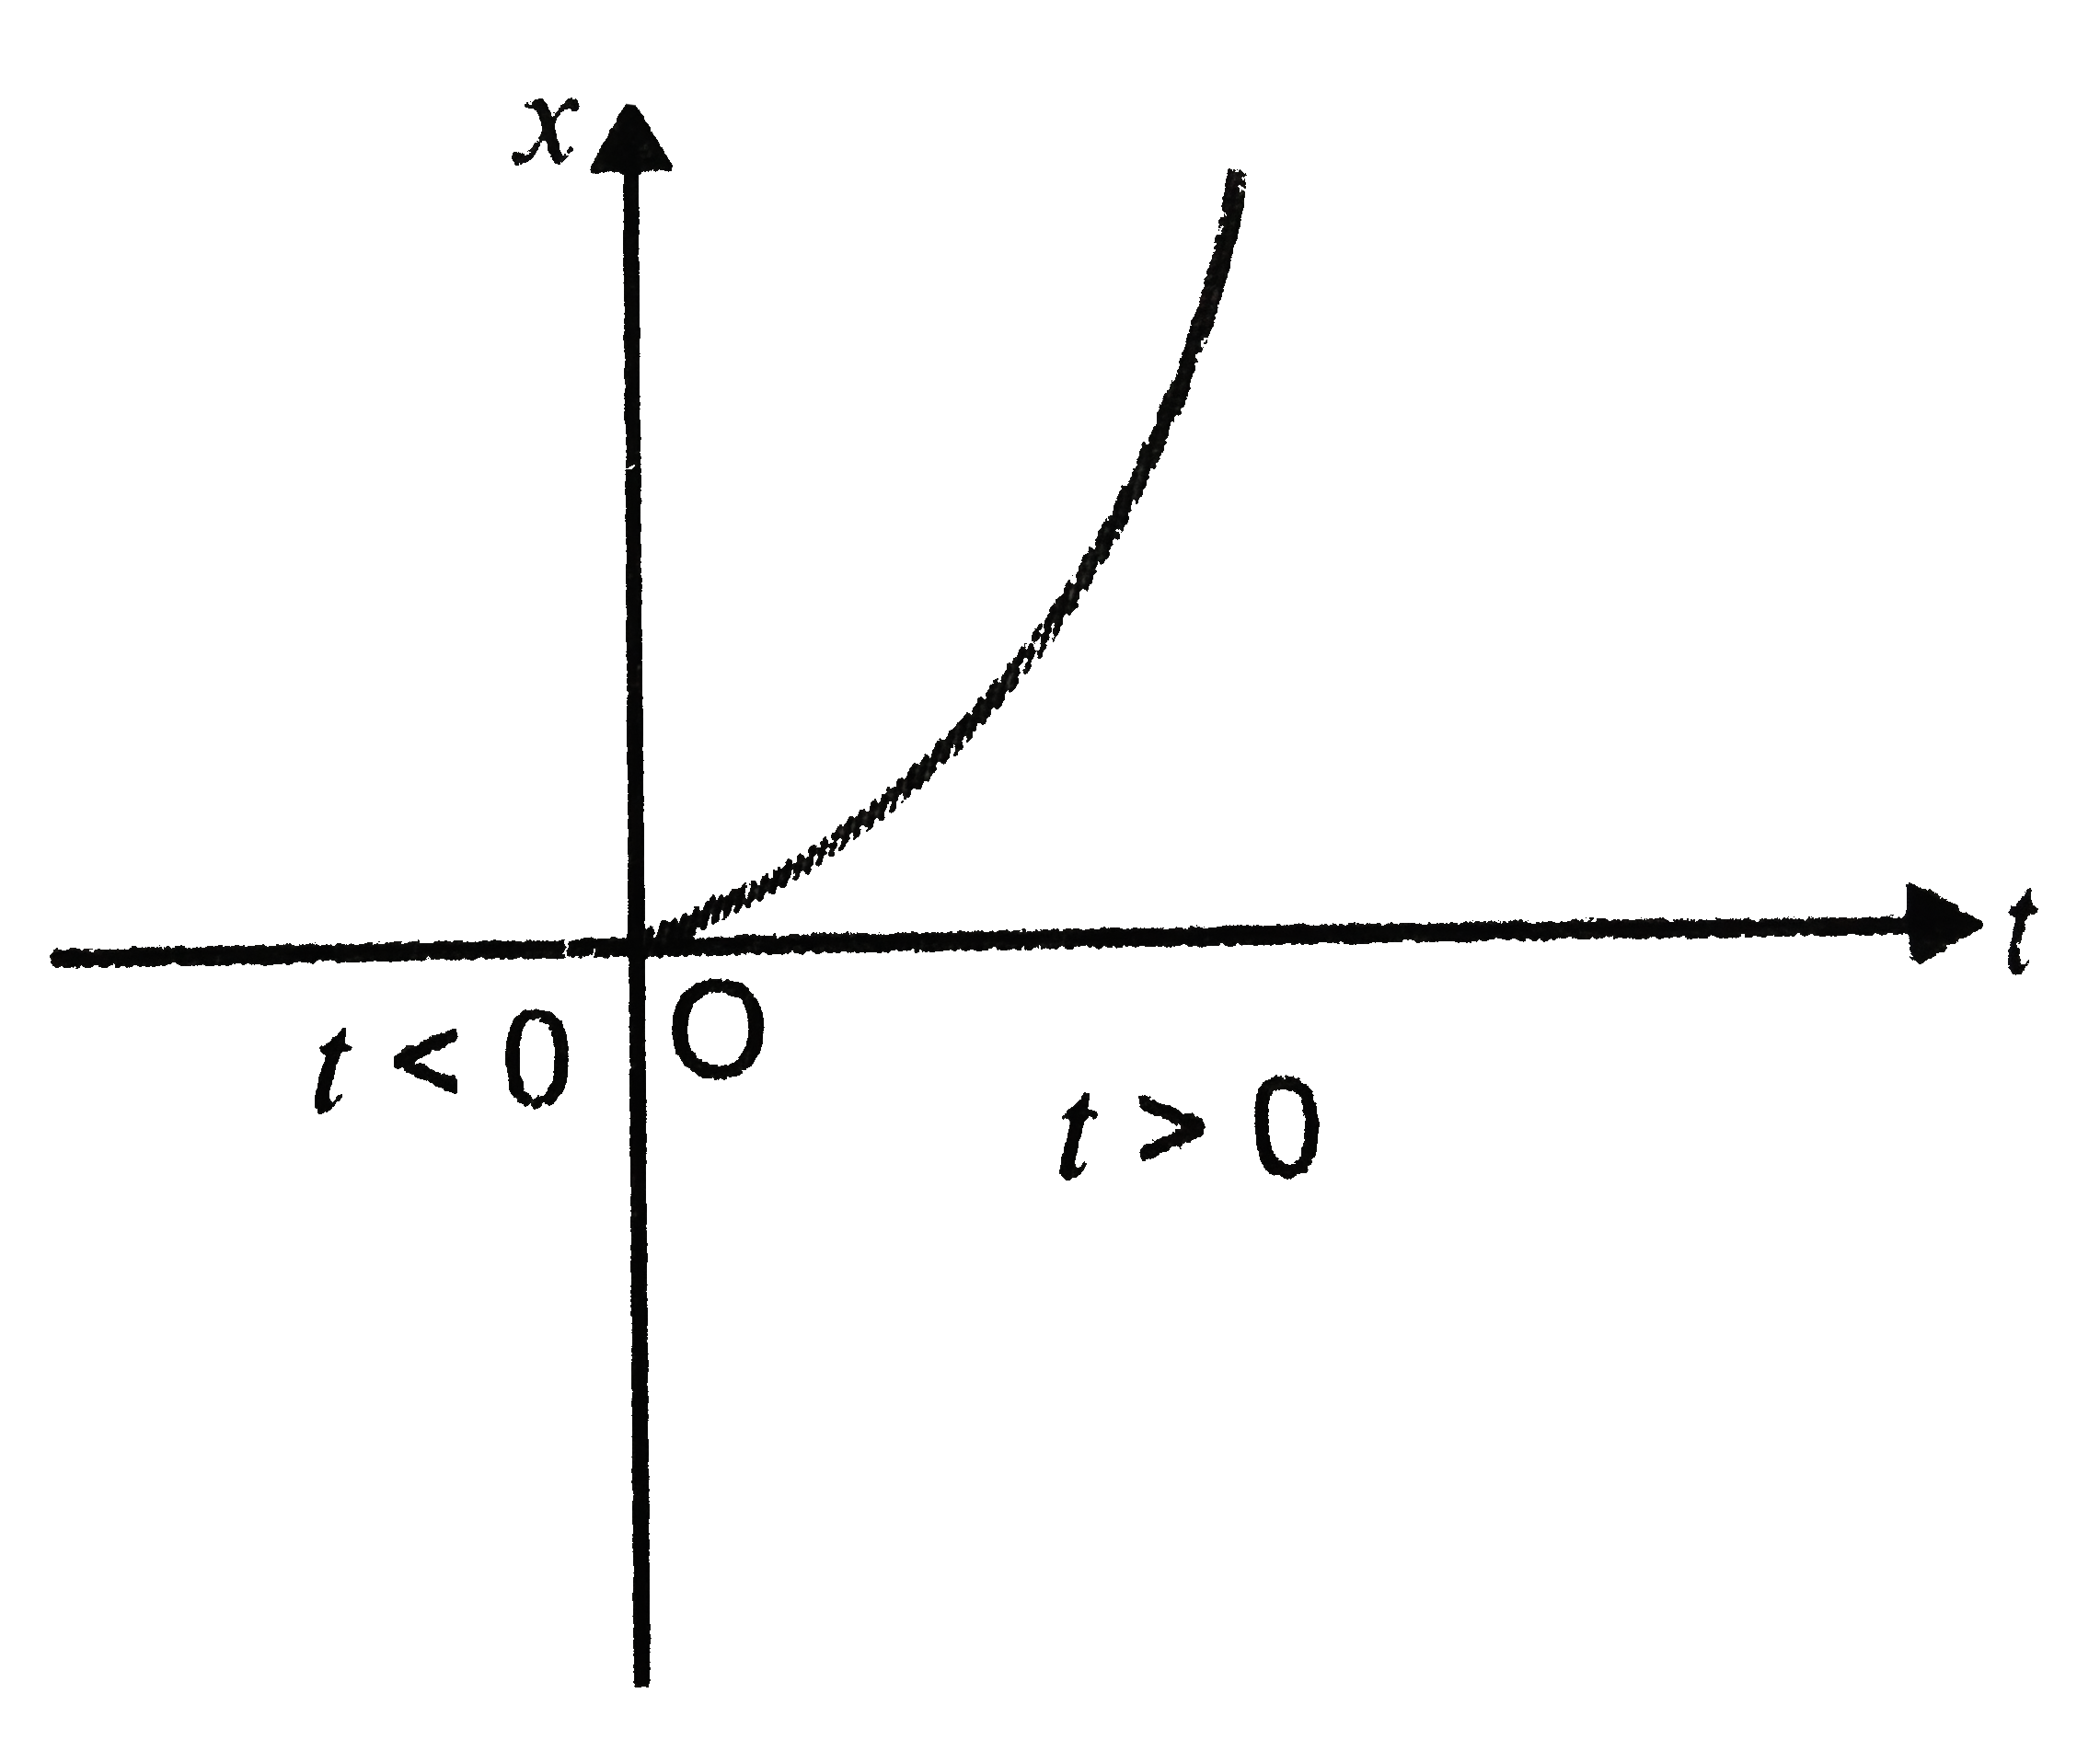
View SolutionFig. shows x−t plot of one dimensional motion a particle. Is it correct to say from the graph that the particle moves in a straight line for t<0 and on a parabolic path form t>0? If not, suggest a suitable physical context for this graph.

View SolutionConsider an 1100 particels gas system with speeds distribution as follows :
1000 particles each with speed 100m/s
2000 particles each wityh speed 200m/s
4000 particles each with speed 300m/s
3000 particles each with speed 400m/s and 1000 particles each with speed 500m/s
Find the average speed, and rms speed.
View SolutionIn a binomial distribution n=20,q=0.75. Then mean =
View Solution
The graph abvoe shows the frequencu distribution of a list of randomly generated integers between 0 and 6. What is the mean of the last of numbers?
View SolutionPosition-time graph for a particle moving along x− direction is as shown in the figure. Average speed of the particle from t=0 to t=4 is :

View SolutionFor binomial distribution n=10,q=0.4, then mean is
View SolutionIn a binomial distribution, if n=20, q=0.75,then write its mean.
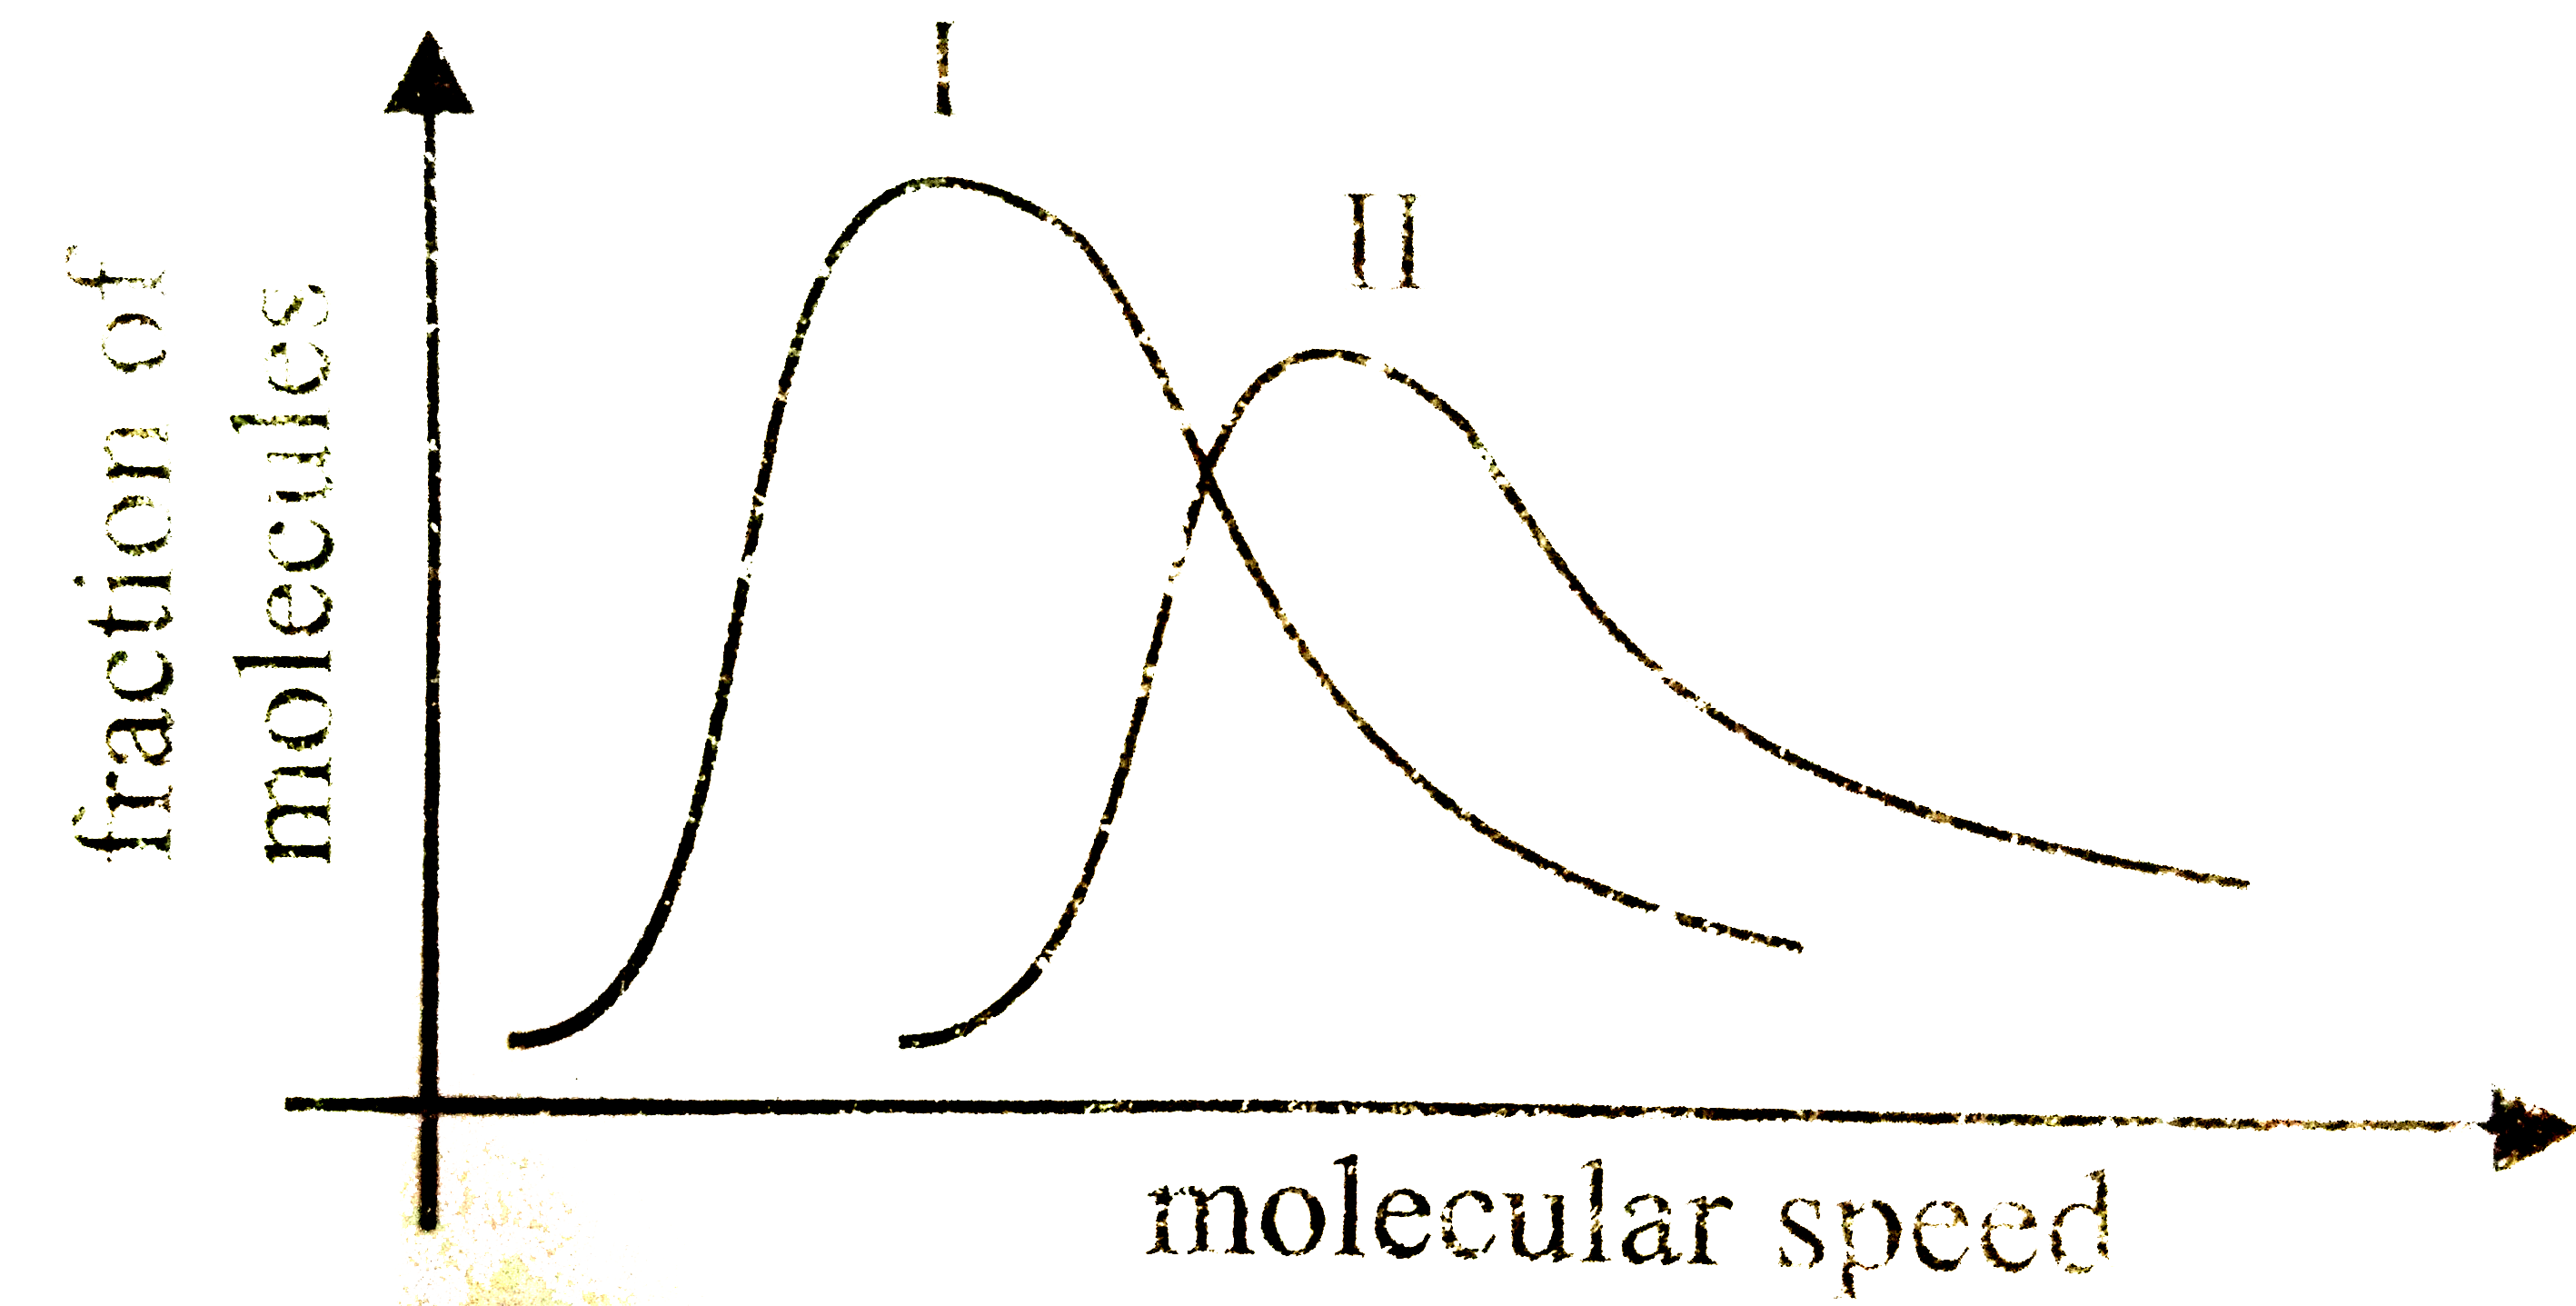
View SolutionThe graphs representing distribution of molecular speeds at 300 K for gases CI2 and N2 are as show in figure :

Select the correct option . I graph is for N 2 all II is for C I 2 II graph is for N 2 and I is for C I 2 Either graph can be taken for N 2 or C I 2 Information is not sufficient .
View Solution