Following graphs shows the variation in the intensity of heat radiations by the the black body and frequency at a fixed temperature . Choose the correct option.
A
_E01_029_O01.png)
B
_E01_029_O02.png)
C
_E01_029_O03.png)
D
_E01_029_O04.png)
Video Solution
Text Solution
The correct Answer is:C
According to Wien's law λmα1T⇒vmαT. As the temperature of body increases, frequency corresponding to maximum energy in radiation (vm) increases. Also area under the curve
∫EvdvαT4
|
Topper's Solved these Questions
- GEOMETRICAL OPTICSBOOK - ALLENCHAPTER - GEOMETRICAL OPTICSEXERCISE - EXERCISE -02
82 Videos
- GEOMETRICAL OPTICSBOOK - ALLENCHAPTER - GEOMETRICAL OPTICSEXERCISE - EXERCISE -03
10 Videos
- GEOMETRICAL OPTICSBOOK - ALLENCHAPTER - GEOMETRICAL OPTICSEXERCISE - SOME WORKED OUT EXAMPLES
83 Videos
- CURRENT ELECTRICITYBOOK - ALLENCHAPTER - CURRENT ELECTRICITYEXERCISE - EX.II
66 Videos
- GRAVITATIONBOOK - ALLENCHAPTER - GRAVITATIONEXERCISE - EXERCISE 4
9 Videos
Similar Questions
Knowledge Check
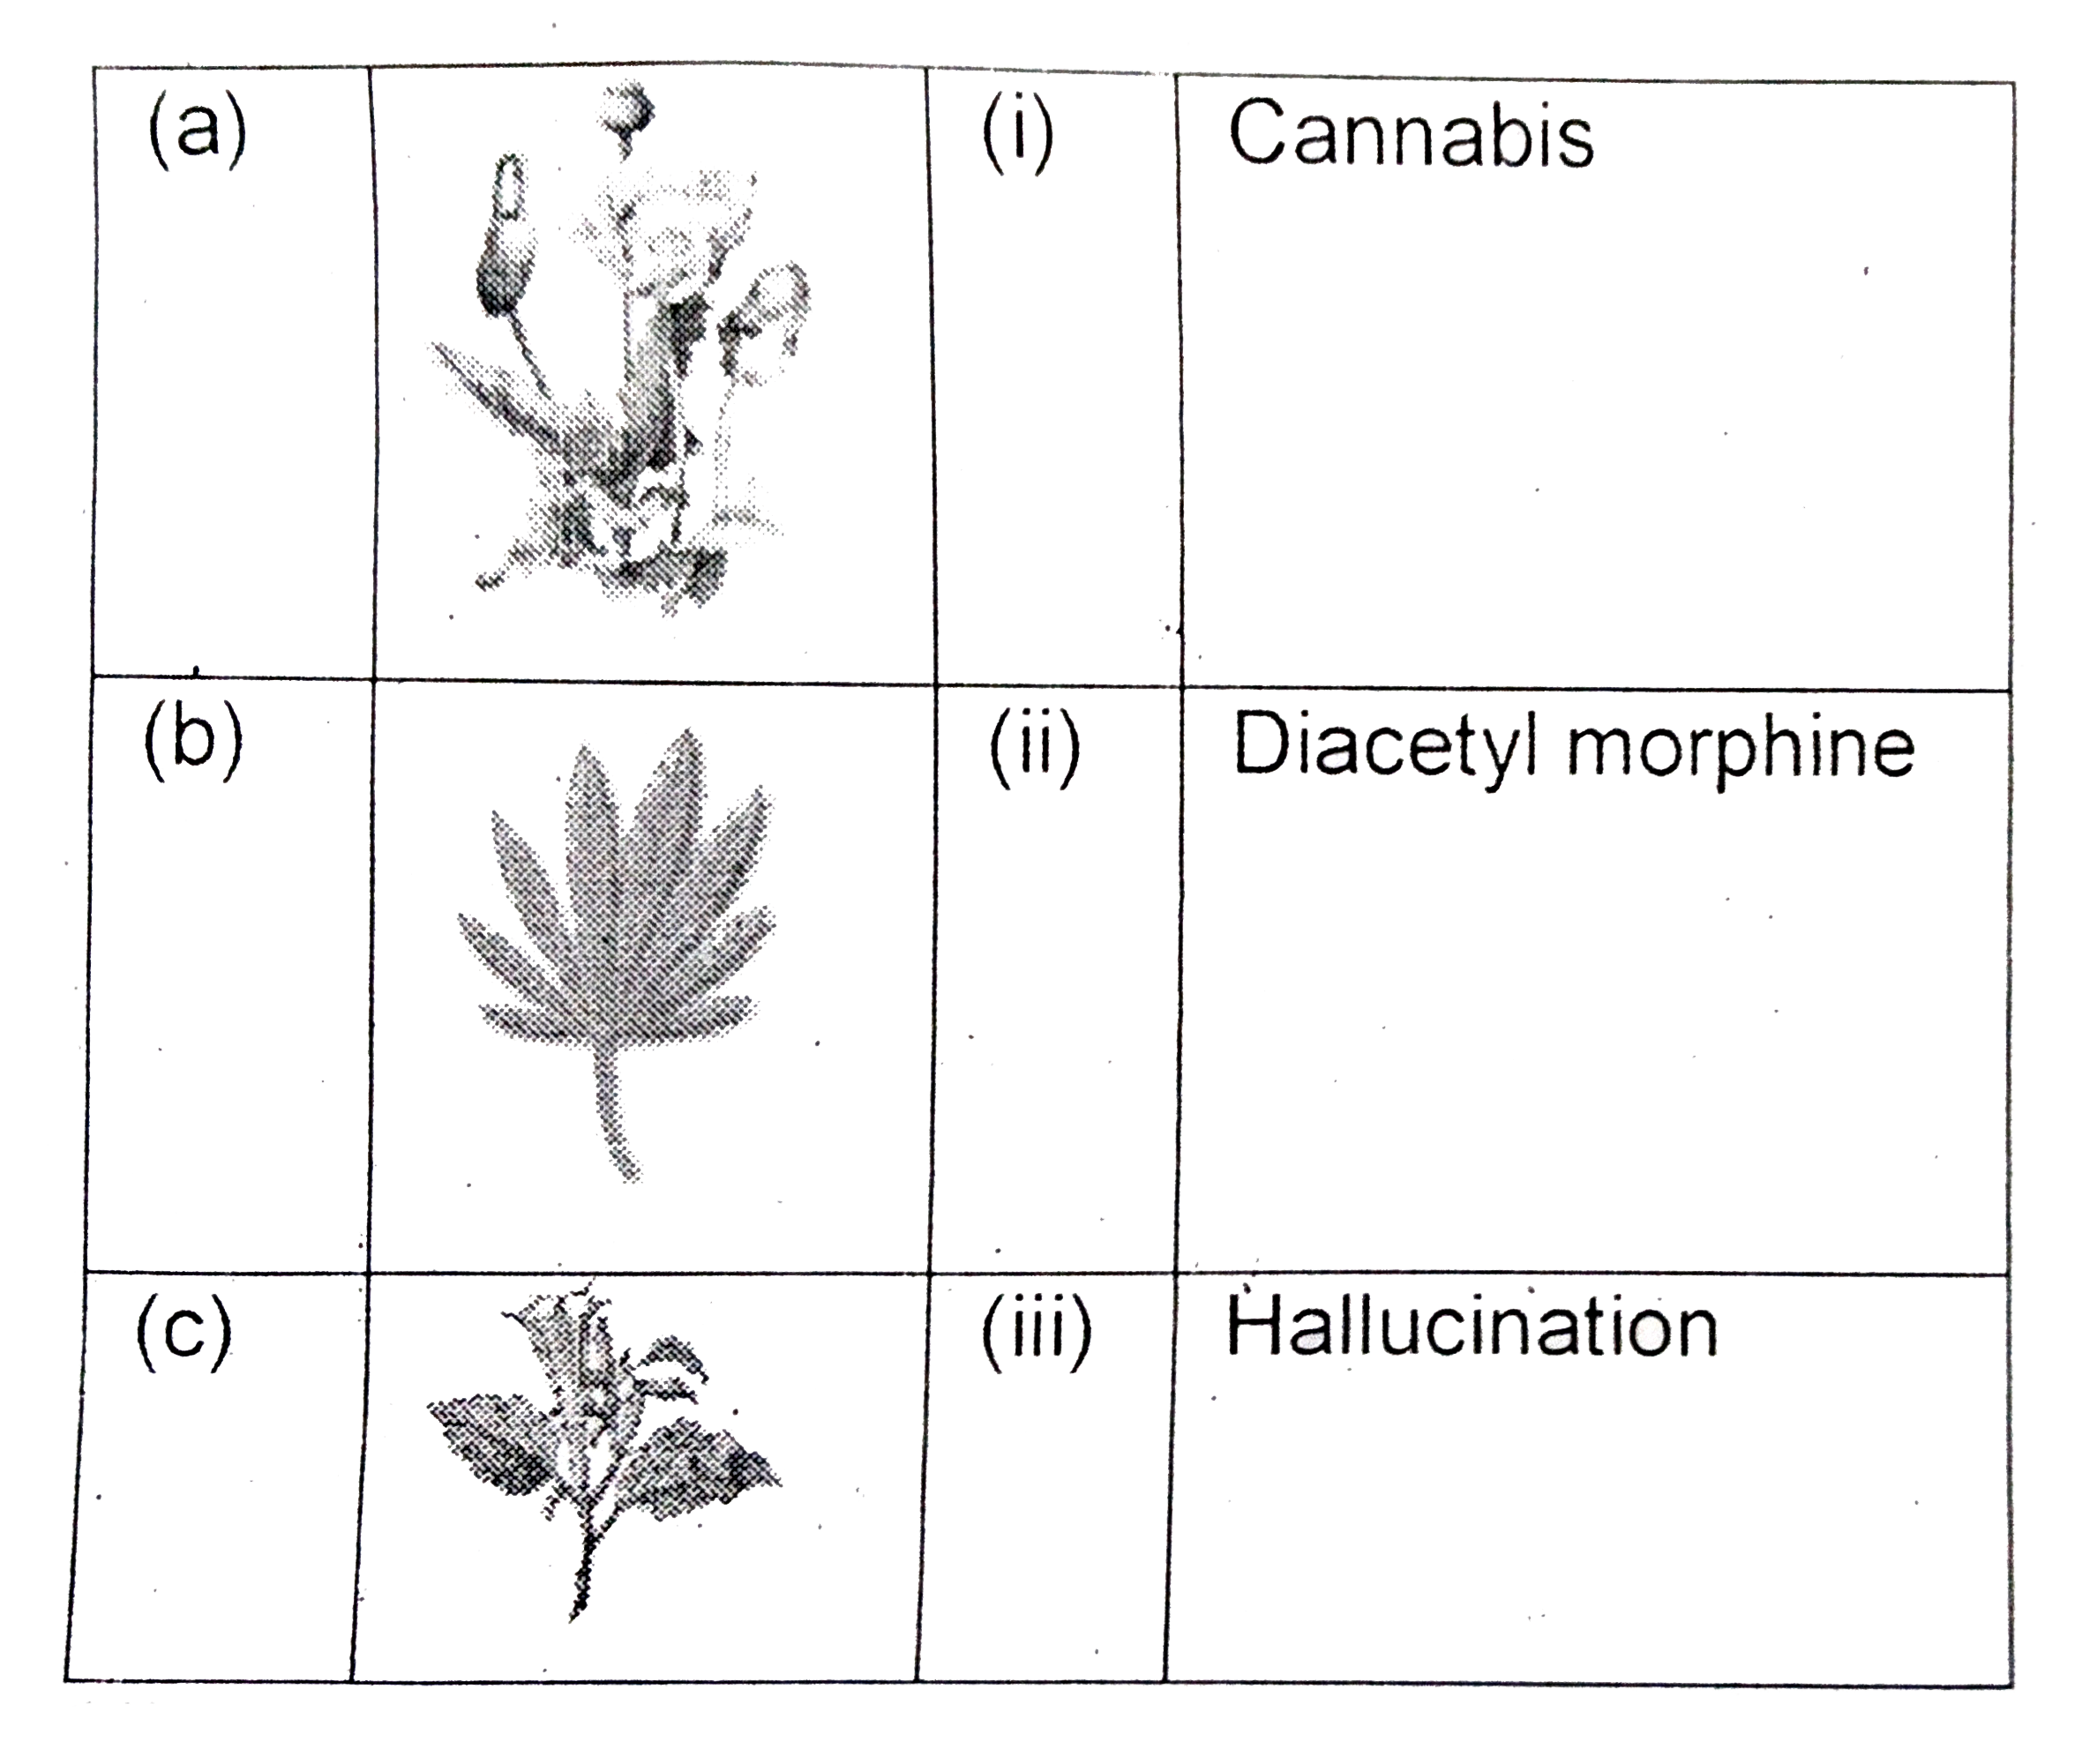
Match the following

Choose the correct option:AA-3, B-2, C-1, D-4BA-4, B-1, C-3, D-2CA-2, B-4, C-1, D-3DA-4, B-1, C-2, D-3Match the following

Choose the correct option:AA-1, B-3, C-4, D-2BA-4, B-1, C-3, D-2CA-2, B-4, C-1, D-3DA-4, B-3, C-1, D-2
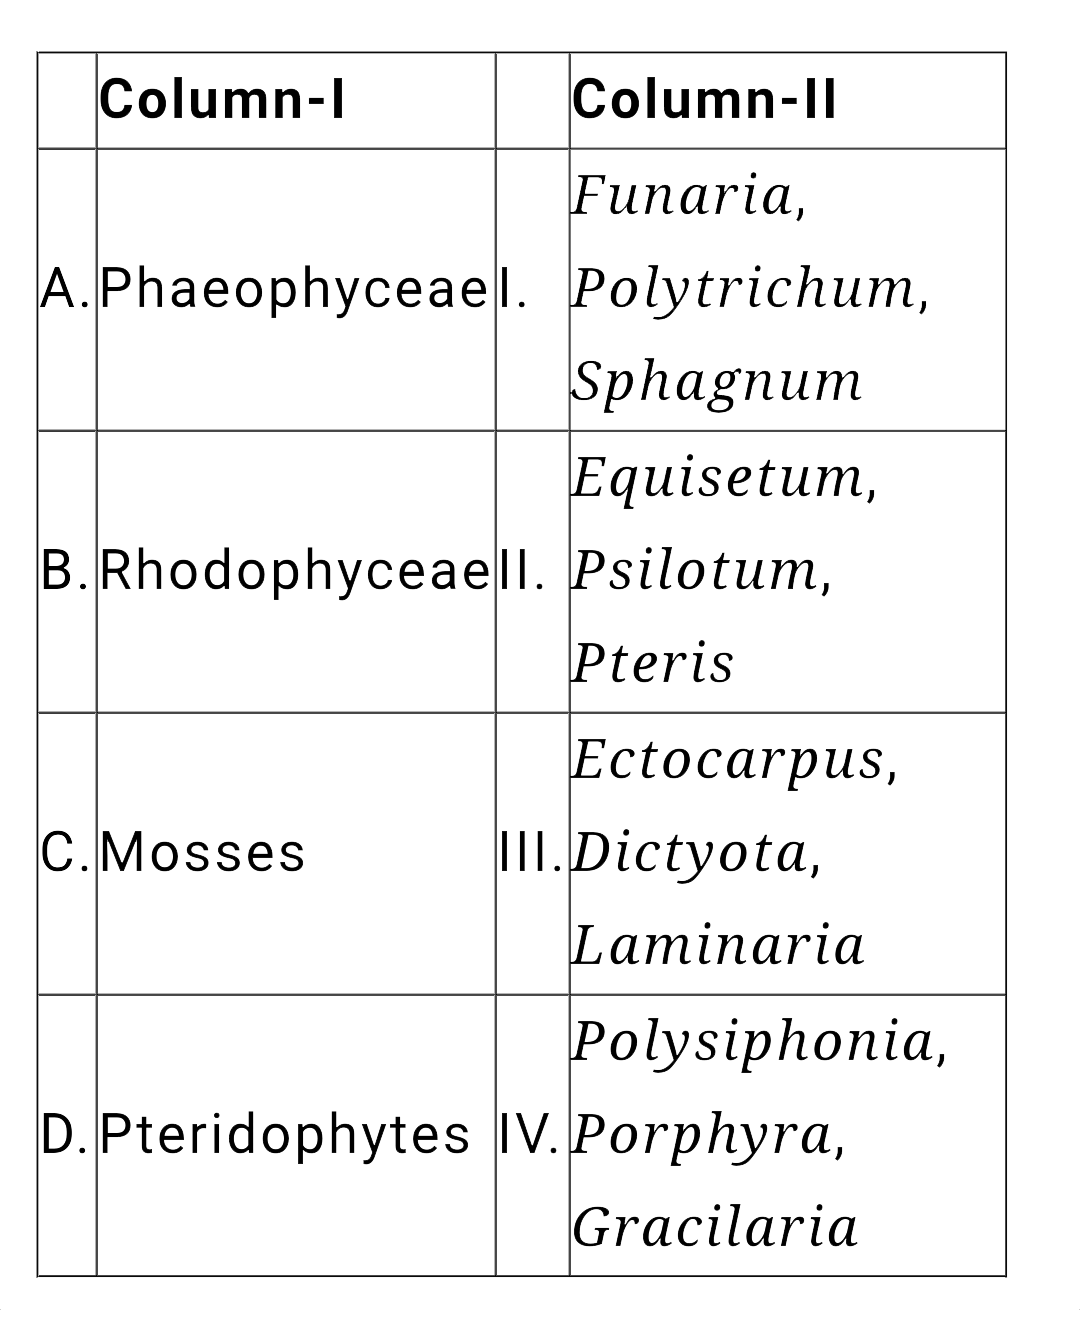
Match the following and choose the correct option

View SolutionMatch the following and choose the correct option .

View SolutionMatch the following and choose the correct options

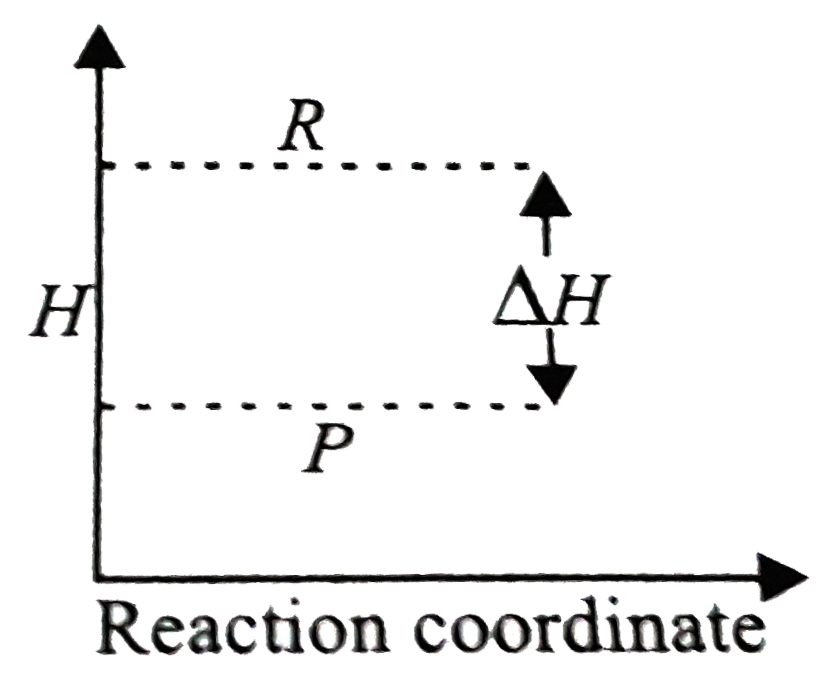
View SolutionConsidering the graph of 1s , choose the correct option:
View SolutionOn the P−T graph of an ideal gas, choose the correct option(s):
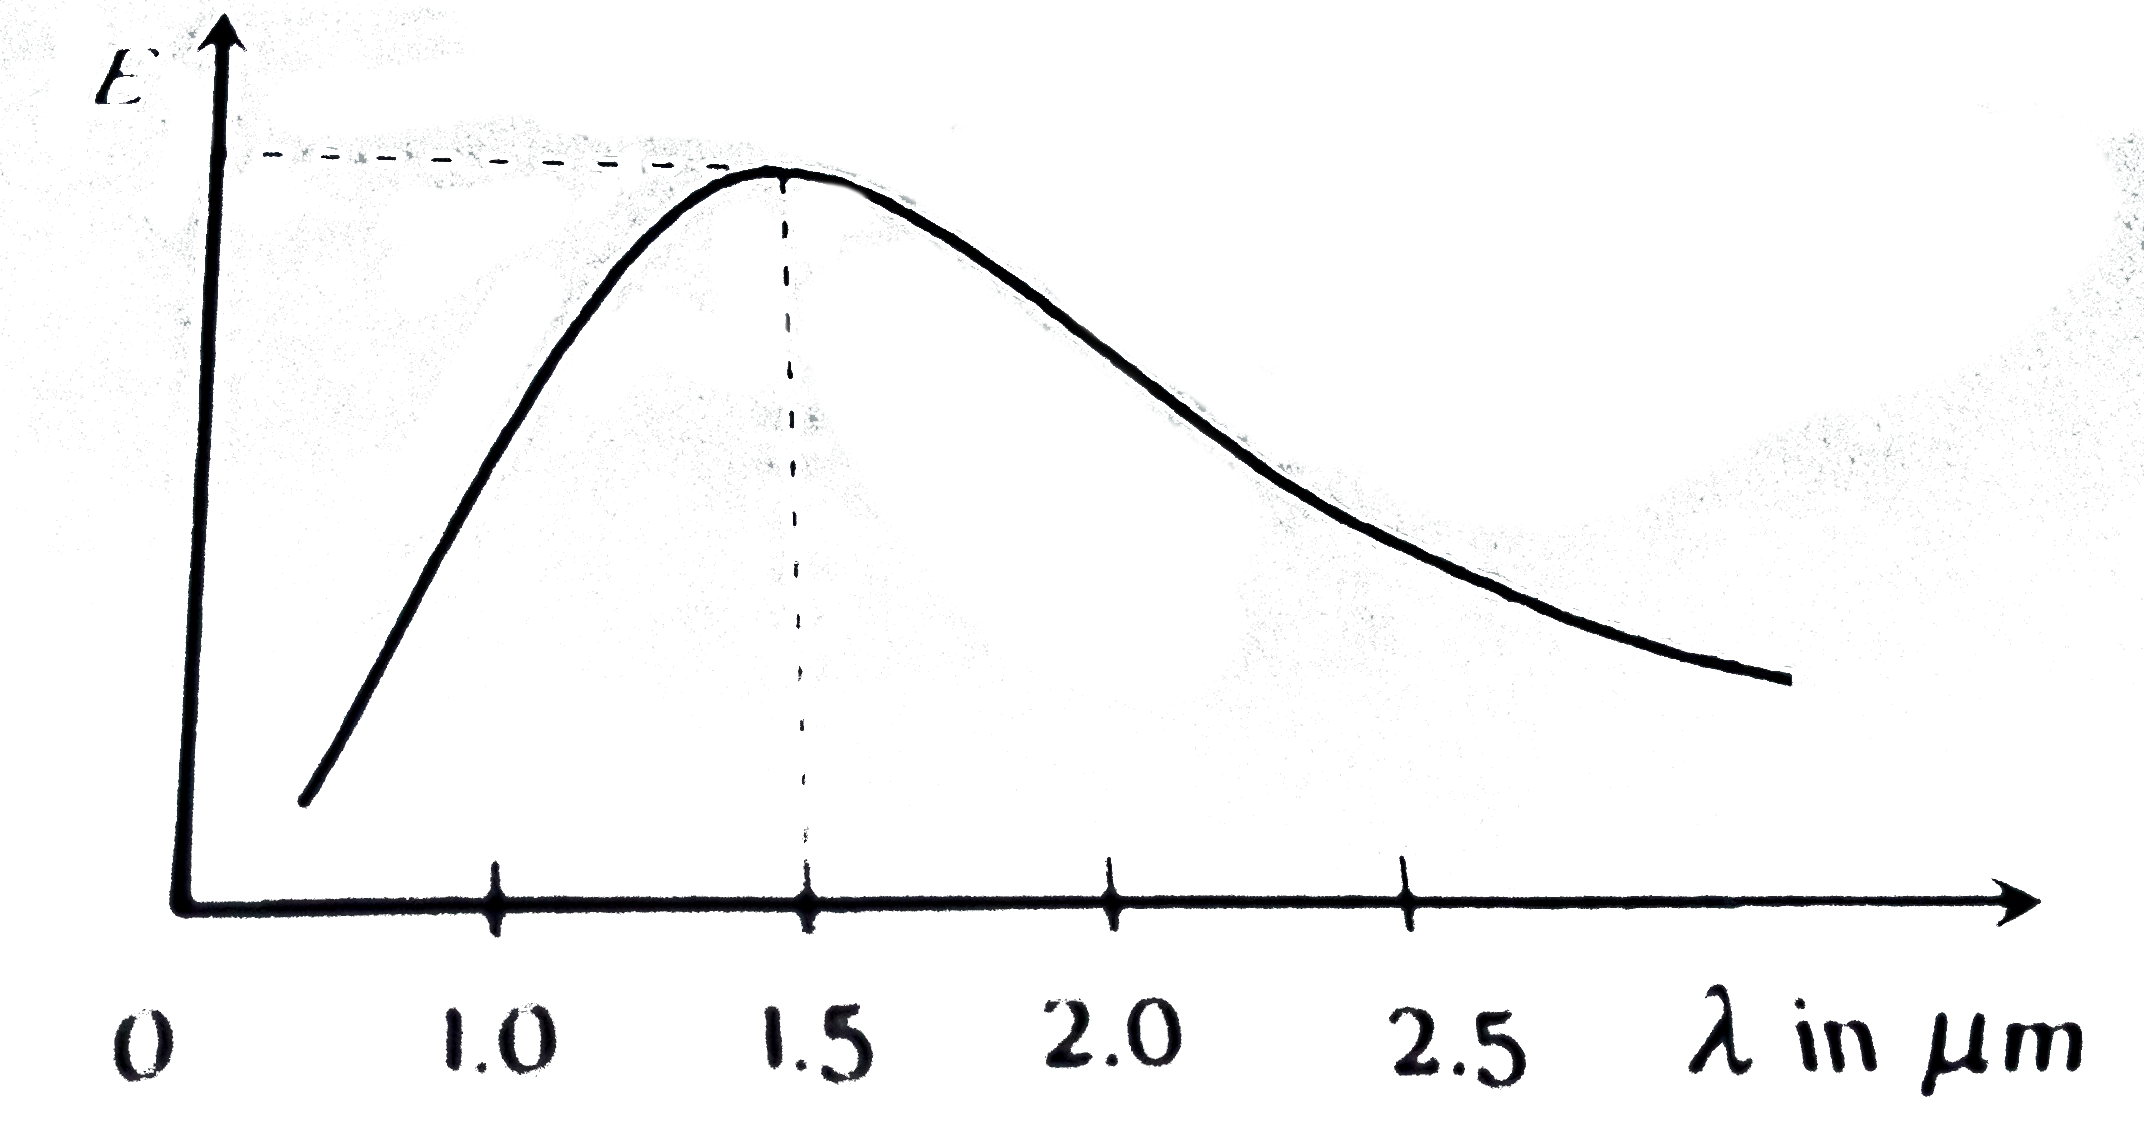
View SolutionIn the figure, the distribution of energy density of the radiation emitted by a black body at a given temperature is shown. The possible temperature of the black body is

View Solution

