The graph below shows V-p curve for three processes. Choose the correct statement(s) :

Work done is maximum in process 1 .
Temperature must increase in process 2 & 3 .
Heat must be supplied in process 1.
If final volume of gas in process 1,2 and 3 are same then temperature must be same.
The correct Answer is:A, C
Area P−V curve and volume axis represent work.
Internal energy in 1 decreases (expansion at constant pressure)
In process 2 and 3 internal energy may decreased depending on the process .
Since final pressure of 1,2 & 3 are different, final temperature must also be different.
Topper's Solved these Questions
- BOOK - ALLENCHAPTER - GEOMETRICAL OPTICSEXERCISE - EXERCISE -0165videos
GEOMETRICAL OPTICS
- BOOK - ALLENCHAPTER - GEOMETRICAL OPTICSEXERCISE - EXERCISE -0282videos
GEOMETRICAL OPTICS
- BOOK - ALLENCHAPTER - GEOMETRICAL OPTICSEXERCISE - subjective14videos
GEOMETRICAL OPTICS
- BOOK - ALLENCHAPTER - CURRENT ELECTRICITYEXERCISE - EX.II66videos
CURRENT ELECTRICITY
- BOOK - ALLENCHAPTER - GRAVITATIONEXERCISE - EXERCISE 49videos
GRAVITATION
Similar Questions
Choose the correct statements(s):
View SolutionChoose correct statement(s).
View SolutionChoose the correct statement(s) regarding SHM
View SolutionConsider the following graphs

Choose the correct statementsView SolutionChoose the correct statement (s) out of the following
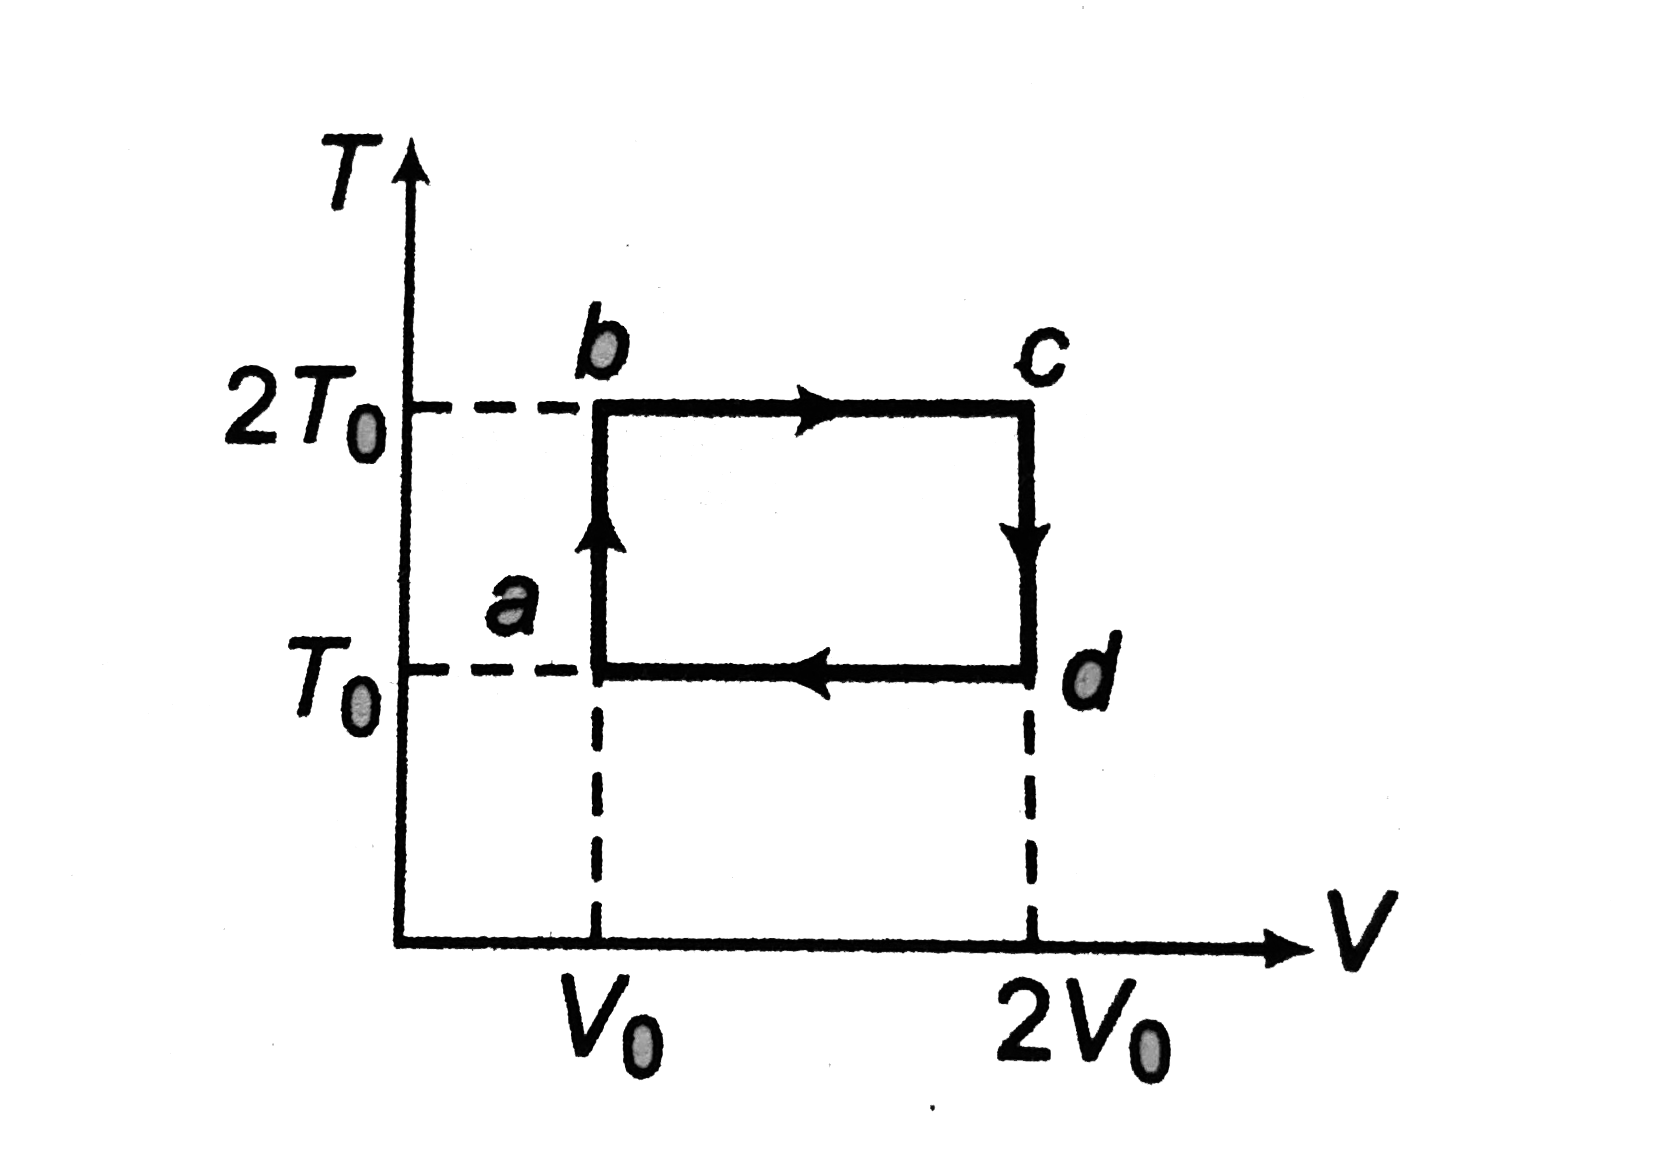
View SolutionT-V diagram of two moles of a monoatomic gas is as shown in figure.
For the process abcda choose the correct options given below
 View Solution
Circuit as shown in figure below, choose the correct statement
 View Solution
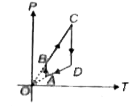
A. P . T graph is shown for a cyclic process . Select correct statement regarding the
 View Solution
The temperature coefficient of the cell is (∂E∂T)P. Choose the correct statements (s).
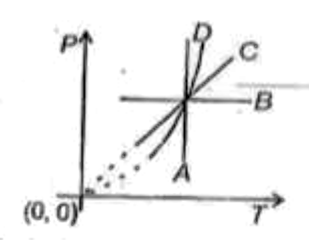
View SolutionFollowing figure shows P-T graph for four processes A, B, C and D.Select the correct alternative
 View Solution
