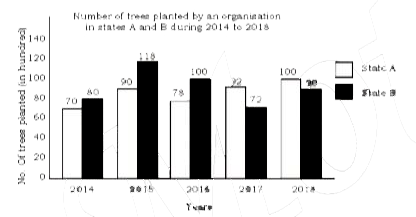
बार ग्राफ का अध्ययन करे और उसके बाद दिए गए प्रश्न का उत्तर दे।

राज्य B में 2015 और 2017 के दौरान लगाए गए पेड़ो की कुल संख्या, राज्य A में 2014, 2016 और 2017 के दौरान लगाए गए पेड़ो की कुल संख्या से कितने प्रतिशत कम है ? (आपका उत्तर दशमलव के एक स्थान तक सही होना चाहिए। )
19.8
21.4
20.8
20.1
The correct Answer is:C
Step by step video, text & image solution for बार ग्राफ का अध्ययन करे और उसके बाद दिए गए प्रश्न का उत्तर दे। राज्य B में 2015 और 2017 के दौरान लगाए गए पेड़ो की कुल संख्या, राज्य A में 2014, 2016 और 2017 के दौरान लगाए गए पेड़ो की कुल संख्या से कितने प्रतिशत कम है ? (आपका उत्तर दशमलव के एक स्थान तक सही होना चाहिए। ) by Maths experts to help you in doubts & scoring excellent marks in Class 14 exams.
Updated on:21/07/2023Topper's Solved these Questions
Similar Questions
यदि A:B=2:3 और B:C=3:7, तो A+B:B+C:C+A क्या होगा?
View SolutionP और Q की वर्तमान आयु के बीच का क्रमशः अनुपात 3 : 4 है। चार वर्ष बाद Q, P से पाँच वर्ष बड़ा होगा।P की वर्तमान आयु कितनी है?
View Solutionएक लड़का प्रश्न 15और1/5 के योय को एक में से घटाए और उत्तर दशमलव में दे" है उत्तर 045 देता है। उसके उत्तर में त्रुटि की प्रतिशत बताइए ?
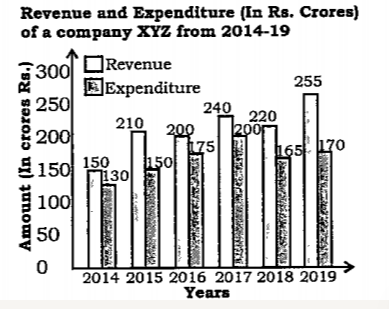
View SolutionStudy the given graph and answer the question that follows.

The total revenue in 2015 and 2017 is what per cent of the total expenditure of the company in 2016,2018 and 2019 ( correct to one decimal place)?
दिए गए ग्राफ का अध्ययन करें और नीचे दिए गए प्रश्न का उत्तर दें। 2015 और 2017 2 कुल आय (revenue), 2016, 2018 और 2019 में कंपनी के कुल व्यय (Expenditure) की कितनी प्रतिशत है (दशमलव के बाद एक
स्थान तक गणना करें?
View SolutionStudy the following bar graph and answer the questions given below. . The number of boys in school B is what percentage of the number of students in that school? निम्नांकित बार ग्राफ का अध्ययन कीजिए और उसके बाव दिए गए प्रश्न का उत्तर दीजिए। . स्कूल B में लड़कों की संख्या, उस स्कूल में विद्यार्थियों की कुल संख्या की कितने प्रतिशत है?
View SolutionThe table shows the production of different types of cars (in thousands).
 The total production of type D cars during 2015 to 2017 is what percent less than the total production of type E cars during 2014,2015,2016 and 2018 taken together?
2015 से 2017 के दौरान D प्रकार की कारों का कुल उत्पादन 2014, 2015, 2016 और 2018 में E प्रकार की कारों के कुल उत्पादन से कितना प्रतिशत कम है ?
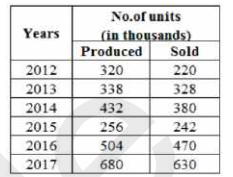
View SolutionThe table given below shows the number of units of a product produced and sold by a company in 6 years.
निम्न तालिका एक कंपनी द्वारा छह वर्षों के दौरान उत्पादित और बेचे गए उत्पाद की यूनिटों की संख्या दर्शाती है| Find the ratio of the total number of units sold in 2013 and 2015 to the number of units produced in
2015 and 2016?
2013 और 2015 में बेची गई उत्पाद के यूनिटों की कुल संख्या तथा 2015 और 2016 में उत्पादित यूनिटों की संख्या का अनुपात ज्ञात कीजिए ?
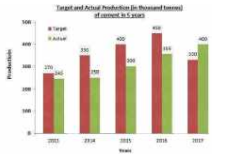
View SolutionThe bar graph given below shows the target and actual production of cement ( in thousand tons ) during 2013-2017. What percentage of the total targeted production of cement from 2013 to 2017 is the total actual production in 2014, 2015 and 2017? ( correct to one decimal place )
नीचे दिया गया दंड आरेख 2013-2017 के दौरान सीमेंट के लक्षित और वास्तविक उत्पादन (हजार टन में) को दर्शाता है |
2013 से 2017 तक सीमेंट के कुल लक्षित उत्पादन का कितना प्रतिशत, 2014, 2015 और 2017 में कुल वास्तविक उत्पादन है ? (दशमलव के एक स्थान तक)
View SolutionThe given table represents the number of engineers recruited by four companies A,B,C and D over the years. Study the table carefully and answer the questions that follows: The ratio of the total number of engineers recruited by companies A and B in 2015 and 2018 to the total number of engineers recruited by C and D in 2014 and 2018 is: दी गयी तालिका चार कंपनियों A, B, C और D के द्वारा इन वर्षों के दौरान भर्ती किये गए इंजीनियरों की संख्या दर्शाती है | इस तालिका का ध्यानपूर्वक अध्ययन करें तथा इसके बाद पूछे गए प्रश्न का उत्तर दें | कंपनी A और B के द्वारा 2015 और 2018 में भर्ती किये गए इंजीनियरों की कुल संख्या एवं C तथा D के द्वारा 2014 और 2018 में भर्ती किये गए इंजीनियरों की कुल संख्या के बीच अनुपात ज्ञात करें |
View SolutionThe given table represents the number of engineers recruited by four companies A,B,C and D over the years. Study the table carefully and answer the questions that follows: The number of years in which the number of engineers recruited by company D is less than the average number of engineers recruited by company B in the given six years, is: दी गयी तालिका चार कंपनियों A, B, C और D के द्वारा इन वर्षों के दौरान भर्ती किये गए इंजीनियरों की संख्या दर्शाती है | इस तालिका का ध्यानपूर्वक अध्ययन करें तथा इसके बाद पूछे गए प्रश्न का उत्तर दें | ऐसे कितने वर्ष हैं जिनमें कंपनी D के द्वारा भर्ती किये गए इंजीनियरों की संख्या दिए गए छः वर्षों की अवधि में कंपनी B के द्वारा भर्ती किये गए इंजीनियरों की औसत संख्या से कम है?
View SolutionThe given table represents the number of engineers recruited by four companies A,B,C and D over the years. Study the table carefully and answer the questions that follows:The total number of engineers recruited by company A in 2014 to 2017 is what percentage more than the total number of engineers recruited by all the four companies in 2019? दी गयी तालिका चार कंपनियों A, B, C और D के द्वारा इन वर्षों के दौरान भर्ती किये गए इंजीनियरों की संख्या दर्शाती है | इस तालिका का ध्यानपूर्वक अध्ययन करें तथा इसके बाद पूछे गए प्रश्न का उत्तर दें | कंपनी A के द्वारा 2014 से 2017 की अवधि में भर्ती किये गए इंजीनियरों की कुल संख्या सभी चार कंपनियों के द्वारा 2019 में भर्ती किये गए इंजीनियरों की कुल संख्या से कितना प्रतिशत अधिक है ?
View SolutionThe given table represents the number of engineers recruited by four companies A,B,C and D over the years. Study the table carefully and answer the questions that follows: The total number of engineers recruited by the company B in 2014 and 2017 is what percentage of the total number of engineers recruited by C during 2015 to 2019? दी गयी तालिका चार कंपनियों A, B, C और D के द्वारा इन वर्षों के दौरान भर्ती किये गए इंजीनियरों की संख्या दर्शाती है | इस तालिका का ध्यानपूर्वक अध्ययन करें तथा इसके बाद पूछे गए प्रश्न का उत्तर दें | कंपनी B के द्वारा 2014 और 2017 में भर्ती किये गए इंजीनियरों की कुल संख्या C के द्वारा 2015 से 2019 के दौरान भर्ती किये गए इंजीनियरों की कुल संख्या का कितना प्रतिशत है ?
View SolutionThe given table represents the number of computers sold by four dealers A,B, C and D during the first six months of 2016. Study the table carefully and answer the questions that follows: दी गयी तालिका चार विक्रेताओं A, B, C और D के द्वारा 2016 के पहले छः महीनों में बेचे गए कंप्यूटरों की संख्या दर्शाती है | इस तालिका का ध्यानपूर्वक अध्ययन करें तथा पूछे गए प्रश्नों का उत्तर दें | What is the ratio of the total number of computers sold by dealer A in February, April and May to the total number of computers sold by dealer D in March, May and June? / विक्रेता A के द्वारा फरवरी, अप्रैल और मई में बेचे गए कंप्यूटरों की कुल संख्या तथा विक्रेता D के द्वारा मार्च, मई और जून में बेचे गए कंप्यूटरों की कुल संख्या के बीच क्या अनुपात है ?
View SolutionThe given table represents the number of computers sold by four dealers A,B, C and D during the first six months of 2016. Study the table carefully and answer the questions that follows: दी गयी तालिका चार विक्रेताओं A, B, C और D के द्वारा 2016 के पहले छः महीनों में बेचे गए कंप्यूटरों की संख्या दर्शाती है | इस तालिका का ध्यानपूर्वक अध्ययन करें तथा पूछे गए प्रश्नों का उत्तर दें | The total number of computers sold by dealer B in April, May and June is what percentage of the total number of computers sold by all the dealers in February and April? / विक्रेता B के द्वारा अप्रैल, मई और जून में बेचे गए कंप्यूटरों की कुल संख्या सभी विक्रेताओं के द्वारा फरवरी एवं अप्रैल में बेचे गए कंप्यूटरों की कुल संख्या का कितना प्रतिशत है ?
View SolutionThe given table represents the number of computers sold by four dealers A,B, C and D during the first six months of 2016. Study the table carefully and answer the questions that follows: दी गयी तालिका चार विक्रेताओं A, B, C और D के द्वारा 2016 के पहले छः महीनों में बेचे गए कंप्यूटरों की संख्या दर्शाती है | इस तालिका का ध्यानपूर्वक अध्ययन करें तथा पूछे गए प्रश्नों का उत्तर दें | The total number of computers sold by dealer A during February to June is what percentage more than the total number of computers sold by all the dealers in June?(Correct to one decimal place) / फरवरी से जून के दौरान विक्रेता A के द्वारा बेचे गए कंप्यूटरों की कुल संख्या सभी विक्रेताओं के द्वारा जून में बेचे गए कंप्यूटरों की कुल संख्या से कितना प्रतिशत अधिक है ?
View SolutionStudy the given graph and answer the questions that follow.
दिए गए आरेख का अध्ययन करें और उन सवालों के जवाब दें, जो अनुसरण करते हैं।
The total revenue in 2015 and 2017 is what percent of the total expenditure of the company in 2016, 2018 and 2019 (correct to one decimal place) ?
2015 और 2017 में कुल राजस्व 2016, 2018 और 2019 में कंपनी के कुल व्यय का कितना प्रतिशत है (एक दशमलव स्थान तक )?
View Solution
