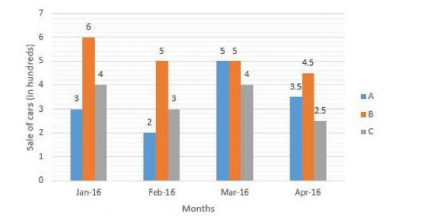
फरवरी- अप्रैल, 2016 के दौरान, A के द्वारा बेचीं गई कारो की औसत संख्या क्या थी ?
375
350
250
300
The correct Answer is:B
Step by step video, text & image solution for फरवरी- अप्रैल, 2016 के दौरान, A के द्वारा बेचीं गई कारो की औसत संख्या क्या थी ? by Maths experts to help you in doubts & scoring excellent marks in Class 14 exams.
Updated on:21/07/2023Topper's Solved these Questions
Similar Questions
यदि A:B=2:3 और B:C=3:7, तो A+B:B+C:C+A क्या होगा?
View SolutionP और Q की वर्तमान आयु के बीच का क्रमशः अनुपात 3 : 4 है। चार वर्ष बाद Q, P से पाँच वर्ष बड़ा होगा।P की वर्तमान आयु कितनी है?
View Solutionकिसान के द्वारा खेत की जुताई की गई। (कर्तृवाच्य में बदलिए)
View Solutionफरवरी क्रांति |फरवरी के बाद |OMR
View Solutionमोहन के प्रति धनराम के मन में क्या भावना थी।
View Solutionमीरा के काव्य की भाषा मुख्यतः क्या थी?
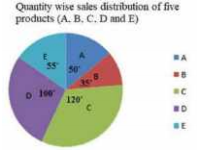
View SolutionThe given pie chart shows the quantity wise sales distribution of five products (A, B, C, D and E) of a company in 2016.
दिया गया पाई चार्ट 2016 में एक कंपनी के पाँच उत्पादों ( A, B, C, D और E ) की मात्रा वार बिक्री का वितरण दर्शाता है | If 1500 units of product D were sold in 2016 and the total number of units sold by the company in
2017 was 18% more than that sold in 2016, then the total units sold by the company in 2017 is:
यदि 2016 में वस्तु D की 1500 इकाइयाँ बेचीं गयीं और 2017 में कंपनी द्वारा बेचीं गयी इकाइयों की कुल संख्या 2016 में बेचीं गयी इकाइयों की कुल संख्या से 18% अधिक थी, तो 2017 में कंपनी द्वारा बेची गयी कुल इकाइयों की संख्या है
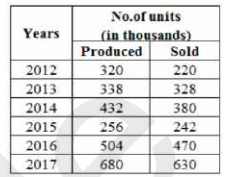
View SolutionThe table given below shows the number of units of a product produced and sold by a company in 6 years.
निम्न तालिका एक कंपनी द्वारा छह वर्षों के दौरान उत्पादित और बेचे गए उत्पाद की यूनिटों की संख्या दर्शाती है| The number of units sold in 2016 is approximately what percent more than the average number of
units produced from 2012 to 2016?
2016 में बेची गई उत्पाद के यूनिटों की संख्या, 2012 से लेकर 2016 तक उत्पादित औसत यूनिटों की संख्या से लगभग कितने प्रतिशत अधिक है ?
View SolutionThe following bar graph shows the amount of imports (in million kg) of a particular item imported by India during 2014-2018. The amount of import of the said item is how many years less than the time average of imports ? निम्नलिखित दंड आरेख में भारत द्वारा 2014-2018 के दौरान आयात की गई किसी विशेष मद के आयातों की मात्रा (मिलियन kg में) दर्शाया गयी है| दी गई अवधि के दौरान उक्त मद की आयात की गई मात्रा, आयातों की समय औसत से कितने वर्ष कम है ?
View SolutionThe given table represents the number of computers sold by four dealers A,B, C and D during the first six months of 2016. Study the table carefully and answer the questions that follows: दी गयी तालिका चार विक्रेताओं A, B, C और D के द्वारा 2016 के पहले छः महीनों में बेचे गए कंप्यूटरों की संख्या दर्शाती है | इस तालिका का ध्यानपूर्वक अध्ययन करें तथा पूछे गए प्रश्नों का उत्तर दें | What is the ratio of the total number of computers sold by dealer A in February, April and May to the total number of computers sold by dealer D in March, May and June? / विक्रेता A के द्वारा फरवरी, अप्रैल और मई में बेचे गए कंप्यूटरों की कुल संख्या तथा विक्रेता D के द्वारा मार्च, मई और जून में बेचे गए कंप्यूटरों की कुल संख्या के बीच क्या अनुपात है ?
View SolutionThe given table represents the number of computers sold by four dealers A,B, C and D during the first six months of 2016. Study the table carefully and answer the questions that follows: दी गयी तालिका चार विक्रेताओं A, B, C और D के द्वारा 2016 के पहले छः महीनों में बेचे गए कंप्यूटरों की संख्या दर्शाती है | इस तालिका का ध्यानपूर्वक अध्ययन करें तथा पूछे गए प्रश्नों का उत्तर दें | The total number of computers sold by dealer B in April, May and June is what percentage of the total number of computers sold by all the dealers in February and April? / विक्रेता B के द्वारा अप्रैल, मई और जून में बेचे गए कंप्यूटरों की कुल संख्या सभी विक्रेताओं के द्वारा फरवरी एवं अप्रैल में बेचे गए कंप्यूटरों की कुल संख्या का कितना प्रतिशत है ?
View SolutionThe given table represents the number of computers sold by four dealers A,B, C and D during the first six months of 2016. Study the table carefully and answer the questions that follows: दी गयी तालिका चार विक्रेताओं A, B, C और D के द्वारा 2016 के पहले छः महीनों में बेचे गए कंप्यूटरों की संख्या दर्शाती है | इस तालिका का ध्यानपूर्वक अध्ययन करें तथा पूछे गए प्रश्नों का उत्तर दें | The total number of computers sold by dealer A during February to June is what percentage more than the total number of computers sold by all the dealers in June?(Correct to one decimal place) / फरवरी से जून के दौरान विक्रेता A के द्वारा बेचे गए कंप्यूटरों की कुल संख्या सभी विक्रेताओं के द्वारा जून में बेचे गए कंप्यूटरों की कुल संख्या से कितना प्रतिशत अधिक है ?
View SolutionThe given table represents the sale (in thousands) of cars by four companies A,B,C and D in six years. Study the table and answer the questions that follow: | .................................................................................................................................................................................The total number of cars sold by company C in 2018 exceeds the average number of cars sold by company A during 2014 to 2018 by: कंपनी C के द्वारा 2018 में बेची गयी कारों की कुल संख्या 2014 से 2018 के दौरान कंपनी A के द्वारा बेची गयी कारों की औसत संख्या से कितनी अधिक है ?
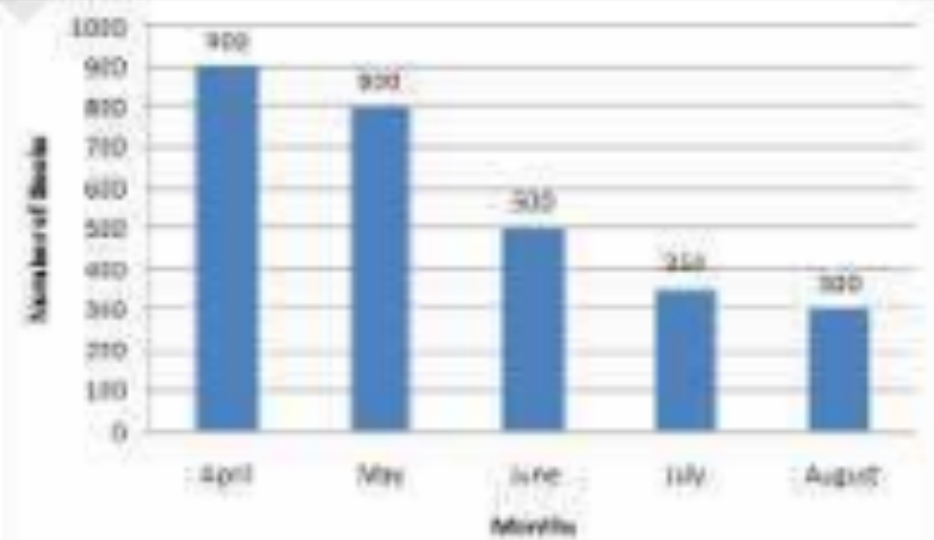
View SolutionThe following graph shows the number of books sold by a book-seller during five-months of 2019, April, May, June, July and August. Study the graph and answer the questions:
निम्नलिखित आरेख, 2019 के अप्रैल, मई, जून, जुलाई और अगस्त के पांच महीनों के दौरान एक पुस्तक-विक्रेता द्वारा बेची गई पुस्तकों की संख्या को दर्शाता है। आरेख का अध्ययन करें और प्रश्नों के उत्तर दें: The total number of books sold during these five month is:
इन पाँच महीनों के दौरान बेची गई पुस्तकों की कुल संख्या है:
View SolutionThe given Bar Graph presents the number of students of two schools for six years. दिया गया दंड आरेख (बार ग्राफ) छह वर्षो के दौरान दो स्कूलों में विद्यार्थियों की संख्या को दर्शाता है| What is the average of the number of students from school A during the six year period? छह वर्षों की अवधि के दौरान स्कूल A के विद्यार्थियों की औसत संख्या क्या है?
View SolutionThe given bar graph presents the sale of a particular brand of car by three showrooms, A, B and C( in multiples of 100) during the months of Jan, Feb, Mar and Apr, 2016
दिया गया दंड आरेख (बार ग्राफ) तीन शो-रूम- A, B और C के द्वारा जनवरी, फरवरी, मार्च और अप्रैल, 2016 के दौरान कार के एक खास ब्रांड की (100 के गुणक में) बिक्री को दर्शाता है| What is the ratio of the number of cars sold by A in Jan-Feb, 2016 to that of cars sold by B during Mar-Apr, 2016?
जनवरी-फरवरी, 2016 में A के द्वारा और मार्च-अप्रैल, 2016 के दौरान B के द्वारा बेची गई कारों की संख्या का अनुपात क्या है?
View Solution
