दिए गए पाई-चार्ट में वर्ष 2016 में एक कंपनी के पाँच उत्पादों (A,B,C ,D तथा E) के मात्रावार बिक्री वितरण को दर्शाया गया है।

यदि कंपनी द्वारा उत्पाद a की 320 यूनिटें बेचीं गई है तो कंपनी द्वारा एक साथ उत्पाद B और E की कितनी यूनिटें बेचीं गई ?
567
576
512
640
The correct Answer is:B
Step by step video, text & image solution for दिए गए पाई-चार्ट में वर्ष 2016 में एक कंपनी के पाँच उत्पादों (A,B,C ,D तथा E) के मात्रावार बिक्री वितरण को दर्शाया गया है। यदि कंपनी द्वारा उत्पाद a की 320 यूनिटें बेचीं गई है तो कंपनी द्वारा एक साथ उत्पाद B और E की कितनी यूनिटें बेचीं गई ? by Maths experts to help you in doubts & scoring excellent marks in Class 14 exams.
Updated on:21/07/2023Topper's Solved these Questions
Similar Questions
यदि A:B=2:3 और B:C=3:7, तो A+B:B+C:C+A क्या होगा?
View SolutionP और Q की वर्तमान आयु के बीच का क्रमशः अनुपात 3 : 4 है। चार वर्ष बाद Q, P से पाँच वर्ष बड़ा होगा।P की वर्तमान आयु कितनी है?
View SolutionMatch the following Column A to Column B

View SolutionStudy the following graph which shows the production (in thousand) of different items, and answer the questions. निम्नलिखित ग्राफ का अध्ययन कीजिए, जिन विभिन्न मदों का उत्पादन (हजार में) दर्शाया गया है तथा दिए गए प्रश्नों के उत्तर दीजिए। The total number of all products produced by the company in the year 2006 and 2008 together is:- कंपनी द्वारा वर्ष 2006 और 2008 में तेयार सभी उत्पादों को मिलाकर उनकी कुल संख्या कितनी है?
View SolutionThe following line diagram represents the yearly sales figure of a company in the years 2001-2010. Examine the diagram and answer the question. निम्नलिखित रेखा आरेख किसी कंपनी की वर्ष 2007-2010 के दौरान वार्षिक बिक्री के आंकड़ों को दर्शाता है। आरेख का अध्ययन करें और नीचे दिए गए प्रश्नों के उत्तर दें- The ratio of sales in 2002 to that in 2007 is वर्ष 2002 में बिक्री का वर्ष 2007 में बिक्री के साथ अनुपात है-
View SolutionThe given pie chart shows the quantity wise sales distribution of five products (A, B, C, D and E) of a company in 2016.
दिया गया पाई चार्ट 2016 में एक कंपनी के पाँच उत्पादों ( A, B, C, D और E ) की मात्रा वार बिक्री का वितरण दर्शाता है |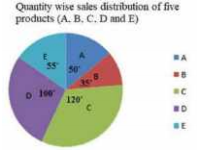 If 1500 units of product D were sold in 2016 and the total number of units sold by the company in
2017 was 18% more than that sold in 2016, then the total units sold by the company in 2017 is:
यदि 2016 में वस्तु D की 1500 इकाइयाँ बेचीं गयीं और 2017 में कंपनी द्वारा बेचीं गयी इकाइयों की कुल संख्या 2016 में बेचीं गयी इकाइयों की कुल संख्या से 18% अधिक थी, तो 2017 में कंपनी द्वारा बेची गयी कुल इकाइयों की संख्या है
View SolutionThe given pie chart shows the quantity wise sales distribution of five products (A, B, C, D and E) of a company in 2016.
दिया गया पाई चार्ट 2016 में एक कंपनी के पाँच उत्पादों ( A, B, C, D और E ) की मात्रा वार बिक्री का वितरण दर्शाता है |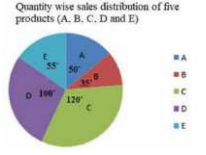 If 320 units of product A were sold by the company, then how many units of products B and E together were sold by the company?
यदि कंपनी के द्वारा वस्तु A की 320 इकाइयाँ बेची गयीं , तो कंपनी के द्वारा बेची गयी वस्तु B और E की कुल इकाइयों की संख्या ज्ञात करें |
View SolutionThe given Bar graph presents the Demand and Production of motorcycles of five companies (in lakhs) दिया गया दंड आरेख पांच कंपनियों के संबंध में मोटरसाइकिलों की मांग और उत्पादन ( लाख में ) को दर्शाता है| What is the ratio of the total Demand of motorcycles of companies A and D taken together to the Production of motorcycles of company C? कंपनी A और D को मिलाकर मोटरसाइकिलों की कुल मांग का कंपनी C की मोटरसाइकिलों के उत्पादन के साथ अनुपात ज्ञात करें |
View SolutionThe Bar graph given below presents the number of shoes manufactured by a company on the different days of a week.
नीचे दिया गया दंड आरेख एक कंपनी के द्वारा सप्ताह के अलग-अलग दिनों को बनाए गए जूतों की संख्या प्रस्तुत करता है |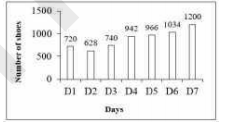 What is the total number of shoes manufactured by the company on all seven days together?
सभी सात दिनों को मिलाकर कंपनी के द्वारा बनाए गए जूतों की कुल संख्या कितनी है ?
View SolutionThe given bar graph shows the production and sale of mobile handsets of five different companies A, B, C, D, E, & F during the period of one month. दंड आरेख विभिन्न कंपनियों A, B, C, D, E & F की एक माह में मोबाइल हैंडसेट के उत्पादन और बिक्री को दर्शाता है | The units sold by the companies A, B and C, taken together, is approximately what percent of the total units produced by the companies A, B and C ? (to the nearest integer ) कंपनी A, B और C द्वारा कुल मिलाकर बिक्री की गई यूनिटें, कंपनी A, B और C द्वारा मिलाकर उत्पादित कुल यूनिटों का लगभग कितना प्रतिशत है (निकटतम पूर्णाक तक)?
View SolutionThe given bar graph shows the production and sale of mobile handsets of six different companies A, B, C, D, E, & F during the period of one month. With respect to production, the sale percentage of which company is highest ? दंड आरेख विभिन्न कंपनियों A, B, C, D, E & F की एक माह में मोबाइल हैंडसेट के उत्पादन और बिक्री को दर्शाता है | किस कंपनी की बिक्री का प्रतिशत, उसके उत्पादन के संदर्भ में, सबसे अधिक है ?
View SolutionThe table given below shows the number of units of a product produced and sold by a company in 6 years.
निम्न तालिका एक कंपनी द्वारा छह वर्षों के दौरान उत्पादित और बेचे गए उत्पाद की यूनिटों की संख्या दर्शाती है|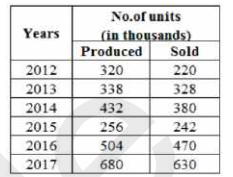 Find the ratio of the total number of units sold in 2013 and 2015 to the number of units produced in
2015 and 2016?
2013 और 2015 में बेची गई उत्पाद के यूनिटों की कुल संख्या तथा 2015 और 2016 में उत्पादित यूनिटों की संख्या का अनुपात ज्ञात कीजिए ?
View SolutionThe table given below shows the number of units of a product produced and sold by a company in 6 years.
निम्न तालिका एक कंपनी द्वारा छह वर्षों के दौरान उत्पादित और बेचे गए उत्पाद की यूनिटों की संख्या दर्शाती है|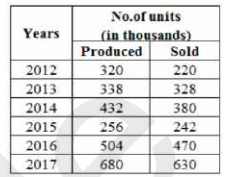 The number of units sold in 2016 is approximately what percent more than the average number of
units produced from 2012 to 2016?
2016 में बेची गई उत्पाद के यूनिटों की संख्या, 2012 से लेकर 2016 तक उत्पादित औसत यूनिटों की संख्या से लगभग कितने प्रतिशत अधिक है ?
View SolutionThe table given below shows the number of units of a product produced and sold by a company in 6 years.
निम्न तालिका एक कंपनी द्वारा छह वर्षों के दौरान उत्पादित और बेचे गए उत्पाद की यूनिटों की संख्या दर्शाती है|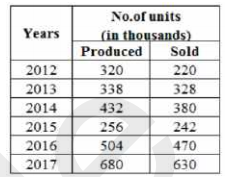 In which year, the production of product units is about 31.4% lower than units sold in 2017?
किस वर्ष में, उत्पाद की यूनिटों का उत्पादन 2017 में बेची गई यूनिटों की तुलना में लगभग 31.4% कम है ?
View SolutionThe given table represents the revenue (in ₹ crores) of a company from the sale of four products A,B,C and D in 6 years. Study the table carefully and answer the questions that follow. दी गयी तालिका एक कंपनी को चार उत्पादों -A, B, C तथा D की बिक्री से 6 वर्षों में होने वाली आय ( करोड़ रुपये में ) को दर्शाती है | इस तालिका का ध्यानपूर्वक अध्ययन करें तथा फिर पूछे गए प्रश्नों का उत्तर दें The number of years in which the revenue of the company from the sale of product D is more than the average revenue from the sale of product A over the six years is: ऐसे कितने वर्ष हैं जिनमें उत्पाद D की बिक्री से कंपनी को होने वाली आय इन छः वर्षों के दौरान उत्पाद A की बिक्री से हुई औसत आय से अधिक है ?
View SolutionThe given Bar Graph presents different types of vehicles (in lakhs) exported by a company in 2016 and 2017.What is the ratio of the total number of vehicles of type D and E exported by the company in 2016 to that of vehicles of type C and E exported in 2017? दिया गया दंड आरेख (बार ग्राफ) 2016 और 2017 में किसी कंपनी द्वारा निर्यात किए गए विभिन्न प्रकार के वाहनों (लाखों में) को दर्शाता है| 2016 में कंपनी द्वारा निर्यात किए जाने वाले D और E टाइप के वाहनों की कुल संख्या और 2017 में निर्यात किए गए C और E टाइप के वाहनों का अनुपात क्या है?
View Solution
