दिए गए पाई-चार्ट का अध्ययन करे जिसमे 2016 में एक कम्पनी के पांच उत्पादों (A,B,C,D और E) बिक्री वितरण को दर्शाया गया है और पूछे गए प्रश्नो के उत्तर दे।
पांच उत्पादों (A,B,C, D और E) की माहवार बिक्री वितरण
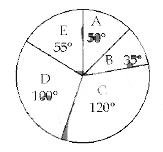
यदि 2016 में D उत्पादों के 1500 यूनिटें बेचीं गई और 2017 में कम्पनी द्वारा बेचीं गई युनिटो की कुल संख्या 2016 में बेचीं गई युनिटो की तुलना में 18% अधिक है, तो 2017 में कम्पनी द्वारा कितनी यूनिटें बेचीं गई ?
6336
6390
6372
6354
The correct Answer is:C
Step by step video, text & image solution for दिए गए पाई-चार्ट का अध्ययन करे जिसमे 2016 में एक कम्पनी के पांच उत्पादों (A,B,C,D और E) बिक्री वितरण को दर्शाया गया है और पूछे गए प्रश्नो के उत्तर दे। पांच उत्पादों (A,B,C, D और E) की माहवार बिक्री वितरण यदि 2016 में D उत्पादों के 1500 यूनिटें बेचीं गई और 2017 में कम्पनी द्वारा बेचीं गई युनिटो की कुल संख्या 2016 में बेचीं गई युनिटो की तुलना में 18% अधिक है, तो 2017 में कम्पनी द्वारा कितनी यूनिटें बेचीं गई ? by Maths experts to help you in doubts & scoring excellent marks in Class 14 exams.
Updated on:21/07/2023Topper's Solved these Questions
Similar Questions
यदि A:B=2:3 और B:C=3:7, तो A+B:B+C:C+A क्या होगा?
View SolutionP और Q की वर्तमान आयु के बीच का क्रमशः अनुपात 3 : 4 है। चार वर्ष बाद Q, P से पाँच वर्ष बड़ा होगा।P की वर्तमान आयु कितनी है?
View SolutionStudy the given graph and answer the question that follows:
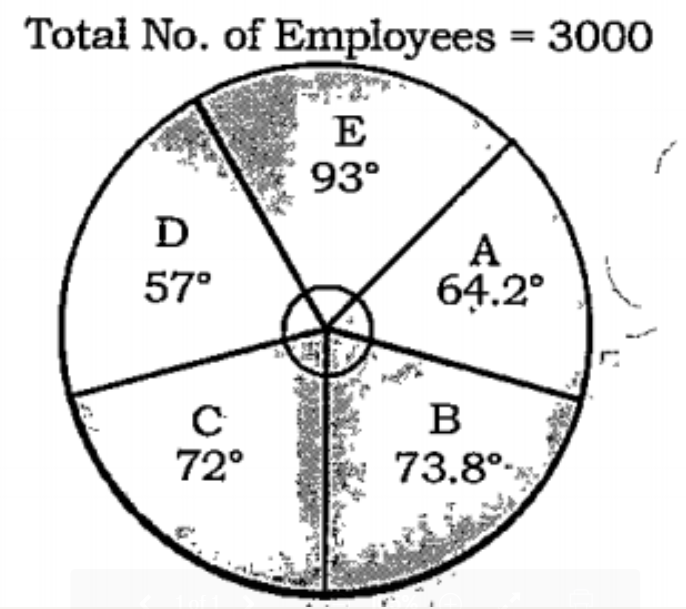 Break up for distribution (degree wise) of the employees working in five departments (A,B,C,D, and E) in a company. If 20% of the employees working in department E are transferred to department A, then the difference between eh number of employees in A and 124% of the employees working in department C is:
दिए गए ग्राफ का अध्ययन करें और नीचे दिए गए प्रश्न का उत्त्तर दें। कंपनी के पांच विभागों (A,B,C,D, और E) में काम कर रहे कर्मचारियों का वितरण
(डिग्री में) यदि विभाग E में कार्य करने वाले 20% कर्मचारियों को विभाग A में स्थानांतरित कर दिया जाता है, तो विभाग A में कर्मचारियों की संख्या और विभाग C में कार्यरत 124% कार्मचारियों के बीच अंतर ज्ञात कीजिए।
View SolutionStudy the given graph and answer the question that follows:
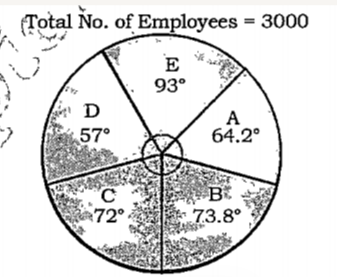
Breakup for distribution (degree wise) of the employees working in five departments (A,B,C,D, and E) in a company The number of employees in department B is what percent of the total number of employees working in department D and E?
दिए गए ग्राफ का अध्ययन करें और नीचे दिए गए प्रश्न का उत्त्तर दें। कंपनी के पांच विभागों (A, B, C, D और E) में काम कर रहे कर्मचारियों का वितरण
(डिग्री में) है। विभाग B में कर्मचारियों को संख्या, विभाग D और E में कार्य करने वाले कर्मचारियों की कुल संख्या की कितनी प्रतिशत है ?
View SolutionThe given pie-chart shows the break-up of total marks obtained by a student in five subject A, B,C, D and E. The maximm marks in each subject is 150 and he obtained a total of 600 marks. निम्नलिखित वृत्त आरेख (पाई चार्ट) में एक विद्यार्थी द्वारा पांच विषयों (A, B,C, D और E) में प्राप्त कुल अंकों का विभाजन (ब्रेकअप) दर्शाया गया है। प्रत्येक विषय में अधिकतम अंक 150 हैं और उसने कुल 600 अंक प्राप्त किए हैं। The total marks obtained by the student in subject C and E is approximately how much percent more than what he obtained in A and D together? C और E विषयों में विद्यार्थी के द्वारा प्राप्त कुल अंक, उसके द्वारा A और D में प्राप्त कुल अंको से कितने प्रतिशत अधिक है?
View SolutionThe given pie chart shows the quantity wise sales distribution of five products (A, B, C, D and E) of a company in 2016.
दिया गया पाई चार्ट 2016 में एक कंपनी के पाँच उत्पादों ( A, B, C, D और E ) की मात्रा वार बिक्री का वितरण दर्शाता है |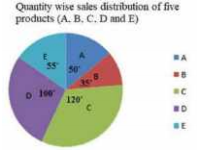 If 1500 units of product D were sold in 2016 and the total number of units sold by the company in
2017 was 18% more than that sold in 2016, then the total units sold by the company in 2017 is:
यदि 2016 में वस्तु D की 1500 इकाइयाँ बेचीं गयीं और 2017 में कंपनी द्वारा बेचीं गयी इकाइयों की कुल संख्या 2016 में बेचीं गयी इकाइयों की कुल संख्या से 18% अधिक थी, तो 2017 में कंपनी द्वारा बेची गयी कुल इकाइयों की संख्या है
View SolutionThe given pie chart shows the quantity wise sales distribution of five products (A, B, C, D and E) of a company in 2016.
दिया गया पाई चार्ट 2016 में एक कंपनी के पाँच उत्पादों ( A, B, C, D और E ) की मात्रा वार बिक्री का वितरण दर्शाता है |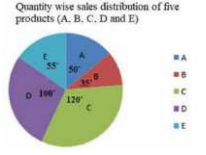 If 320 units of product A were sold by the company, then how many units of products B and E together were sold by the company?
यदि कंपनी के द्वारा वस्तु A की 320 इकाइयाँ बेची गयीं , तो कंपनी के द्वारा बेची गयी वस्तु B और E की कुल इकाइयों की संख्या ज्ञात करें |
View SolutionThe given pie-chart shows the break-up of total marks obtained by a student in five subjects A, B, C, D and E. The maximum marks in each subject is 150 and he obtained a total of 600 marks.
दिया गया पाई-चार्ट एक छात्र के द्वारा पांच विषयों A, B, C, D और E में प्राप्त किये गए कुल अंकों को विच्छेदित करके दर्शाता है | प्रत्येक विषय का अधिकतम अंक 150 है और उसे कुल 600 अंक मिले हैं |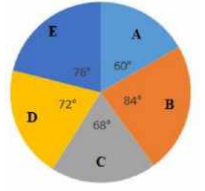 The total marks obtained by the student in subjects C and E is approximately how much percent more than what he obtained in A and D together?
इस छात्र द्वारा विषय C और E में प्राप्त किये गए अंक उसके द्वारा A और D में एक साथ प्राप्त किये गए अंक से लगभग कितने प्रतिशत अधिक हैं ?
View SolutionThe table shows the production of different types of cars (in thousands)
यह तालिका अलग-अलग प्रकार के कारों का उत्पादन ( हज़ार में ) दर्शाती है |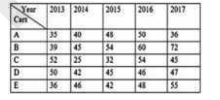 The ratio of the total production of cars of type C and E taken together in 2013 to the total production of cars of type D in 2014 and 2016 and type E in 2017 taken together is:
2013 में C और E प्रकार की कारों के कुल उत्पादन का 2014 और 2016 में D तथा 2017 में E प्रकार की कारों के कुल उत्पादन के साथ अनुपात ज्ञात करें |
View SolutionThe given Bar Graph presents the number of different types of vehicles exported by a company in 2017 and 2018.What is the ratio of the total number of vehicles exported in 2017 of types B, C and D to that of vehicles exported in 2018 of the types A, D and E?
दिया गया दंड आरेख एक कंपनी के द्वारा 2017 और 2018 में निर्यात किये गए अलग-अलग प्रकार के वाहनों की संख्या को दर्शाता है |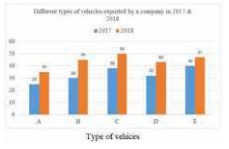
2017 में निर्यात किये गए B, C और D प्रकार के वाहनों की कुल संख्या का 2018 में निर्यात किये गए A, D और E प्रकार के वाहनों की संख्या के साथ अनुपात ज्ञात करें |
View SolutionThe given table represents the number of engineers recruited by four companies A,B,C and D over the years. Study the table carefully and answer the questions that follows: The ratio of the total number of engineers recruited by companies A and B in 2015 and 2018 to the total number of engineers recruited by C and D in 2014 and 2018 is: दी गयी तालिका चार कंपनियों A, B, C और D के द्वारा इन वर्षों के दौरान भर्ती किये गए इंजीनियरों की संख्या दर्शाती है | इस तालिका का ध्यानपूर्वक अध्ययन करें तथा इसके बाद पूछे गए प्रश्न का उत्तर दें | कंपनी A और B के द्वारा 2015 और 2018 में भर्ती किये गए इंजीनियरों की कुल संख्या एवं C तथा D के द्वारा 2014 और 2018 में भर्ती किये गए इंजीनियरों की कुल संख्या के बीच अनुपात ज्ञात करें |
View SolutionThe given table represents the number of engineers recruited by four companies A,B,C and D over the years. Study the table carefully and answer the questions that follows: The total number of engineers recruited by the company B in 2014 and 2017 is what percentage of the total number of engineers recruited by C during 2015 to 2019? दी गयी तालिका चार कंपनियों A, B, C और D के द्वारा इन वर्षों के दौरान भर्ती किये गए इंजीनियरों की संख्या दर्शाती है | इस तालिका का ध्यानपूर्वक अध्ययन करें तथा इसके बाद पूछे गए प्रश्न का उत्तर दें | कंपनी B के द्वारा 2014 और 2017 में भर्ती किये गए इंजीनियरों की कुल संख्या C के द्वारा 2015 से 2019 के दौरान भर्ती किये गए इंजीनियरों की कुल संख्या का कितना प्रतिशत है ?
View SolutionThe given table represents the number of computers sold by four dealers A,B, C and D during the first six months of 2016. Study the table carefully and answer the questions that follows: दी गयी तालिका चार विक्रेताओं A, B, C और D के द्वारा 2016 के पहले छः महीनों में बेचे गए कंप्यूटरों की संख्या दर्शाती है | इस तालिका का ध्यानपूर्वक अध्ययन करें तथा पूछे गए प्रश्नों का उत्तर दें | What is the ratio of the total number of computers sold by dealer A in February, April and May to the total number of computers sold by dealer D in March, May and June? / विक्रेता A के द्वारा फरवरी, अप्रैल और मई में बेचे गए कंप्यूटरों की कुल संख्या तथा विक्रेता D के द्वारा मार्च, मई और जून में बेचे गए कंप्यूटरों की कुल संख्या के बीच क्या अनुपात है ?
View SolutionThe given table represents the number of computers sold by four dealers A,B, C and D during the first six months of 2016. Study the table carefully and answer the questions that follows: दी गयी तालिका चार विक्रेताओं A, B, C और D के द्वारा 2016 के पहले छः महीनों में बेचे गए कंप्यूटरों की संख्या दर्शाती है | इस तालिका का ध्यानपूर्वक अध्ययन करें तथा पूछे गए प्रश्नों का उत्तर दें | The total number of computers sold by dealer B in April, May and June is what percentage of the total number of computers sold by all the dealers in February and April? / विक्रेता B के द्वारा अप्रैल, मई और जून में बेचे गए कंप्यूटरों की कुल संख्या सभी विक्रेताओं के द्वारा फरवरी एवं अप्रैल में बेचे गए कंप्यूटरों की कुल संख्या का कितना प्रतिशत है ?
View SolutionThe given table represents the number of computers sold by four dealers A,B, C and D during the first six months of 2016. Study the table carefully and answer the questions that follows: दी गयी तालिका चार विक्रेताओं A, B, C और D के द्वारा 2016 के पहले छः महीनों में बेचे गए कंप्यूटरों की संख्या दर्शाती है | इस तालिका का ध्यानपूर्वक अध्ययन करें तथा पूछे गए प्रश्नों का उत्तर दें | The total number of computers sold by dealer A during February to June is what percentage more than the total number of computers sold by all the dealers in June?(Correct to one decimal place) / फरवरी से जून के दौरान विक्रेता A के द्वारा बेचे गए कंप्यूटरों की कुल संख्या सभी विक्रेताओं के द्वारा जून में बेचे गए कंप्यूटरों की कुल संख्या से कितना प्रतिशत अधिक है ?
View SolutionThe given table represents the sale (in thousands) of cars by four companies A,B,C and D in six years. Study the table and answer the questions that follow: दी गयी तालिका चार कंपनियों - A, B, C और D के द्वारा छः वर्षों में की गयी कारों की बिक्री ( हज़ार में ) दर्शाती है | इस तालिका का अध्ययन करें तथा फिर पूछे गए प्रश्नों के उत्तर दें | What is the ratio of total number of cars sold by companies A,B and D in 2017 to the total number of cars sold by all companies in 2018? कंपनी A, B और D के द्वारा 2017 में बेची गयी कारों की कुल संख्या तथा 2018 में सभी कंपनियों के द्वारा बेची गयी कारों की कुल संख्या के बीच क्या अनुपात है ?
View Solution
