What is the approximate percentage of students passed during five academic years
0.72
0.78
0.79
0.73
The correct Answer is:D
To find the approximate percentage of students who passed during five academic years, we can follow these steps:
Step 1: Gather the Data
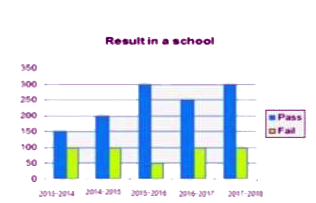
We need to collect the number of passed and failed students for each academic year from the provided data.
- 2013-14: Passed = 150, Failed = 100
- 2014-15: Passed = 200, Failed = 100
- 2015-16: Passed = 300, Failed = 50
- 2016-17: Passed = 250, Failed = 100
- 2017-18: Passed = 300, Failed = 100
Step 2: Calculate Total Passed and Failed Students
Now, we will calculate the total number of passed and failed students over the five years.
- Total Passed Students:
- 2013-14: 150
- 2014-15: 200
- 2015-16: 300
- 2016-17: 250
- 2017-18: 300
Total Passed = 150 + 200 + 300 + 250 + 300 = 1200
- Total Failed Students:
- 2013-14: 100
- 2014-15: 100
- 2015-16: 50
- 2016-17: 100
- 2017-18: 100
Total Failed = 100 + 100 + 50 + 100 + 100 = 450
Step 3: Calculate Total Students
Now, we will calculate the total number of students (passed + failed).
Total Students = Total Passed + Total Failed = 1200 + 450 = 1650
Step 4: Calculate the Pass Percentage
To find the pass percentage, we will use the formula:
Pass Percentage=(Total PassedTotal Students)×100
Substituting the values:
Pass Percentage=(12001650)×100
Step 5: Simplify the Calculation
Calculating the fraction:
12001650=1200÷1501650÷150=811
Now, calculating the percentage:
Pass Percentage=(811)×100≈72.73
Step 6: Round the Percentage
Rounding 72.73 to two decimal points gives us approximately 72.73%.
Step 7: Select the Closest Option
From the options provided (0.72, 0.78, 0.79, 0.73), the closest percentage is 0.73.
Final Answer
The approximate percentage of students passed during five academic years is 0.73.
---
We need to collect the number of passed and failed students for each academic year from the provided data.
- 2014-15: Passed = 200, Failed = 100
- 2015-16: Passed = 300, Failed = 50
- 2016-17: Passed = 250, Failed = 100
- 2017-18: Passed = 300, Failed = 100
Now, we will calculate the total number of passed and failed students over the five years.
- 2013-14: 150
- 2014-15: 200
- 2015-16: 300
- 2016-17: 250
- 2017-18: 300
Total Passed = 150 + 200 + 300 + 250 + 300 = 1200
- 2013-14: 100
- 2014-15: 100
- 2015-16: 50
- 2016-17: 100
- 2017-18: 100
Total Failed = 100 + 100 + 50 + 100 + 100 = 450
Now, we will calculate the total number of students (passed + failed).
To find the pass percentage, we will use the formula:
Calculating the fraction:
Rounding 72.73 to two decimal points gives us approximately 72.73%.
From the options provided (0.72, 0.78, 0.79, 0.73), the closest percentage is 0.73.
The approximate percentage of students passed during five academic years is 0.73.
Topper's Solved these Questions
Similar Questions
The given bar graph presents the results in terms of number of students in a school for the 5 academic years, 2013-2014 to 2017-2018.
दिया गया दंड आरेख ( बार ग्राफ) 5 शैक्षणिक वर्षो, 2013-2014 से 2017-2018, के दौरान किसी स्कूल के परीक्षाफल को विद्यार्थियों की संख्या के रूप में दर्शाता है|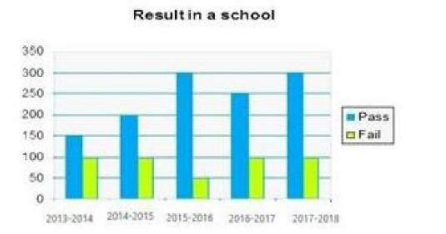
What is the approximate percentage of students passed during 5 academic years (to the nearest integer)?
5 शैक्षणिक वर्षो के दौरानउत्तरण विद्यार्थियों का अनुमानित प्रतिशत (निकटतम पूर्णाक में) कितना है?
View SolutionThe given bar graph presents the results in terms of the number of students in a school of the five academic years, 2013-2014 to 2017-2018.
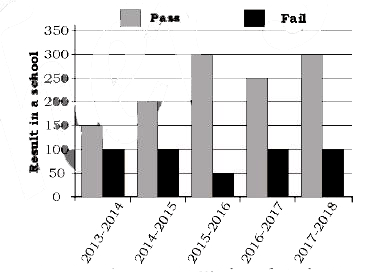
What is the average number of students who passed in the five academic years?
View Solution
Knowledge Check
What is the approximate percentage of students passed during five academic years
A0.28B0.27C0.21D0.22The given Bar Graph presents the results in terms of the number of students in a school for the five academic years, 2013-2014 to 2017-2018.
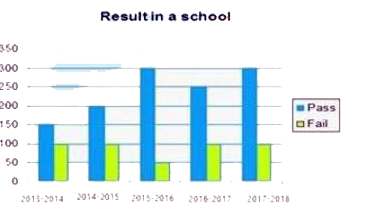
What is the average number of students who passed in the five academic years?Aa) 250Bb)225Cc)300Dd)240What is the average of failed students in five academic years?
A75B50C100D90

Approximately what is the overall percentage of students passed from institute C for all the years
View SolutionThe given Bar Graph presents the results in terms of the number of students in a school for the five academic years, 2013-2014 to 2017-2018.
दिया गया दंड आरेख पांच शैक्षणिक वर्षों : 2013-2014 से 2017-2018 तक एक विद्यालय में छात्रों की संख्या के संदर्भ में परिणामों को प्रस्तुत करता है |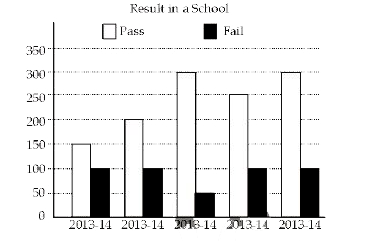 What is the approximate percentage (Correct to nearest integer) of the students who failed during the five academic years taken together?
पांच शैक्षणिक वर्षों को मिलाकर उन छात्रों का लगभग प्रतिशत ( निकटतम पूर्णाक में ) ज्ञात करें जो फेल हुए हैं ?
View SolutionThe given Bar Graph presents the results in terms of the number of students in a school for the five academic years, 2013-2014 to 2017-2018.
What is the approximate percentage (Correct to nearest integer ) of the students who failed during the five academic years taken together?
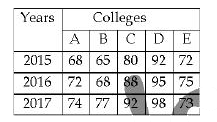
View SolutionThis table shows the percentage of students passing out of five different colleges over three years. It is given that from each college, 200 students appeared every year.
What is the approximate percentage increase in the number of students passing out of college B in the year 2017 as compared to the previous year?
View SolutionStudy the following table carefully and answer the questions given below :

Out of the total students of the institute D, approximately what percentage of students are studying Science ?
View Solution
