The given bar graph presents the results in terms of number of students in a school for the 5 academic years, 2013-2014 to 2017-2018.
दिया गया दंड आरेख ( बार ग्राफ) 5 शैक्षणिक वर्षो, 2013-2014 से 2017-2018, के दौरान किसी स्कूल के परीक्षाफल को विद्यार्थियों की संख्या के रूप में दर्शाता है|
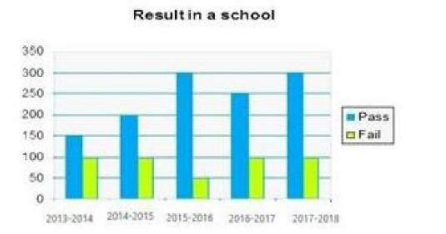
What is the approximate percentage of students passed during 5 academic years (to the nearest integer)?
5 शैक्षणिक वर्षो के दौरानउत्तरण विद्यार्थियों का अनुमानित प्रतिशत (निकटतम पूर्णाक में) कितना है?
0.72
0.78
0.79
0.73
Step by step video & image solution for The given bar graph presents the results in terms of number of students in a school for the 5 academic years, 2013-2014 to 2017-2018. दिया गया दंड आरेख ( बार ग्राफ) 5 शैक्षणिक वर्षो, 2013-2014 से 2017-2018, के दौरान किसी स्कूल के परीक्षाफल को विद्यार्थियों की संख्या के रूप में दर्शाता है| What is the approximate percentage of students passed during 5 academic years (to the nearest integer)? 5 शैक्षणिक वर्षो के दौरानउत्तरण विद्यार्थियों का अनुमानित प्रतिशत (निकटतम पूर्णाक में) कितना है? by Maths experts to help you in doubts & scoring excellent marks in Class 14 exams.
Similar Questions
The given bar graph presents the results in terms of number of students in a school for the 5 academic years, 2013-2014 to 2017-2018.
दिया गया दंड आरेख ( बार ग्राफ) 5 शैक्षणिक वर्षो, 2013-2014 से 2017-2018, के दौरान किसी स्कूल के परीक्षाफल को विद्यार्थियों की संख्या के रूप में दर्शाता है|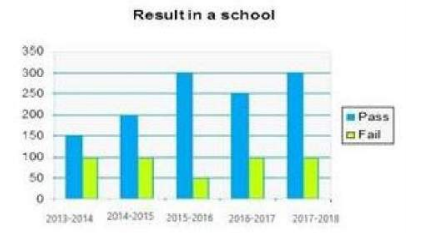
what is the average of failed students in five academic years?
5 शैक्षणिक वर्षों में अनुत्तीर्ण हुए विद्यार्थियों का औसत क्या है?View SolutionThe given Bar Graph presents the results in terms of the number of students in a school for the five academic years, 2013-2014 to 2017-2018.
दिया गया दंड आरेख (बार ग्राफ) पाँच शैक्षणिक वर्षों , 2013-2014 से 2017-2018 तक, के दौरान एक स्कूल के परीक्षाफल के संदर्भ में विधाथ्थियों की संख्या को दर्शाता है।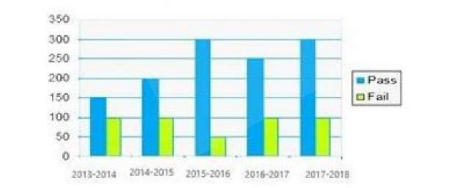
What is the average number of students who passed in the five academic years?
पाँच शैक्षणिक वर्षो में उत्तीर्ण होने वाले विद्यार्थियों की संख्या क्या है।View SolutionThe given bar graph presents the results in terms of number of students in a school for the 5 academic years, 2013-2014 to 2017-2018.
दिया गया दंड आरेख ( बार ग्राफ) 5 शैक्षणिक वर्षो, 2013-2014 से 2017-2018, के दौरान किसी स्कूल के परीक्षाफल को विद्यार्थियों की संख्या के रूप में दर्शाता है|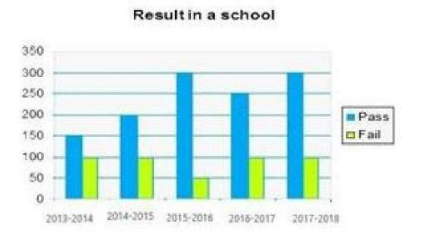
The difference between the number of students passed and those who failed is the highest in which academic year?
उत्तीर्ण छात्रों की संख्या और अनुन्तीर्ण होने वालों के बीच का अंतर किस शैक्षणिक वर्ष में सबसे अधिक है?View SolutionThe given Bar Graph presents the results in terms of number of students for the five academic years, 2013-2014 to 2017-2018.
दिया गया दंड आरेख पांच शैक्षणिक वर्षों : 2013-2014 से 2017-2018 तक छात्रों की संख्या के संदर्भ में परिणामों को प्रस्तुत करता है | What is the approximate percentage of students passed during five academic years (correct to the nearest integer)?
पांच शैक्षणिक वर्षों के दौरान पास करने वाले छात्रों का प्रतिशत ( लगभग ) कितना है ? ( निकटतम पूर्णाक में )View SolutionThe given Bar Graph presents the results in terms of the number of students in a school for the five academic years, 2013-2014 to 2017-2018.
दिया गया दंड आरेख (बार ग्राफ) पाँच शैक्षणिक वर्षों , 2013-2014 से 2017-2018 तक, के दौरान एक स्कूल के परीक्षाफल के संदर्भ में विधाथ्थियों की संख्या को दर्शाता है।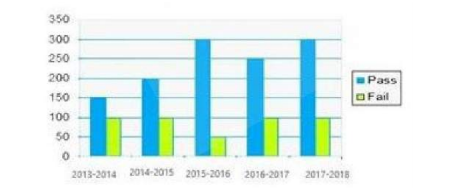
In which academic year the difference between the number of students passed and and that of those failed is the lowest?
किस शैक्षणिक वर्ष में उत्तीर्ण और अनुत्तीर्ण विद्यार्थियों की संख्या के बीच का अंतर सबसे कम है?View SolutionThe given Bar Graph presents the results in terms of the number of students in a school for the five academic years, 2013-2014 to 2017-2018.
दिया गया दंड आरेख पांच शैक्षणिक वर्षों : 2013-2014 से 2017-2018 तक एक विद्यालय में छात्रों की संख्या के संदर्भ में परिणामों को प्रस्तुत करता है |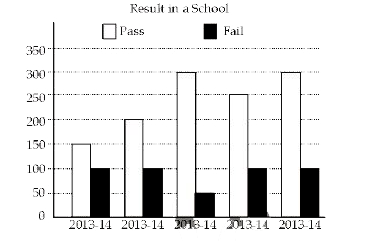 What is the approximate percentage (Correct to nearest integer) of the students who failed during the five academic years taken together?
पांच शैक्षणिक वर्षों को मिलाकर उन छात्रों का लगभग प्रतिशत ( निकटतम पूर्णाक में ) ज्ञात करें जो फेल हुए हैं ?View SolutionThe given Bar Graph presents the results in terms of the number of students in a school for the five academic years, 2013-2014 to 2017-2018.
दिया गया दंड आरेख पांच शैक्षणिक वर्षों : 2013-2014 से 2017-2018 तक एक विद्यालय में छात्रों की संख्या के संदर्भ में परिणामों को प्रस्तुत करता है | What is the average number of students who passed in the five academic years?
पांच शैक्षणिक वर्षों में पास करने वाले छात्रों की औसत संख्या कया है ?View SolutionThe given Bar Graph presents the results in terms of number of students for the five academic years, 2013-2014 to 2017-2018.
दिया गया दंड आरेख पांच शैक्षणिक वर्षों : 2013-2014 से 2017-2018 तक छात्रों की संख्या के संदर्भ में परिणामों को प्रस्तुत करता है |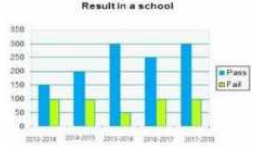 What is the average of failed students in five academic years?
पांच शैक्षणिक वर्षों में असफल छात्रों का औसत कया है ?View SolutionThe given Bar Graph presents the results in terms of the number of students in a school for the five academic years, 2013-2014 to 2017-2018.
दिया गया दंड आरेख पांच शैक्षणिक वर्षों : 2013-2014 से 2017-2018 तक एक विद्यालय में छात्रों की संख्या के संदर्भ में परिणामों को प्रस्तुत करता है |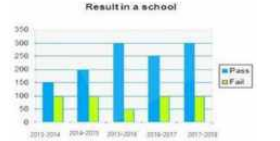 In which academic year the difference between the number of students passed and that of those
failed is the lowest?
किस शैक्षणिक वर्ष में, पास करने वाले छात्रों तथा फेल करने वाले छात्रों की संख्या में सबसे कम अंतर है ?View SolutionThe given Bar Graph presents the results in terms of number of students for the five academic years, 2013-2014 to 2017-2018.
दिया गया दंड आरेख पांच शैक्षणिक वर्षों : 2013-2014 से 2017-2018 तक छात्रों की संख्या के संदर्भ में परिणामों को प्रस्तुत करता है | The difference between the number of students passed and those who failed is the highest in
which academic year?
किस शैक्षणिक वर्ष में पास करने वाले तथा फेल करने वाले छात्रों की संख्या में सर्वाधिक अंतर है ?View Solution


