Two species of radioactive atoms are mixed in equal number. The disintegration of the first species is λ and of the second is λ/3. After a long time the mixture will behave as a species with mean life of approximately
0.70/λ
2.10/λ
1.00/λ
0.52/λ
The correct Answer is:B
To solve the problem step by step, we need to find the mean life of a mixture of two radioactive species with different disintegration constants.
1. Understanding the Problem:
We have two species of radioactive atoms mixed in equal numbers. The disintegration constant (decay constant) for the first species is denoted as λ, and for the second species, it is λ3.
2. Mean Life Calculation:
The mean life τ of a radioactive species is related to its decay constant λ by the formula:
τ=1λ
Therefore, the mean life for the first species is:
τ1=1λ
And for the second species:
τ2=1λ3=3λ
3. Finding the Average Mean Life:
Since both species are mixed in equal numbers, we can calculate the average mean life τavg of the mixture. The average mean life can be calculated using the formula:
τavg=τ1+τ22
Substituting the values we found:
τavg=1λ+3λ2=4λ2=2λ
4. Final Result:
Therefore, the mean life of the mixture will behave approximately as:
τavg≈2λ
Conclusion:
The mean life of the mixture of the two radioactive species is approximately 2λ.
We have two species of radioactive atoms mixed in equal numbers. The disintegration constant (decay constant) for the first species is denoted as λ, and for the second species, it is λ3.
The mean life τ of a radioactive species is related to its decay constant λ by the formula:
τ=1λ
Therefore, the mean life for the first species is:
τ1=1λ
And for the second species:
τ2=1λ3=3λ
Since both species are mixed in equal numbers, we can calculate the average mean life τavg of the mixture. The average mean life can be calculated using the formula:
τavg=τ1+τ22
Substituting the values we found:
τavg=1λ+3λ2=4λ2=2λ
Therefore, the mean life of the mixture will behave approximately as:
τavg≈2λ
The mean life of the mixture of the two radioactive species is approximately 2λ.
Topper's Solved these Questions
- QUESTION PAPER 2013Book:KVPY PREVIOUS YEARChapter:QUESTION PAPER 2013Exercise:PART-II ( PHYSICS)
Explore 10 Videos
- QUESTION PAPER 2013Book:KVPY PREVIOUS YEARChapter:QUESTION PAPER 2013Exercise:PART-II (PHYSICS)
Explore 5 Videos
- MOCK TEST 9Book:KVPY PREVIOUS YEARChapter:MOCK TEST 9Exercise:EXERCISE
Explore 19 Videos
- QUESTION PAPER 2020Book:KVPY PREVIOUS YEARChapter:QUESTION PAPER 2020Exercise:PART-I : PHYSICS
Explore 50 Videos
Similar Questions
The half-life of a radioactive substance is 40 days. A sample of it contains 1 mole nuclie. Calculate the number of disintegrations in the first second.
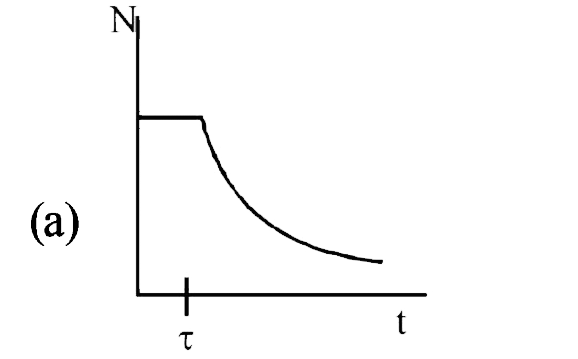
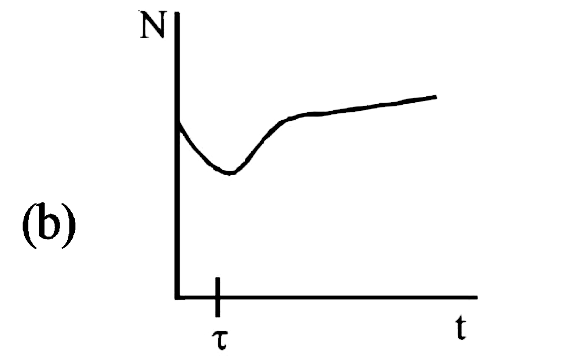
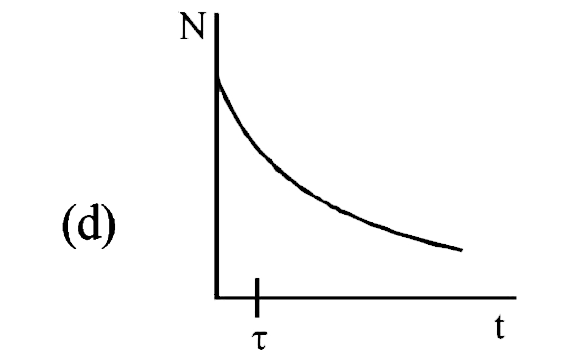
View SolutionA radioactive sample consists of two distinct species having equal number of atoms initially. The mean life of one species is τ and that of the other is 5τ. The decay products in both cases are stable. A plot is made of the total number of radioactive nuclei as a function of time. Which of the following figure best represents the form of this plot?
(a), (b), (c), (d)

View Solution
Knowledge Check
A radioactive element undergoes two different types of radioactive disintegration, one with disintegration constant λ1 and the other with λ2. The half-life of the element is
 A0.693λ1+λ2B0.693(λ1+λ2)/2C(0.693).λ1λ2λ1+λ2D0.693λ1λ22(λ1+λ2)
A radicactive sample consider of two distinct species having equial number initially . The mean life time of one species is τ and that of the other is 5τ . The decay prodects in both cases are stable . A plot is made of the total number of radioactive nuclei as a function of time , which of the following figure best represent the from of this plot?
A B
B CD
CD
A radioactive element disintegrates for a time interval equal to its mean life. The fraction that has disintegrated is
A1eB1−1eC0.693eD0.693(1−1e)
A radioactive substance decays for an interval of time equal to its mean life. Find the fraction of the amount of the substance which is left undecayed after this time interval.
View SolutionWhich species has an atom with an oxidation number of +3 ?
View SolutionWhen the quantity of a radioactive substance is increased two times, the number of atoms disintegrating per unit time is
View SolutionIn a radioactive disintegration, the ratio of initial number of atoms to the number of atoms present at an instant of time equal to its mean life is
View SolutionThe radioactivity of a substance is measured in terms of disintegration per second. Then 3×10⁸ dps (disintegration per second) is equal to
View Solution