Draw the graph of the function f:R−{−1,1}→R.f(x)=x1−|x|.Solution in Bengali
y=f(x)=x1−|x|={x1−x, x≥0, x≠1x1+x, x<0, x≠−1
y=x1−x=11−x−1
So (y+1)(x−1)=1, which is a rectangular hyperbola having centre at (1,-1).
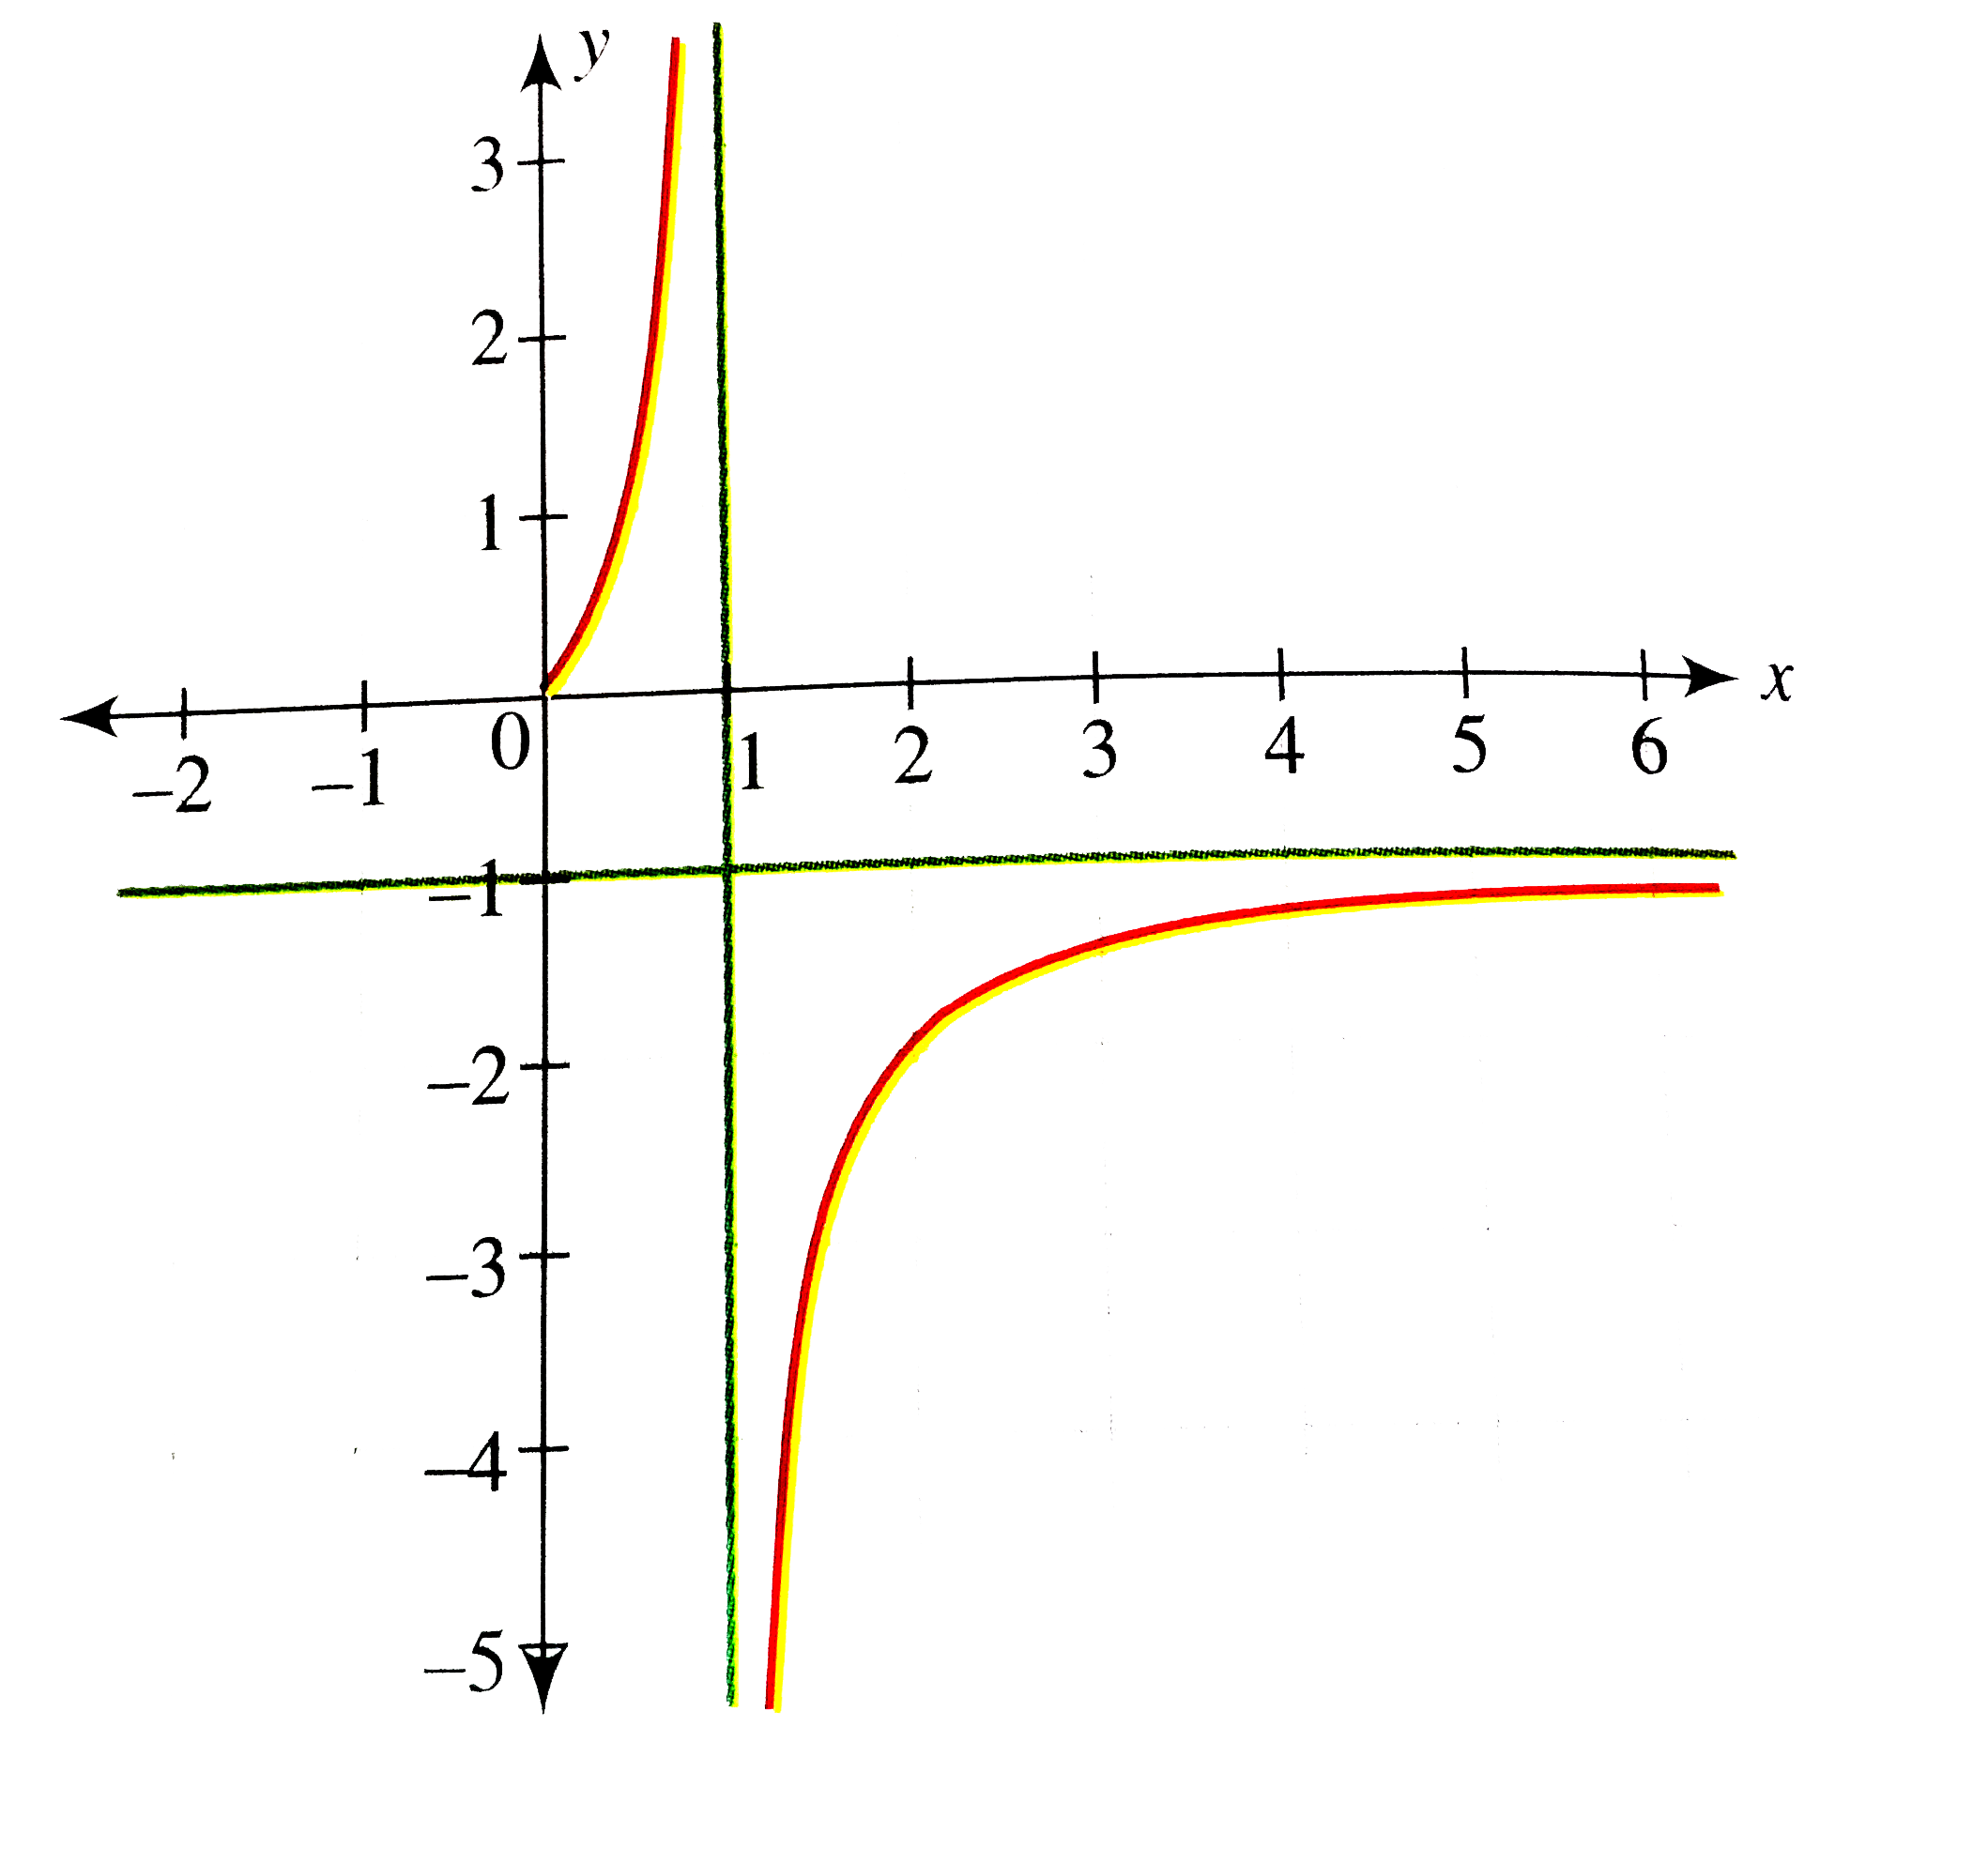
y=x1+x=1−11+x
So (y−1)(x+1)=1 , which is a rectangular having centre at (-1,1).
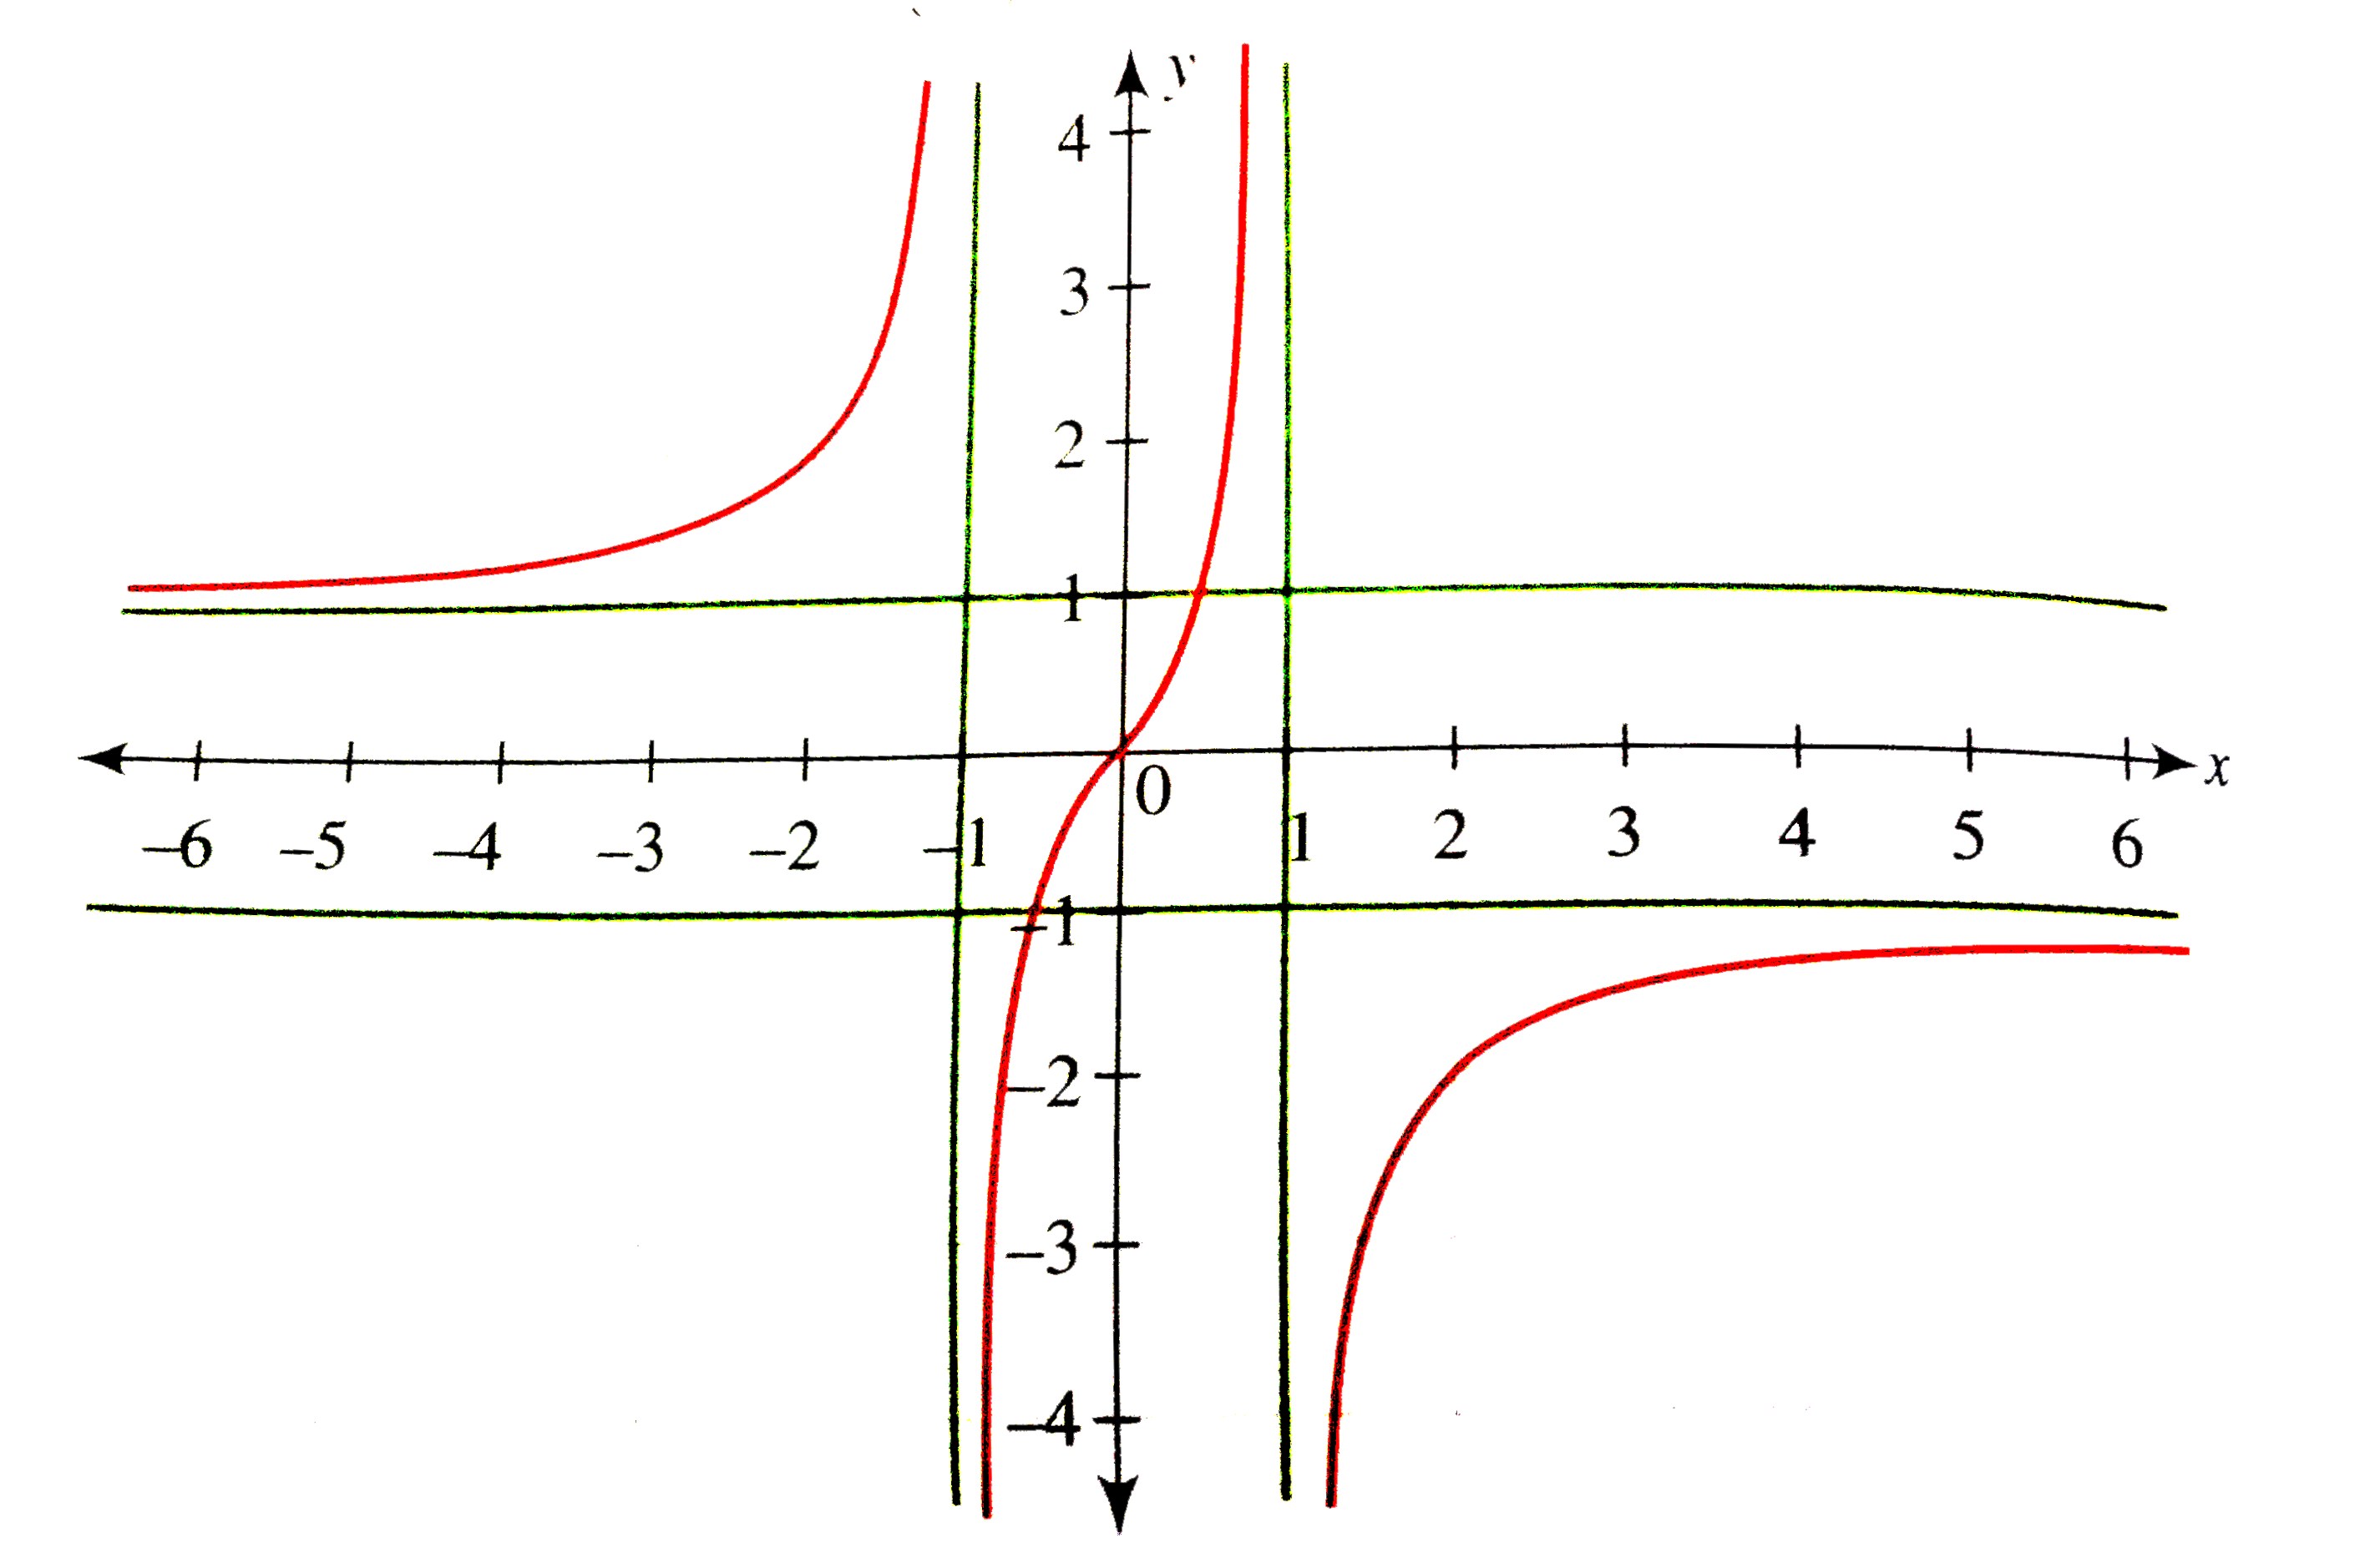
The graph is as shown in the following figure.
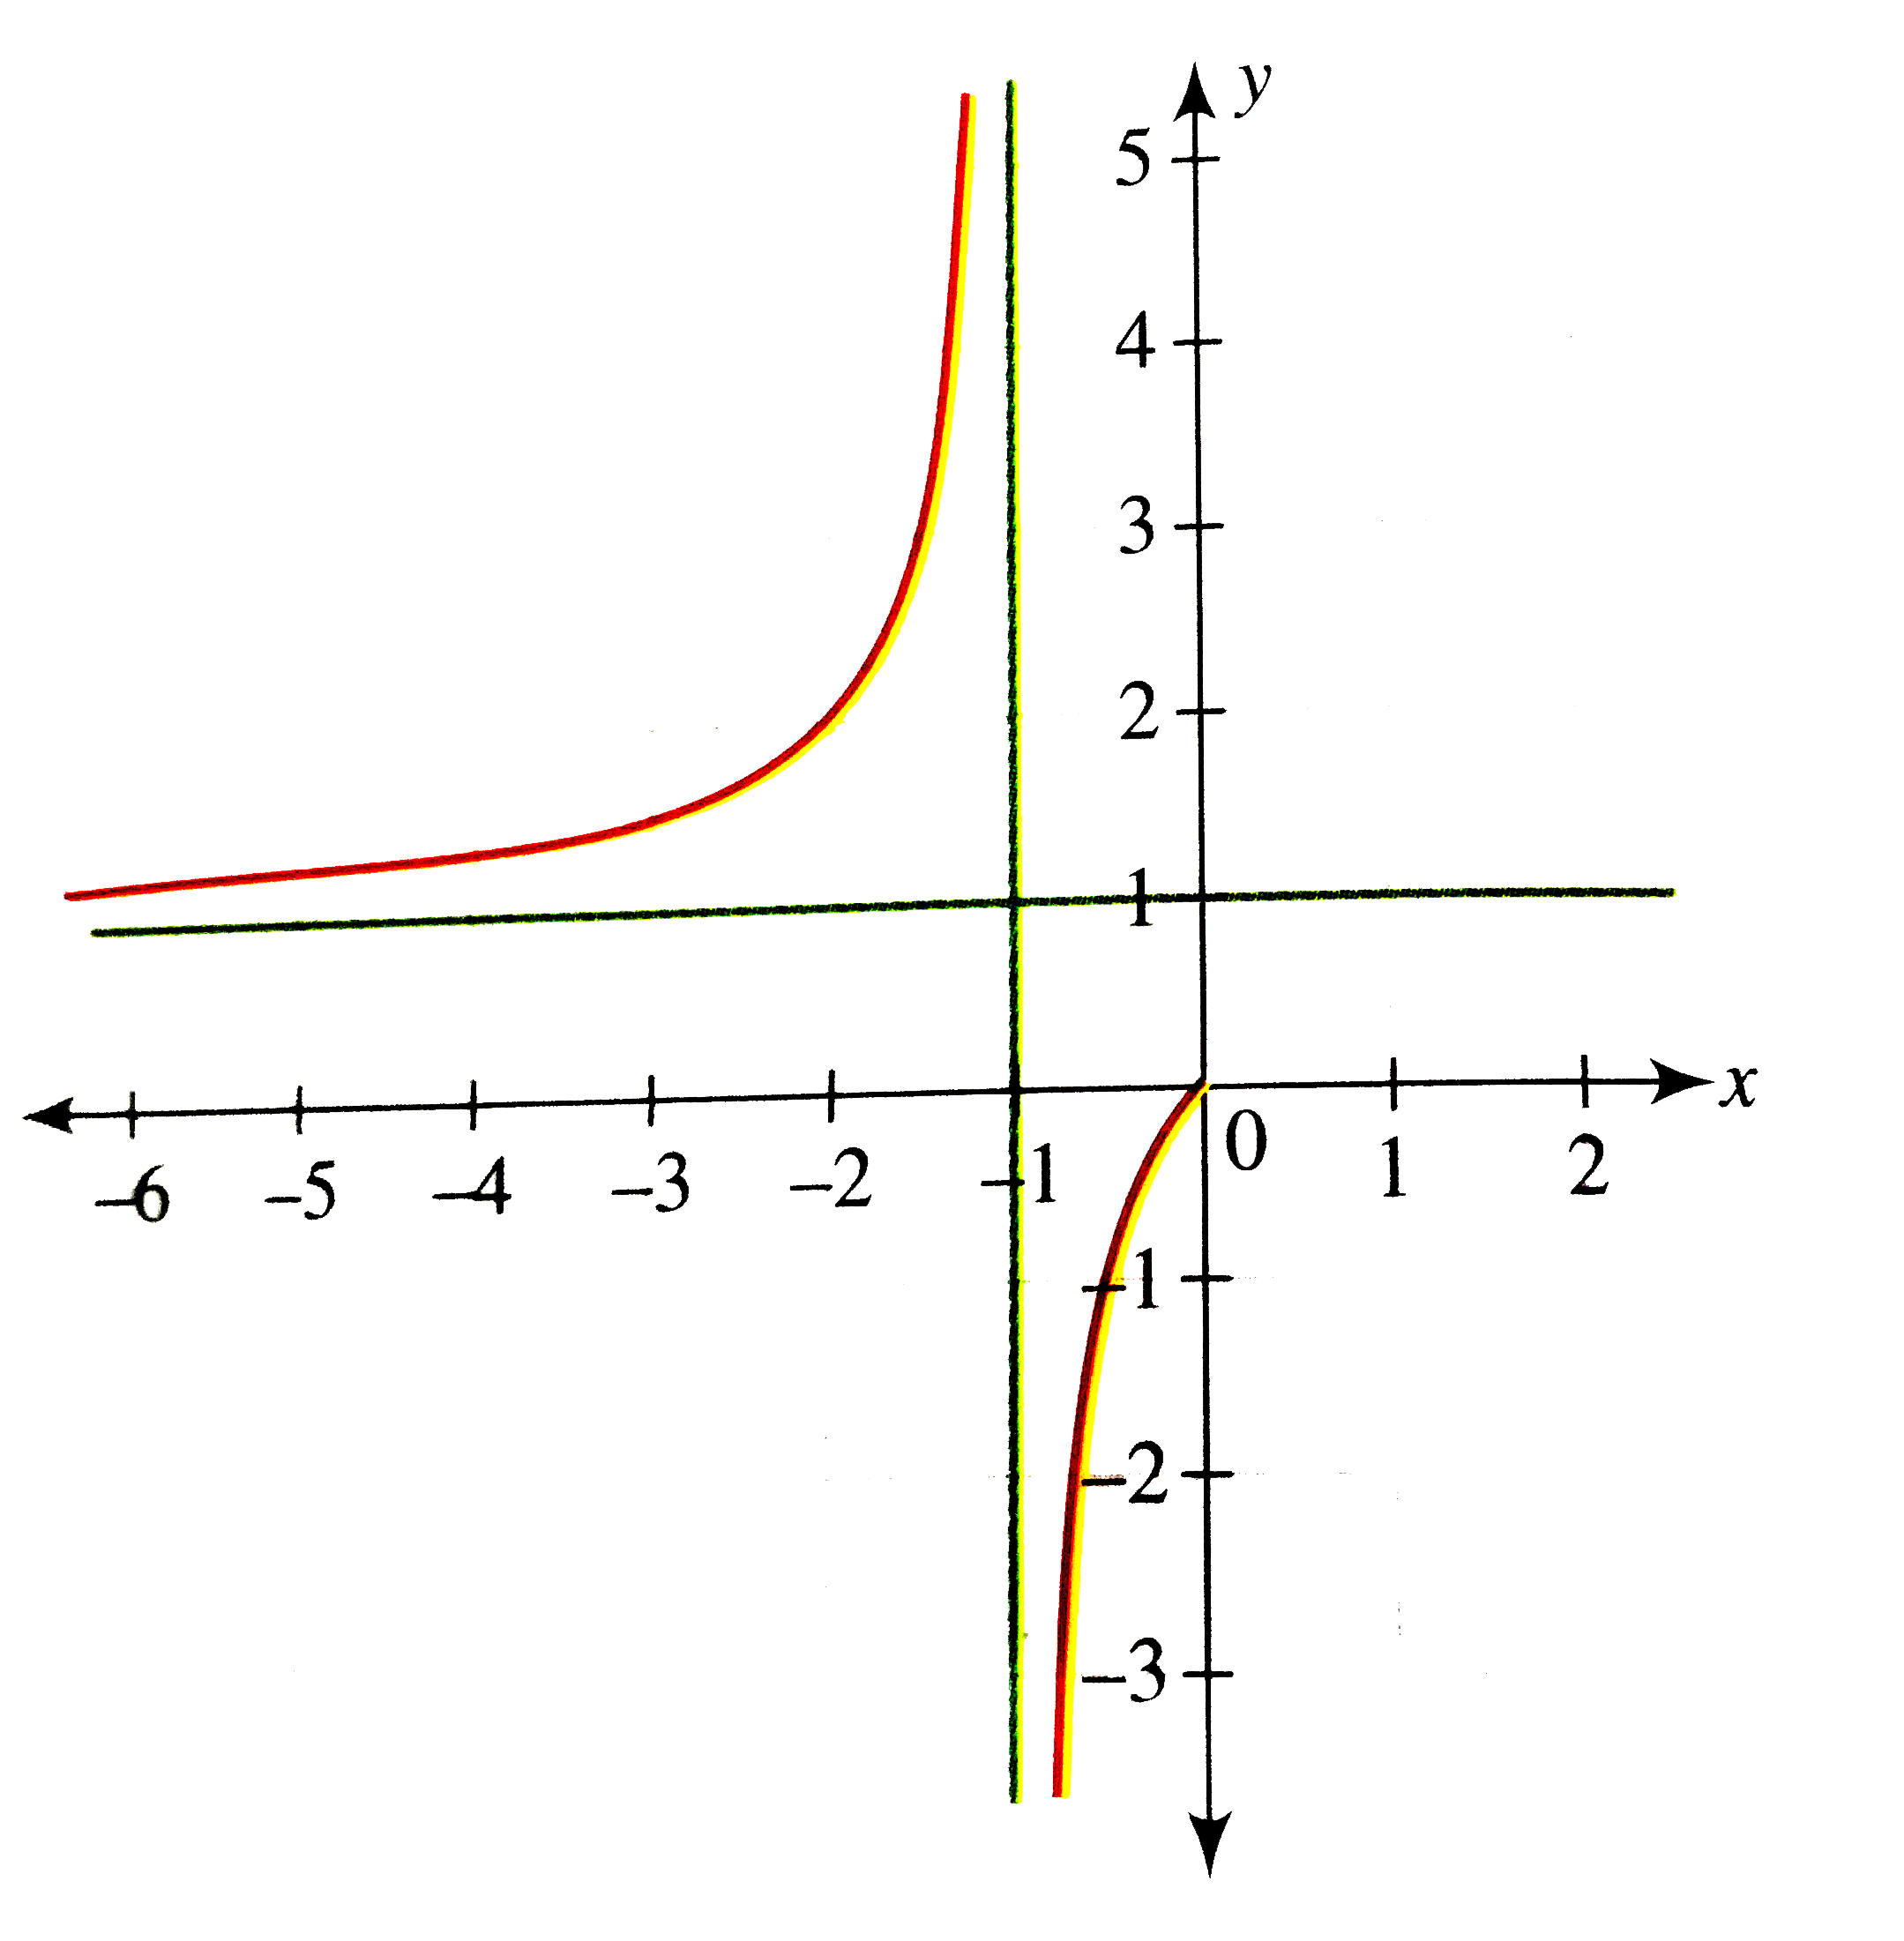
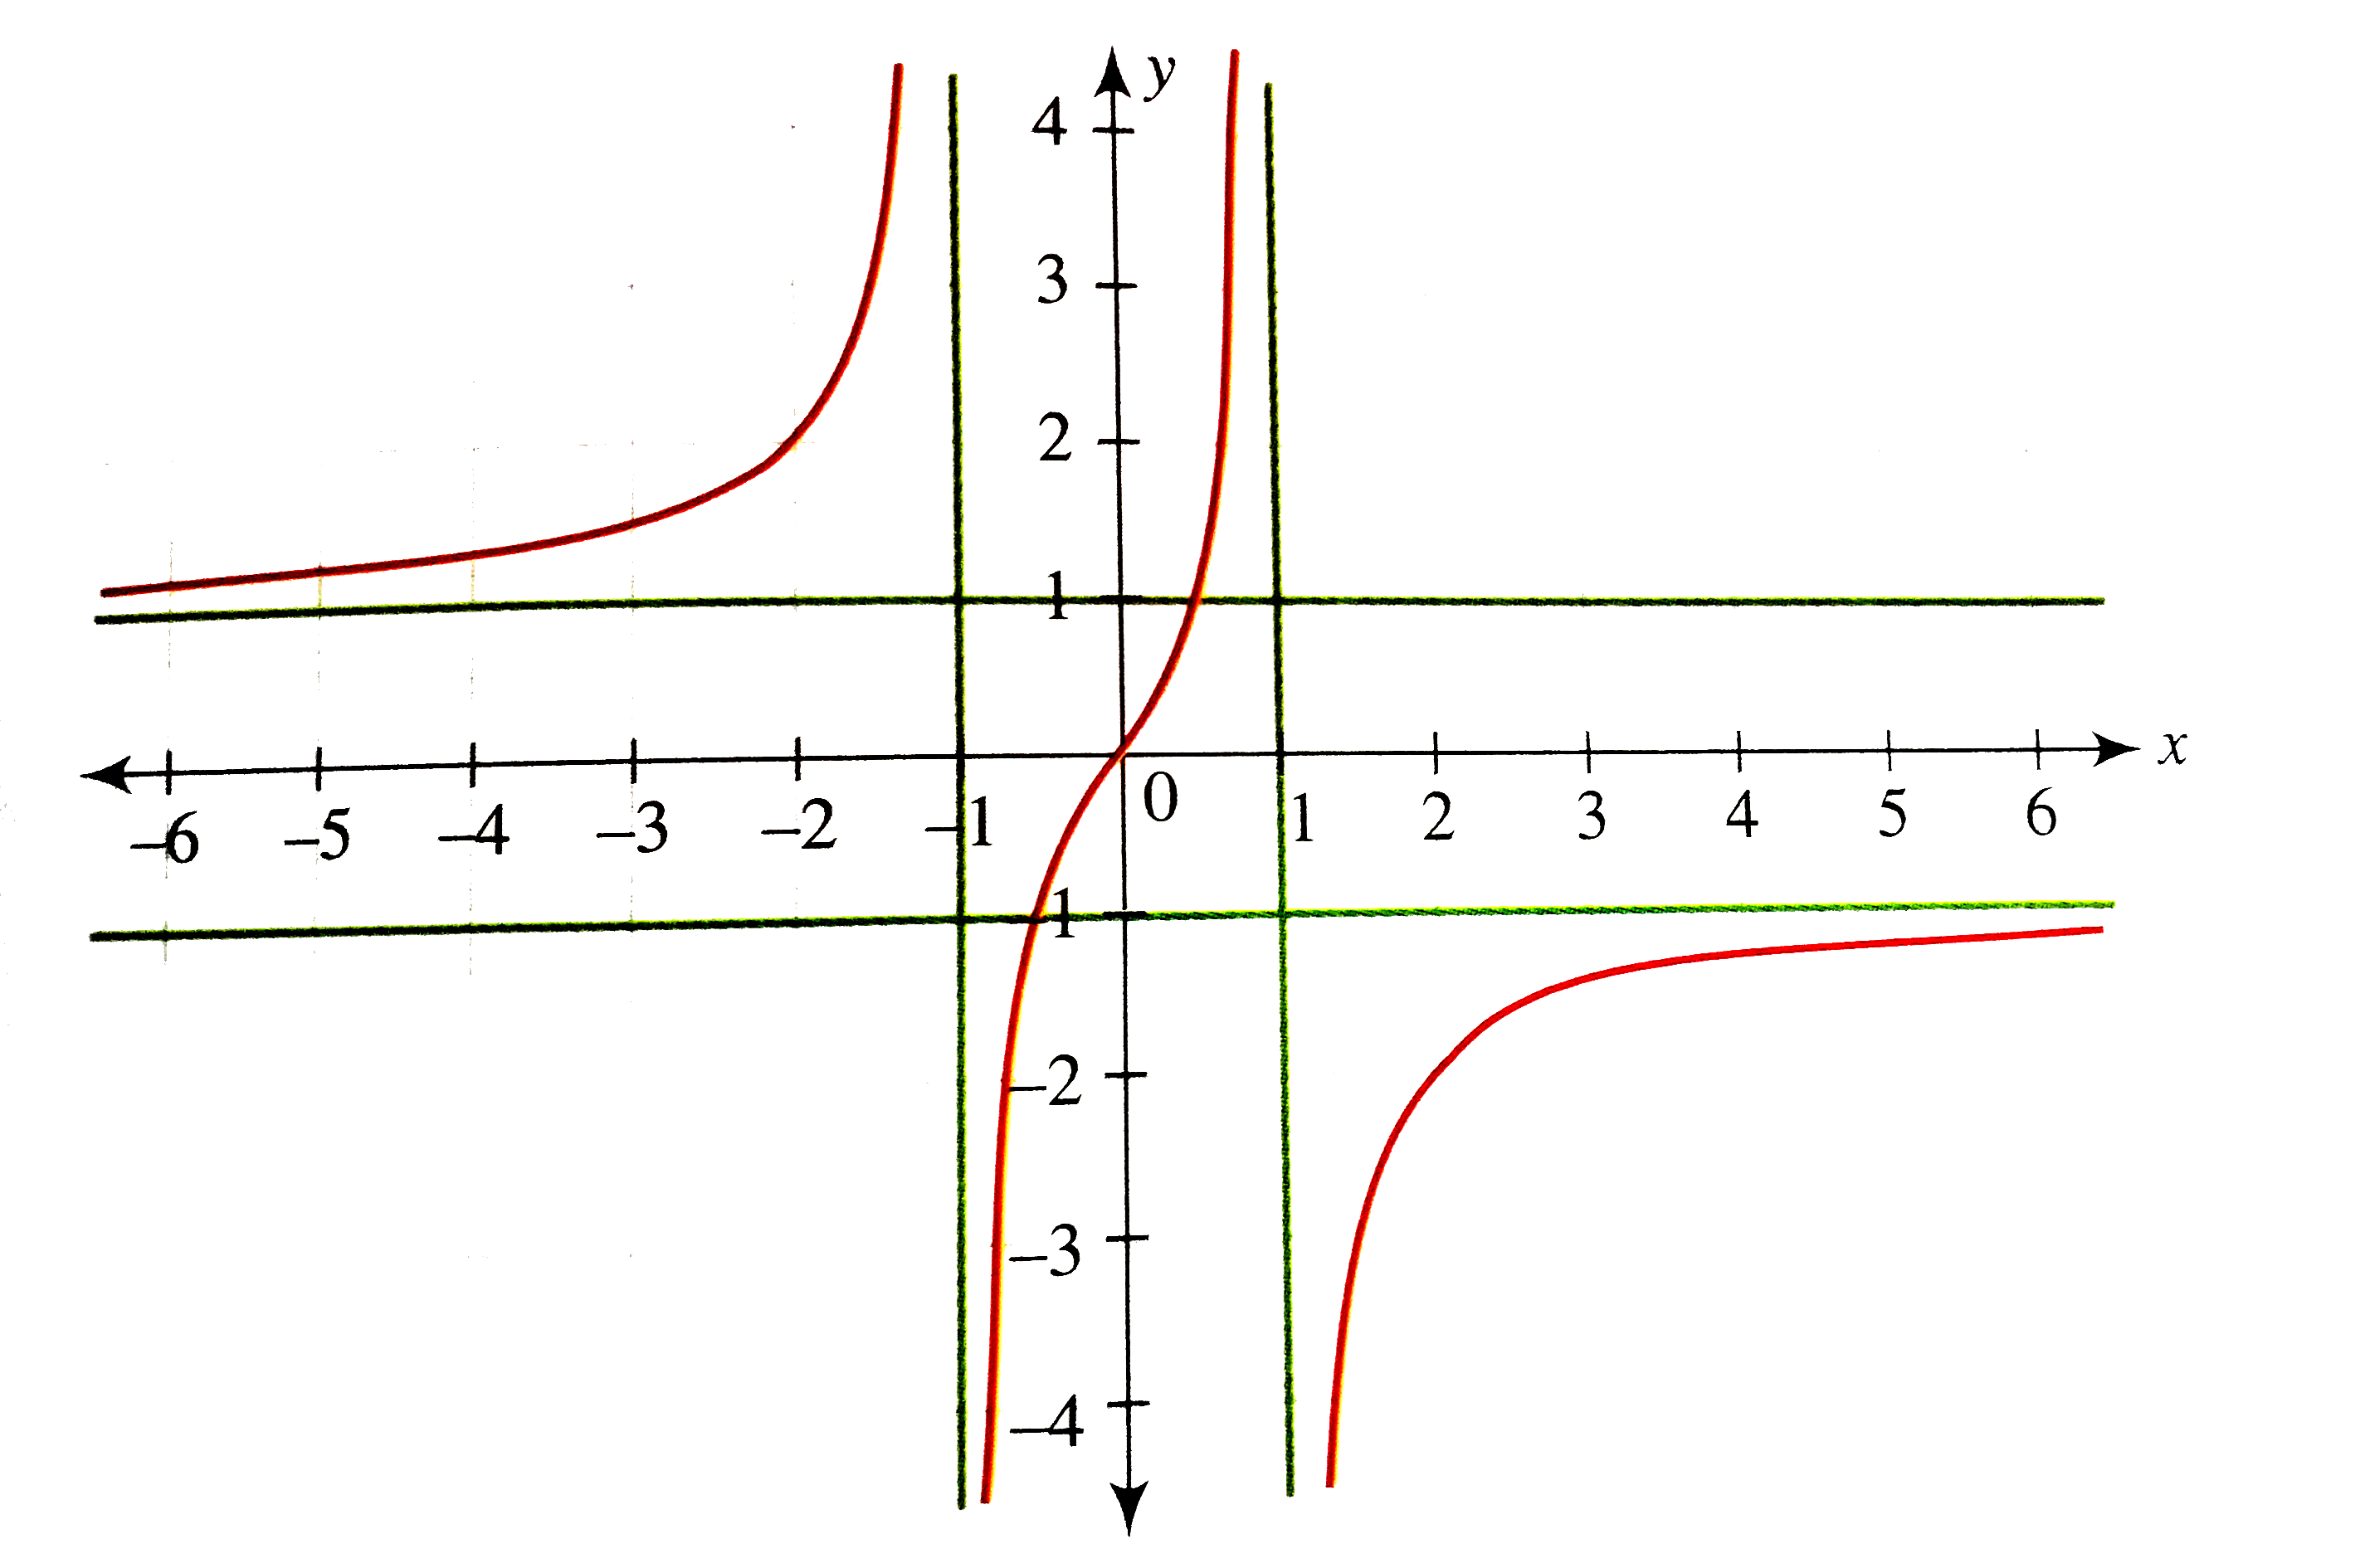
Combining two cases, we get the following graph.
Alternative method
y=f(x)=x1−|x|={x1−x, if x≥0, x≠1x1+x, if x<0, x≠−1
The function has vertical asymptotes as 1−|x|=0, or x=±1.
Also the function has horizontal asymptotes.
For x>0
y=limx→∞x1−x=limx→∞1x1x−1=−1
For x<0
y=limx→∞x1+x=limx→∞1x1x+1=1
Graph intersect axis at (0,0)
f'(x)=⎧⎪⎨⎪⎩1(1−x)2, x>0, x≠11(1+x)2, x<, x≠−1
∴ f'(x)>0,∀x∈R−{−1,1}
Hence f(x) is an increasing function.
From the above discussion, we have the following reference points and lines.
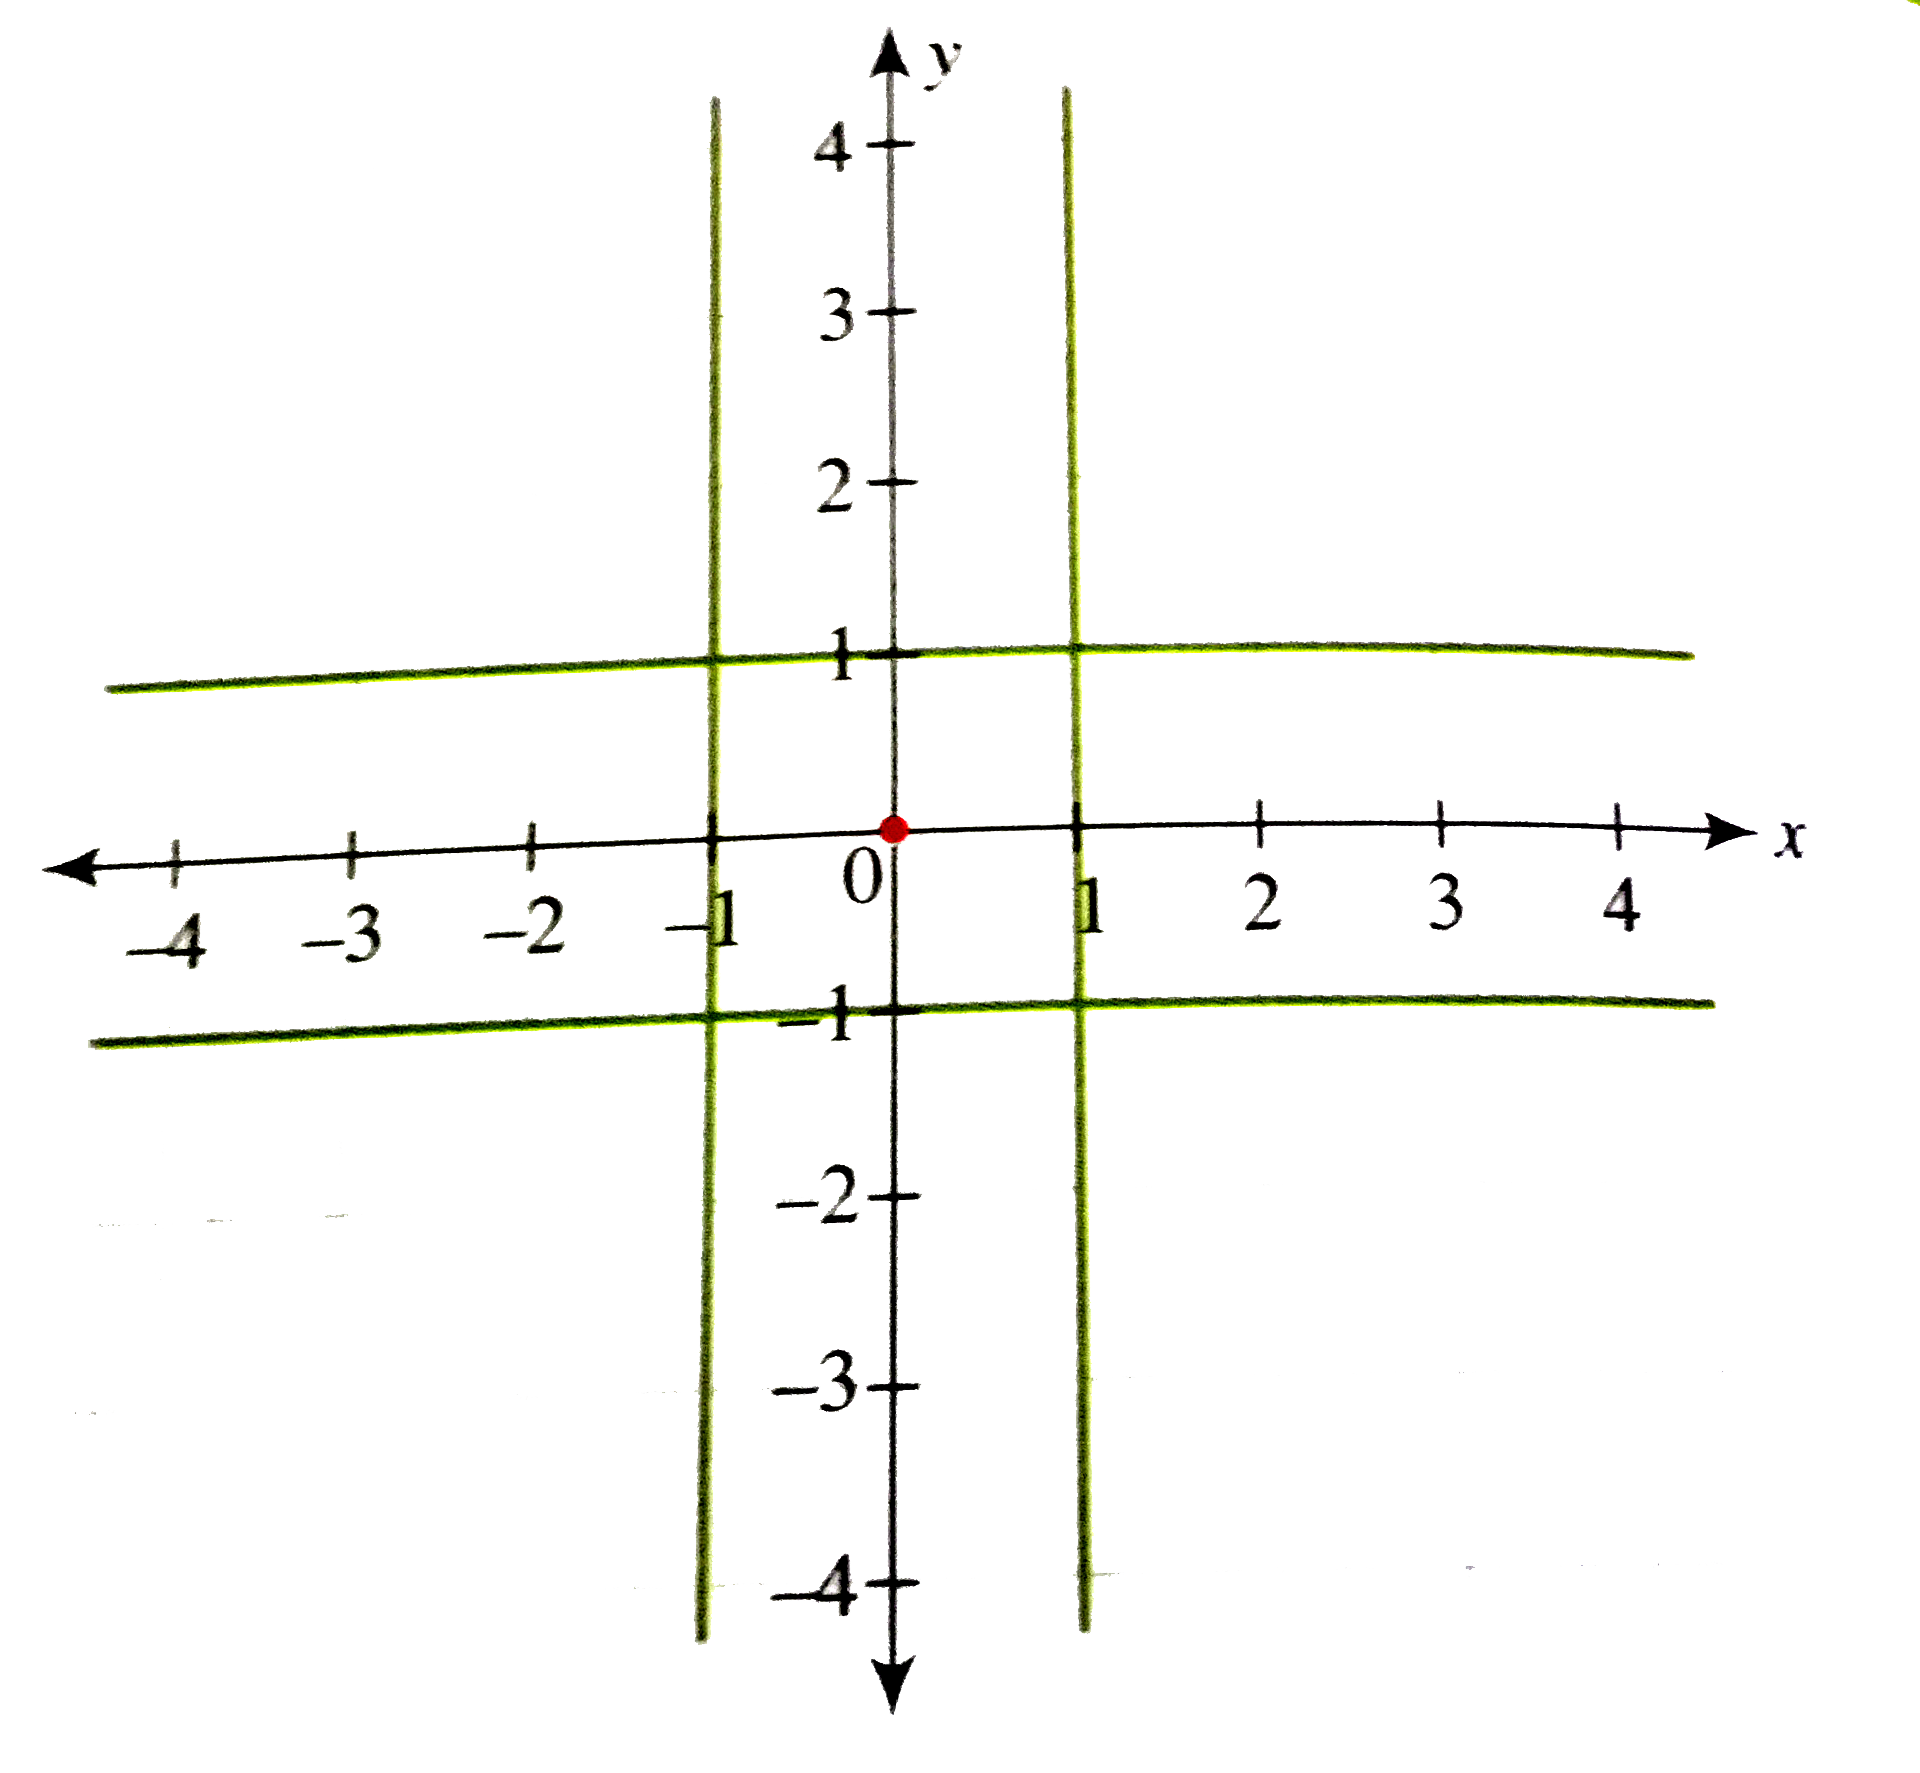
In the above figure, we have three regions, x∈(−∞,−1),(−1,1),(1,∞).
In each region, f(x) in increasing.
limx→−1−x1−|x|→∞
limx→−1+x1−|x|→−∞ andlimx→1−x1−|x|→∞,f(0)=0
limx→1+x1−|x|→−∞ and limx→∞x1−|x|→1
Hence the graph for x∈(−∞,−1)∪(−1,1)∪(1,∞)is as shown in the following figure.
Topper's Solved these Questions
- GRAPHS OF POLYNOMIAL AND RATIONAL FUNCTIONSBook:CENGAGE PUBLICATIONChapter:GRAPHS OF POLYNOMIAL AND RATIONAL FUNCTIONSExercise:Exercises
Explore 17 Videos
- GRAPHICAL TRANSFORMATIONSBook:CENGAGE PUBLICATIONChapter:GRAPHICAL TRANSFORMATIONSExercise:ILLUSTRATION
Explore 78 Videos
- GRAPHS OF ELEMENTARY FUNCTIONS Book:CENGAGE PUBLICATIONChapter:GRAPHS OF ELEMENTARY FUNCTIONS Exercise:EXERCISES
Explore 34 Videos
Similar Questions
Draw the graph of y=(x−1)(x2−x+1).
View SolutionPlot y=|x|,y+x−2∣,andy=|x|2∣
View SolutionDraw the graph of y=1(1/x).
View SolutionDraw the graph of the function: f(x)=−|x−1|12
View SolutionDraw the graph of the function f:R−{−1,1}→R.f(x)=x1−|x|.
View SolutionDraw the graph of the function f(x)=(1+1x)2
View SolutionDraw the graph of the functions f (x) = |x|, f(x) = |x-1| and f(x) = (x−1)2
View SolutionDraw the graph of the function, f(x)=1x.
View SolutionDraw the graph of the function: f:R→R defined by f(x)=x3,x∈R
View SolutionDraw the graph of the function: f(x)=−|x−1|12
View SolutionDraw the graph of the function f:R−{−1,1}→R.f(x)=x1−|x|.
View SolutionDraw the graph of the function f(x)=(1+1x)2
View SolutionDraw the graph of the function
f(x)=|x|+1,x∈R
View SolutionLet R be the set of all real numbers and let f:R→R be a function defined by f(x)=x+1 Draw the graph f
View SolutionDraw the graph of the function f(x)=|x−1|
View SolutionDraw the graph of the function f:R→R defined by f(x)=x3,x∈R.
View Solution