Draw the graph of the function .
Video Solution
Text Solution
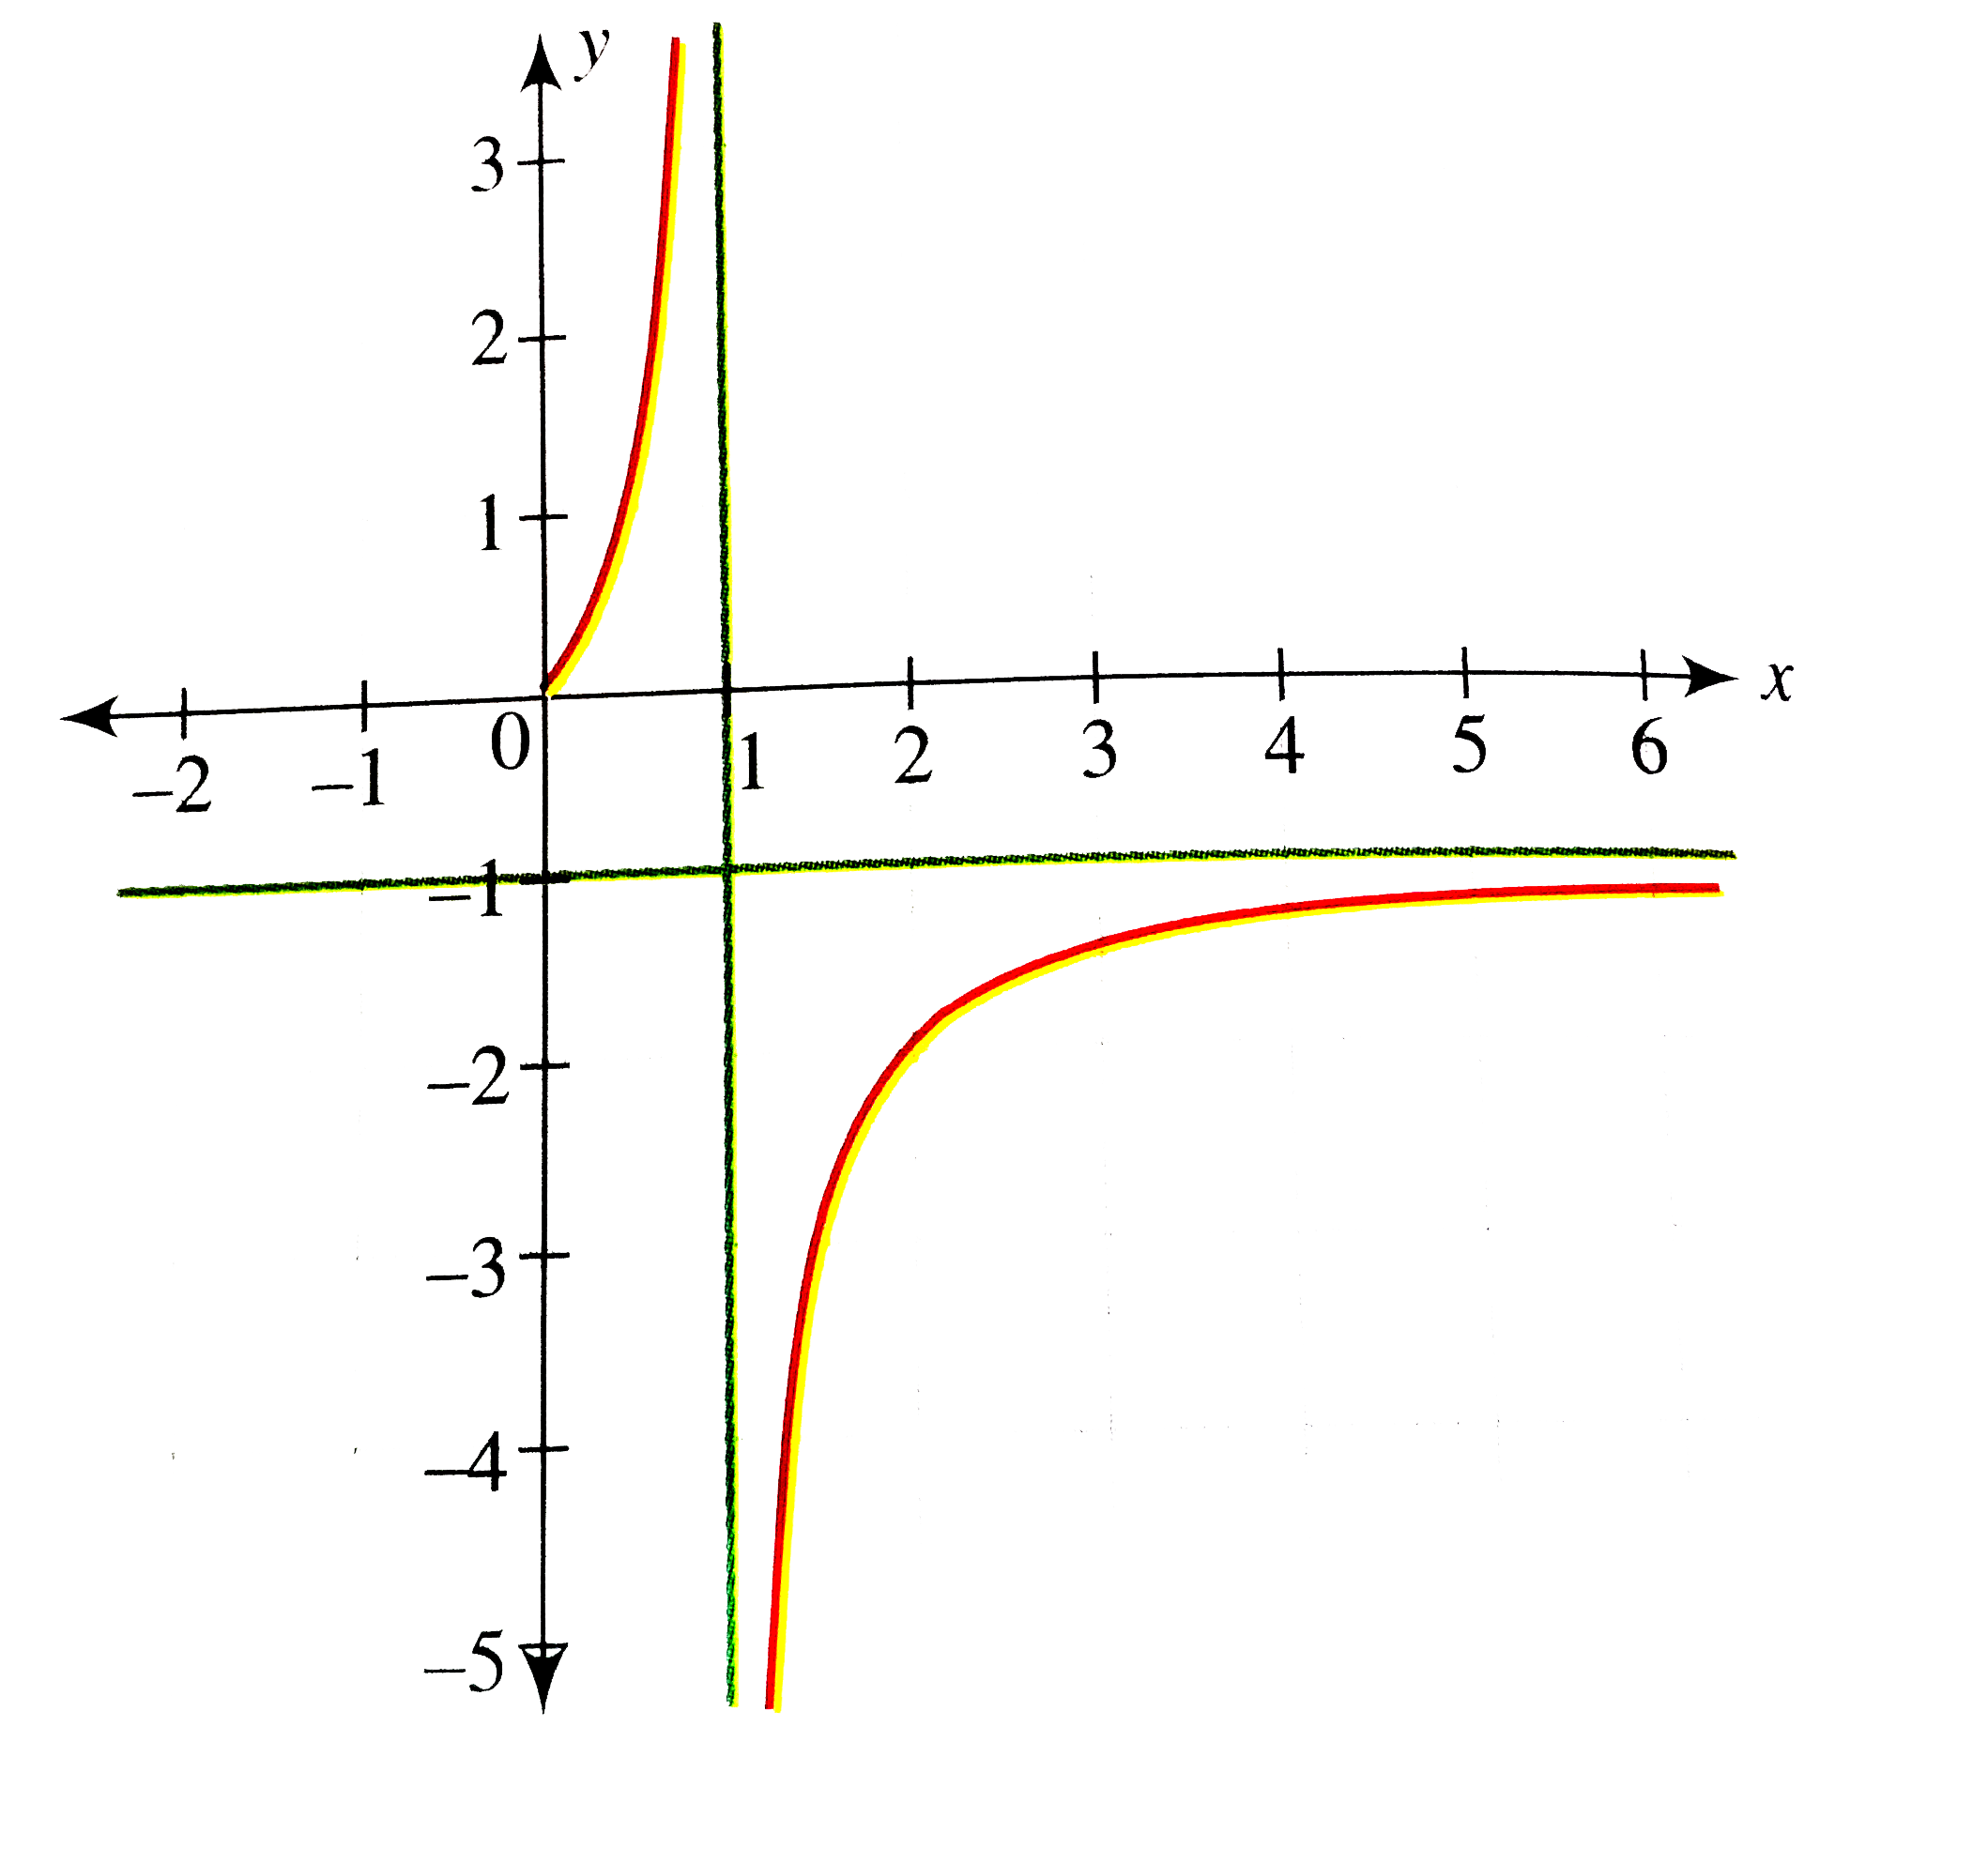
So , which is a rectangular hyperbola having centre at (1,-1).
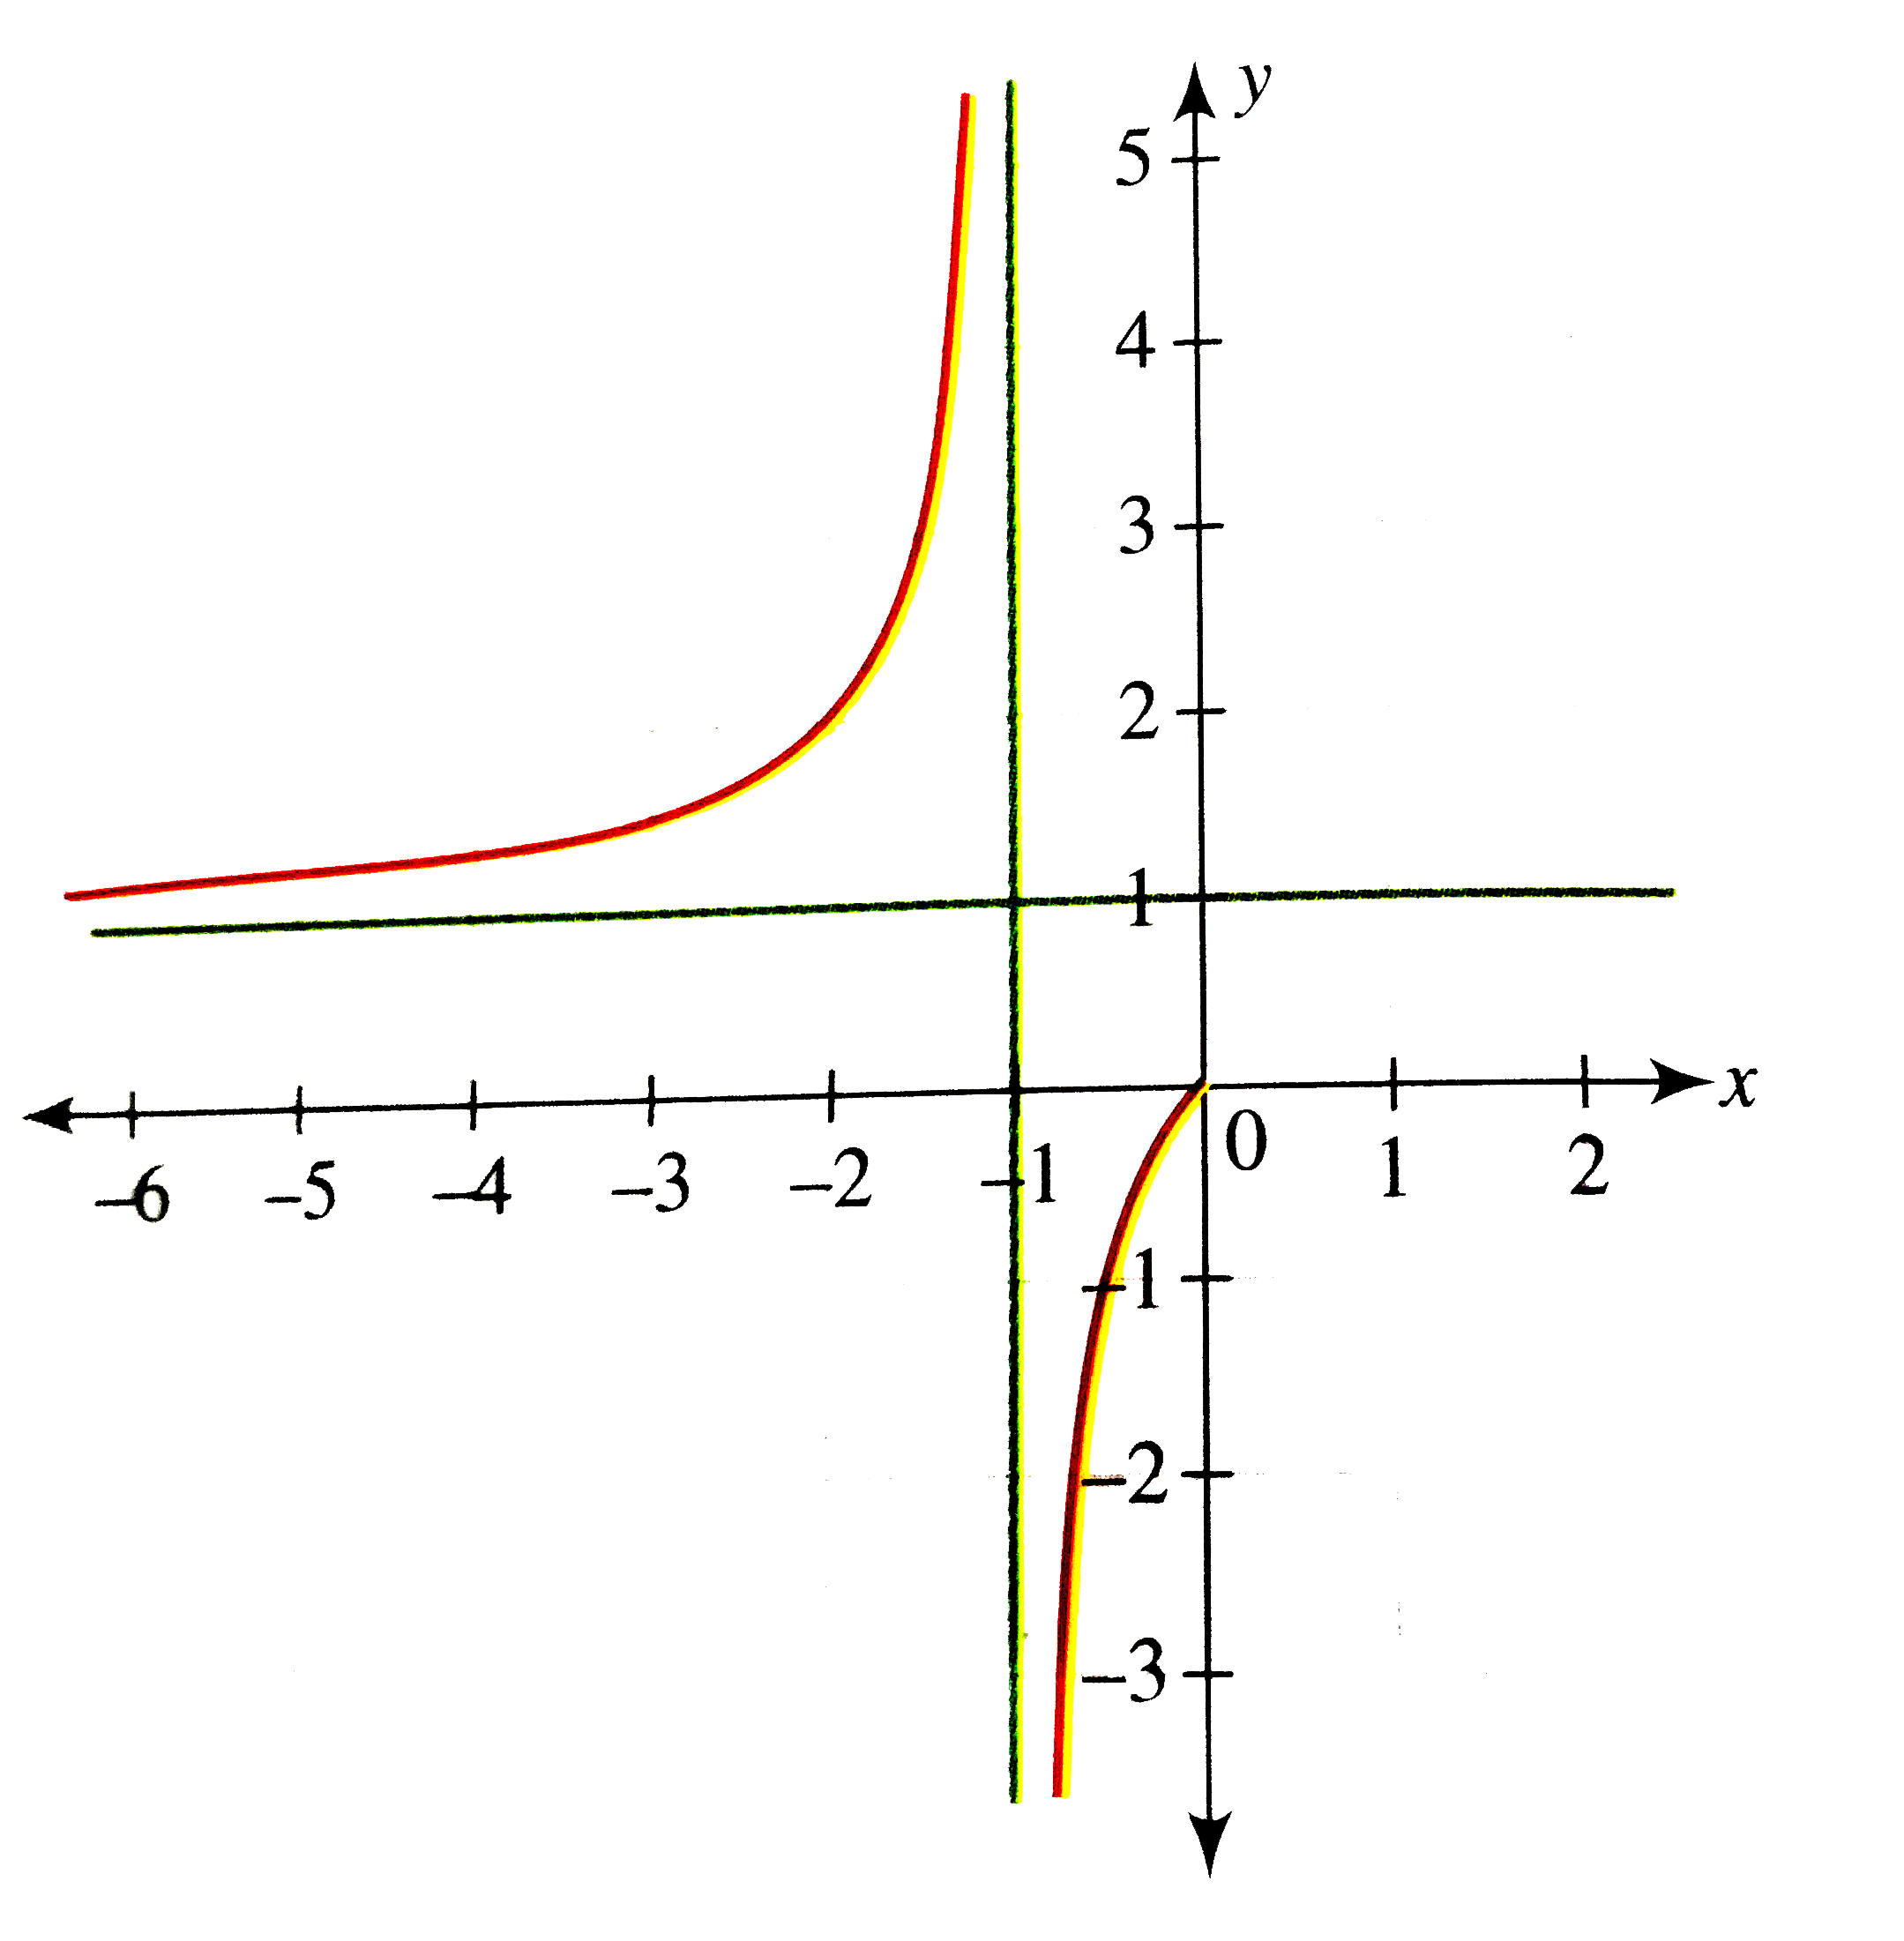
So , which is a rectangular having centre at (-1,1).
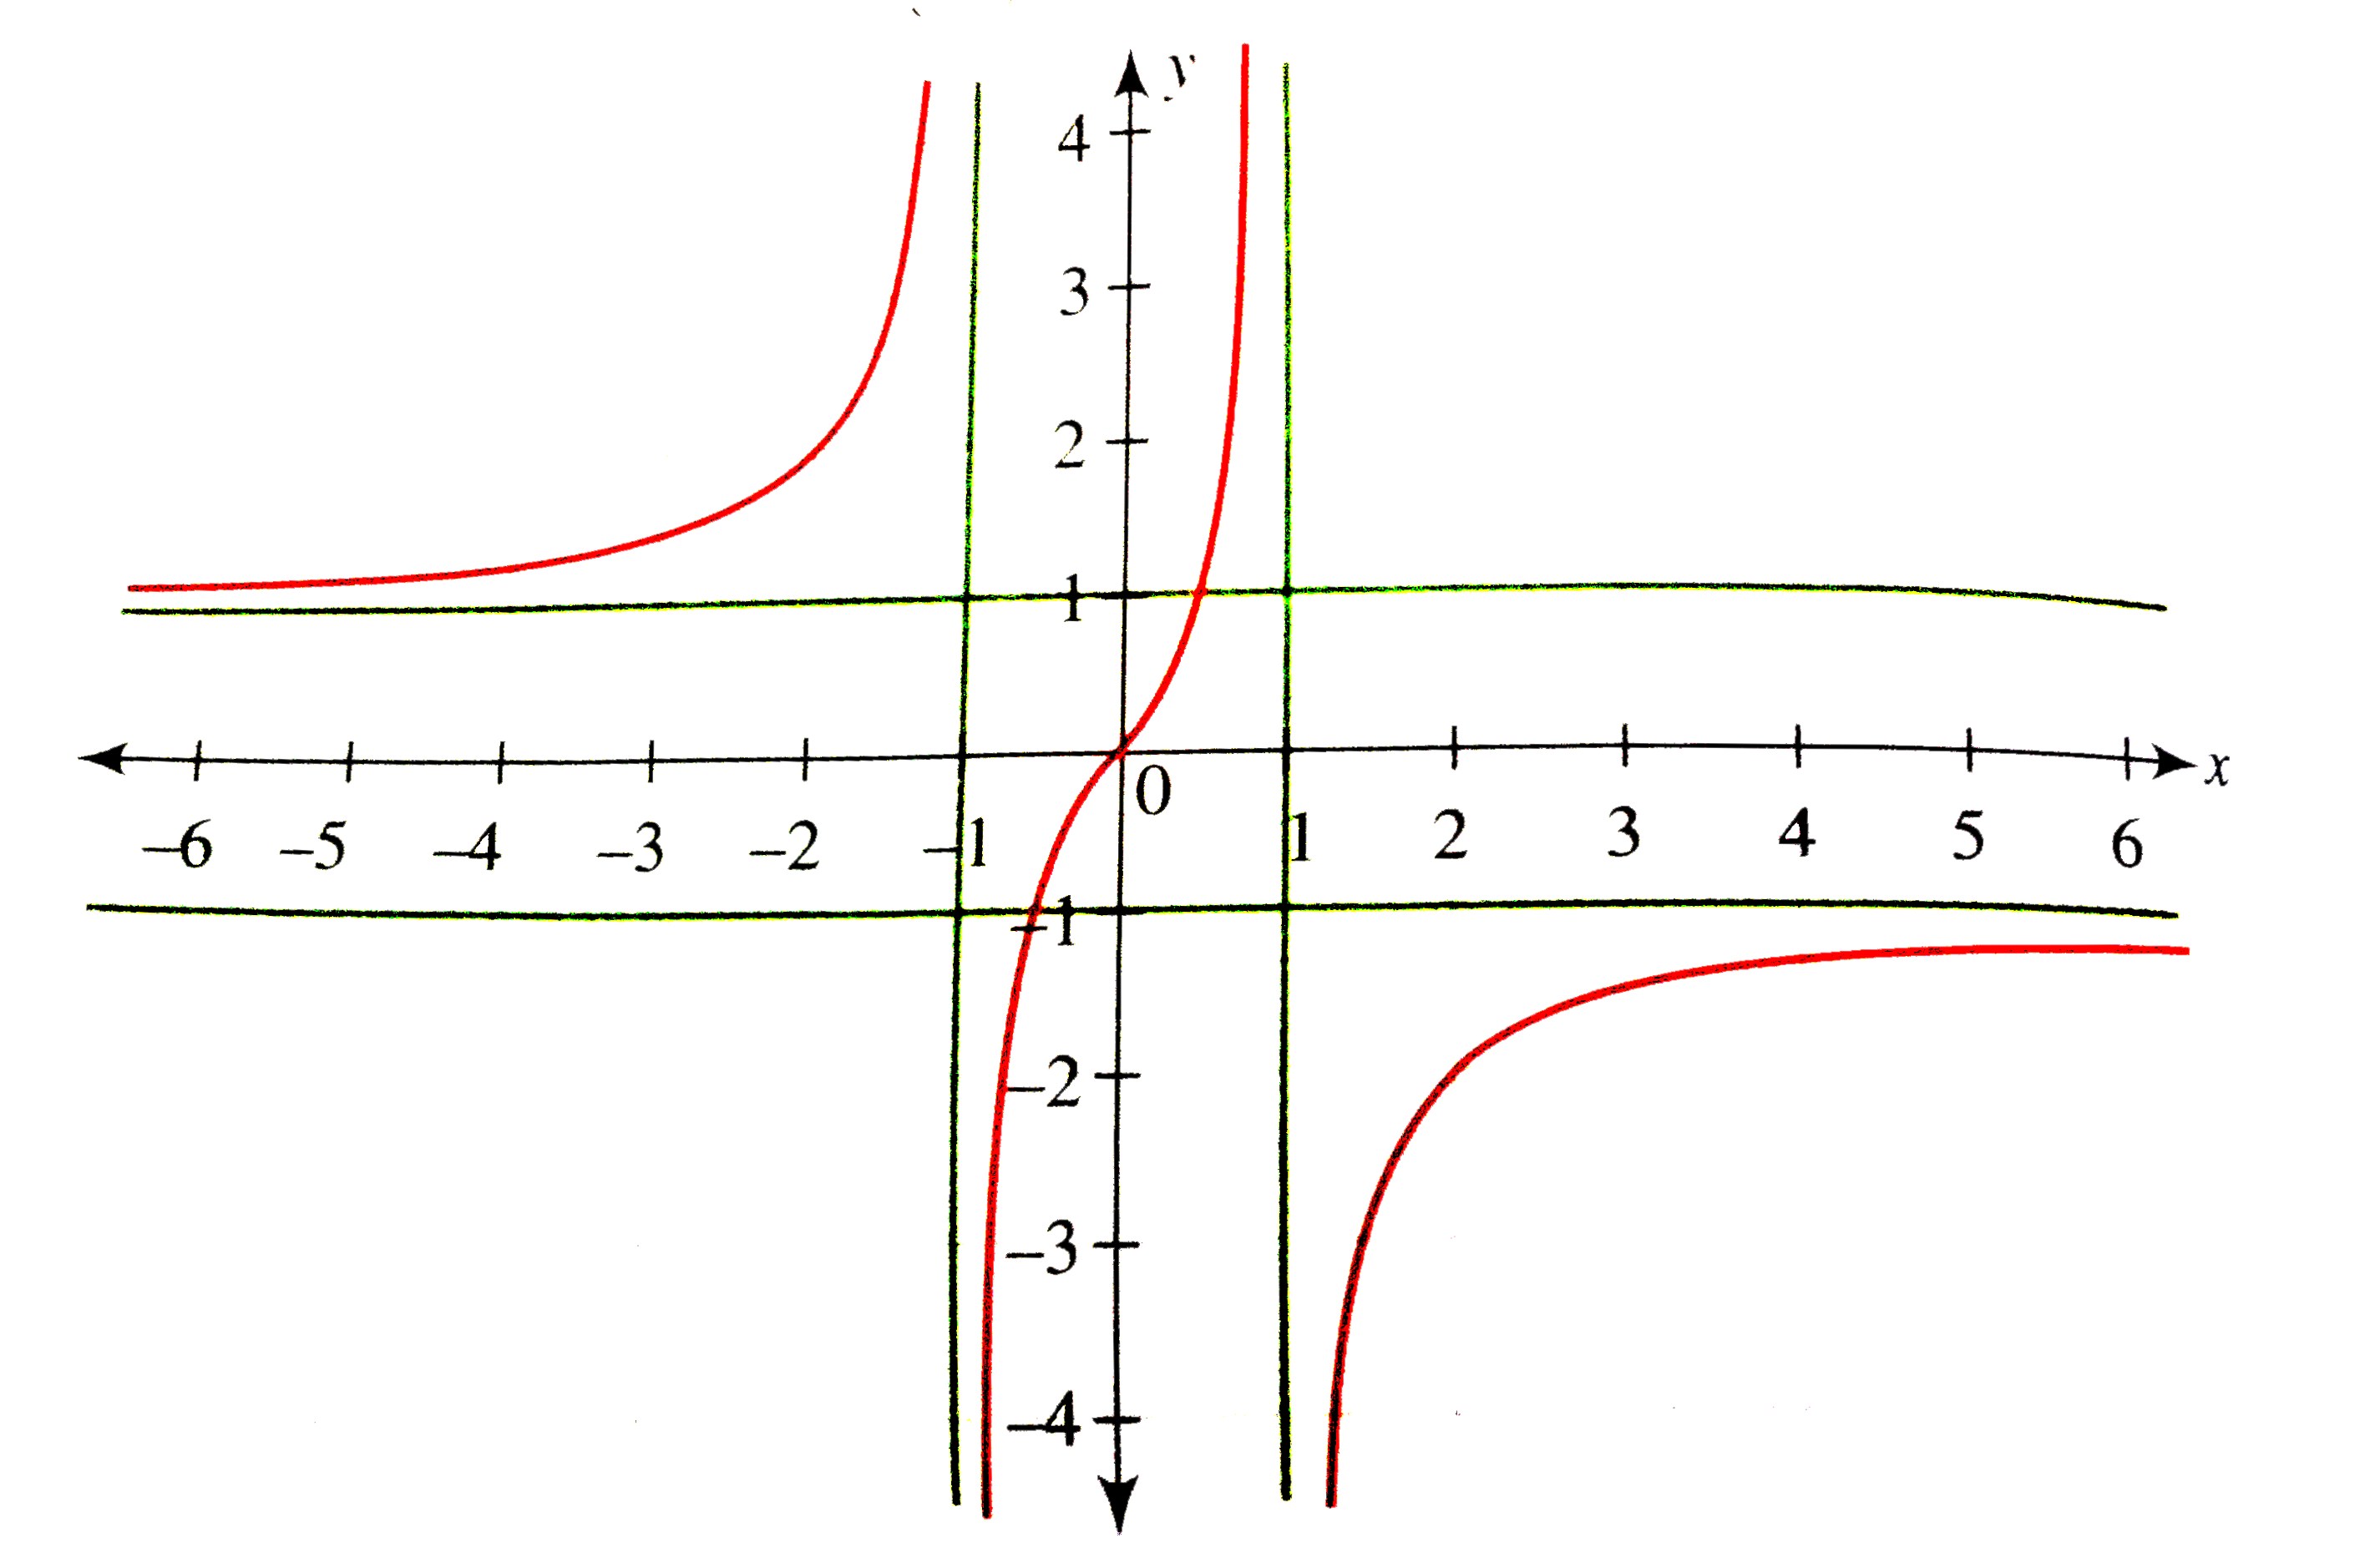
The graph is as shown in the following figure.
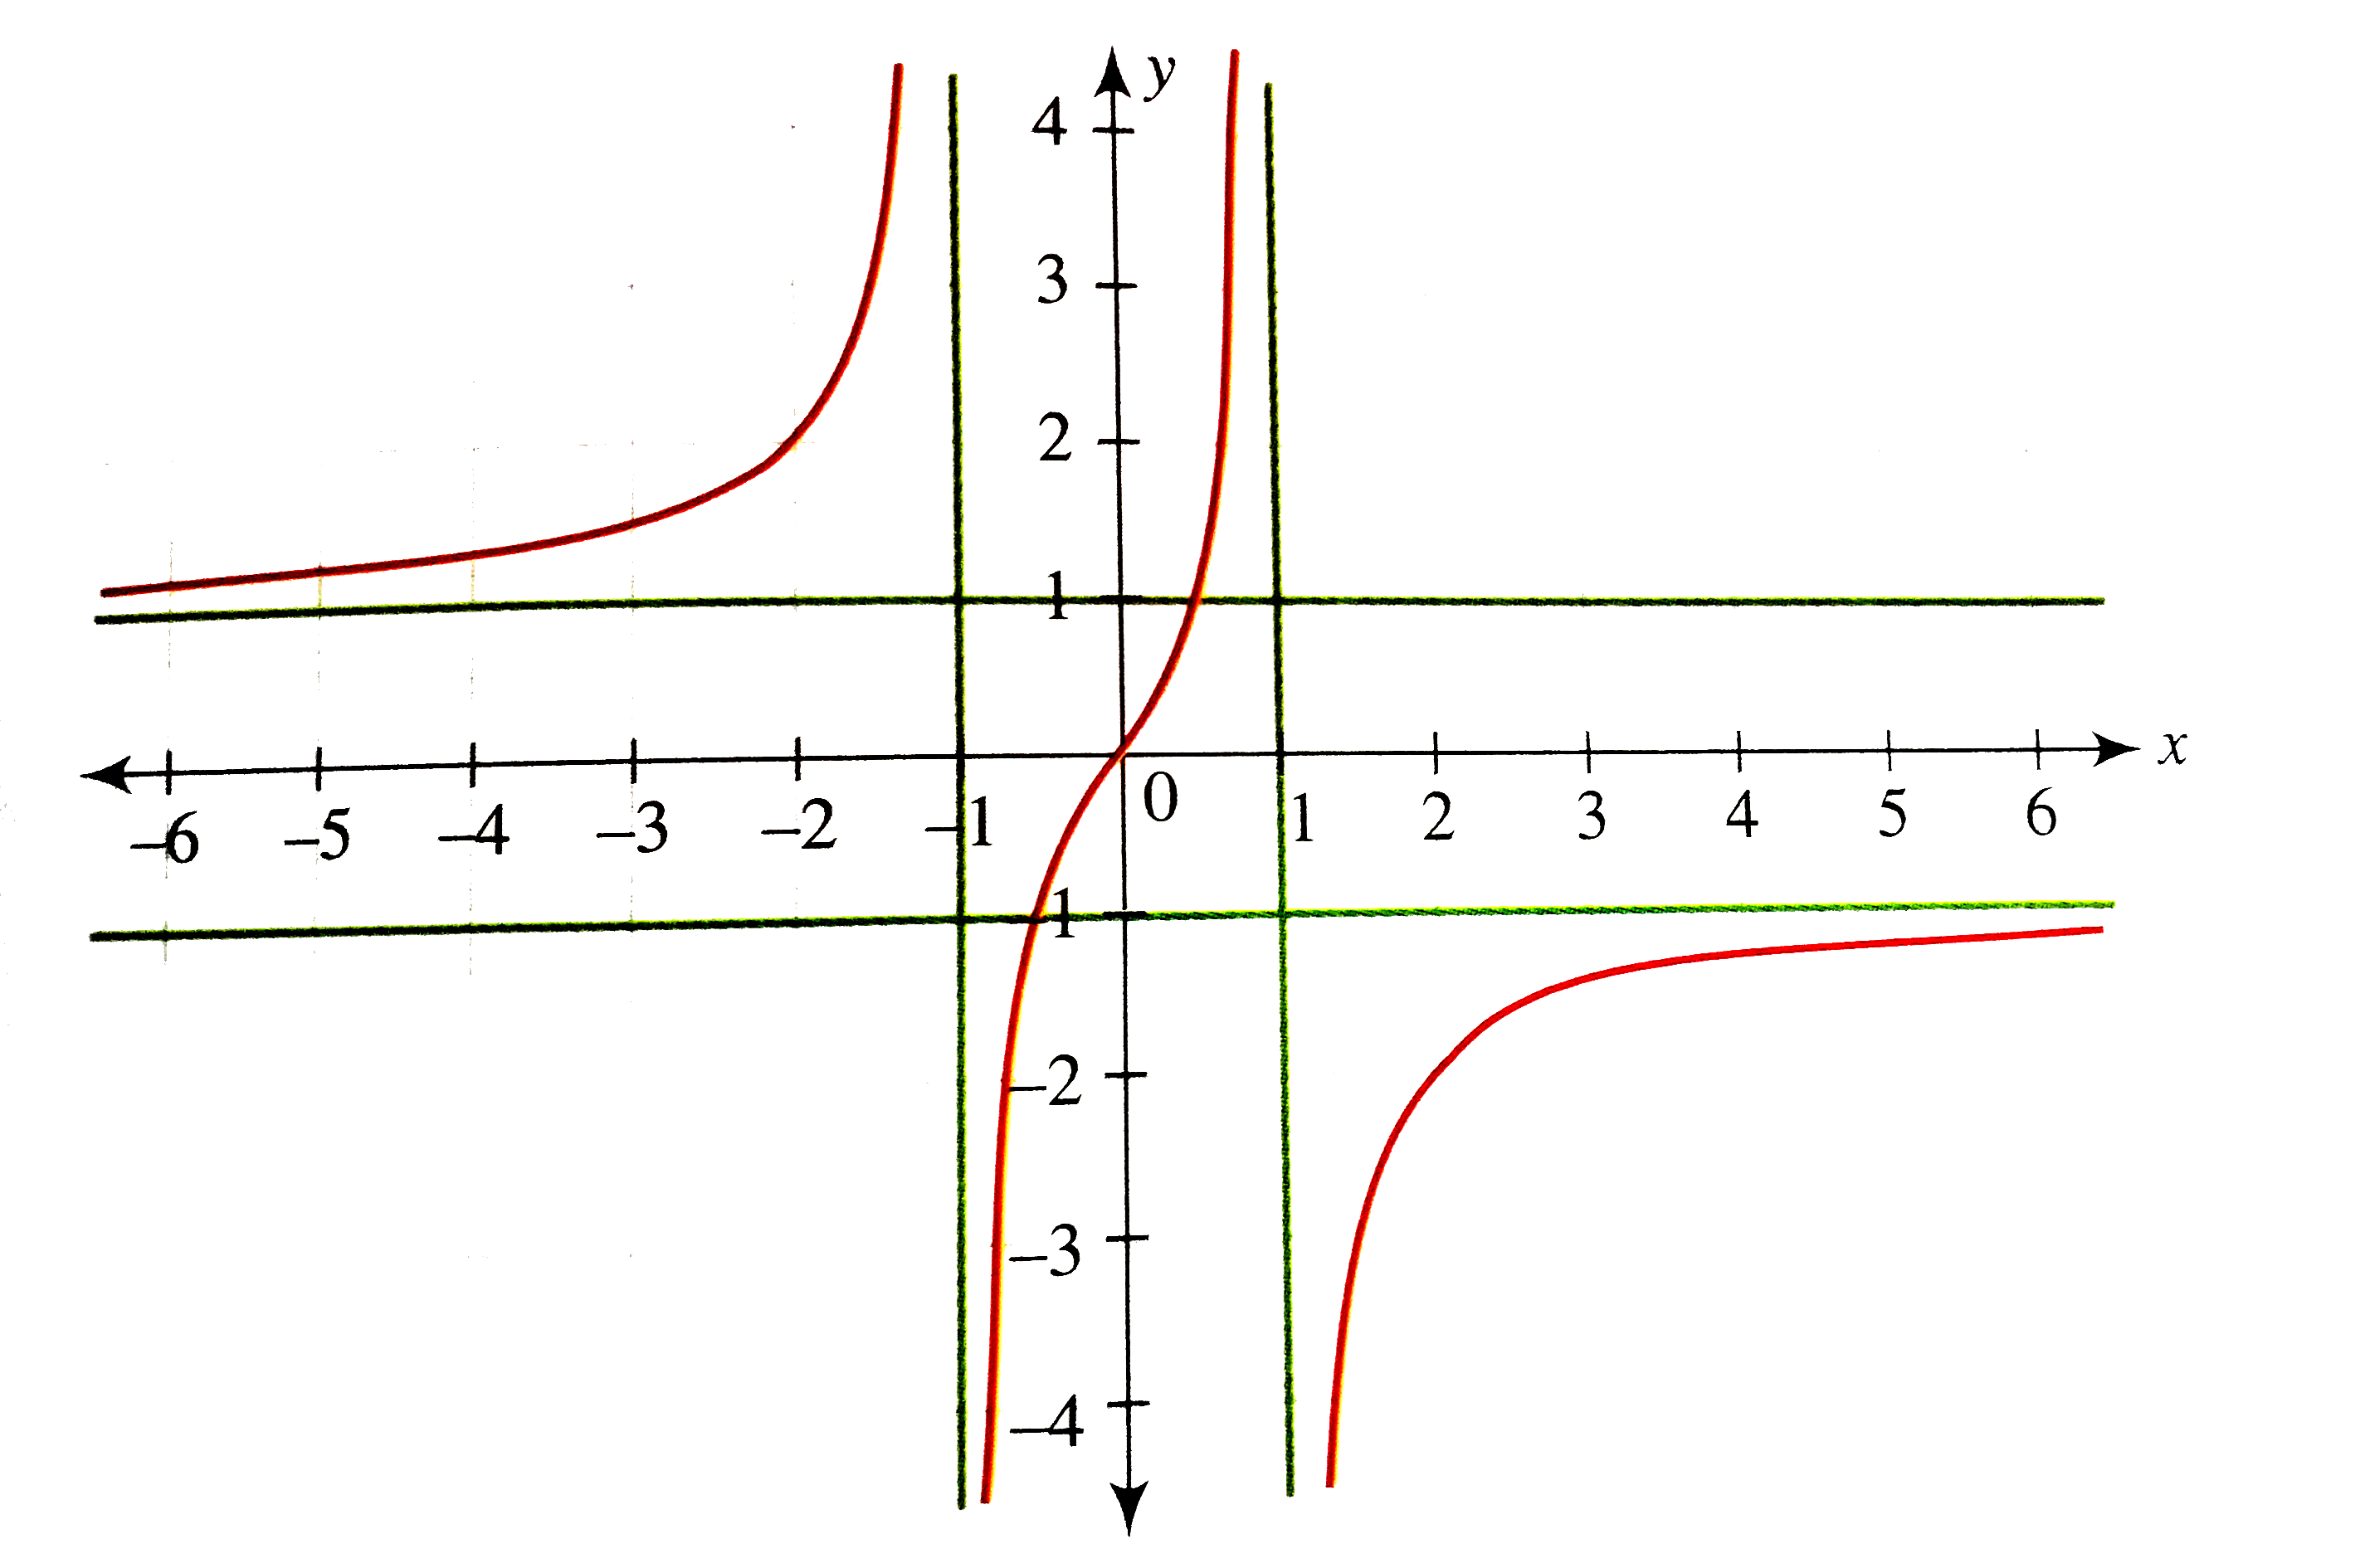
Combining two cases, we get the following graph.
Alternative method
The function has vertical asymptotes as .
Also the function has horizontal asymptotes.
For
For
Graph intersect axis at (0,0)
Hence is an increasing function.
From the above discussion, we have the following reference points and lines.
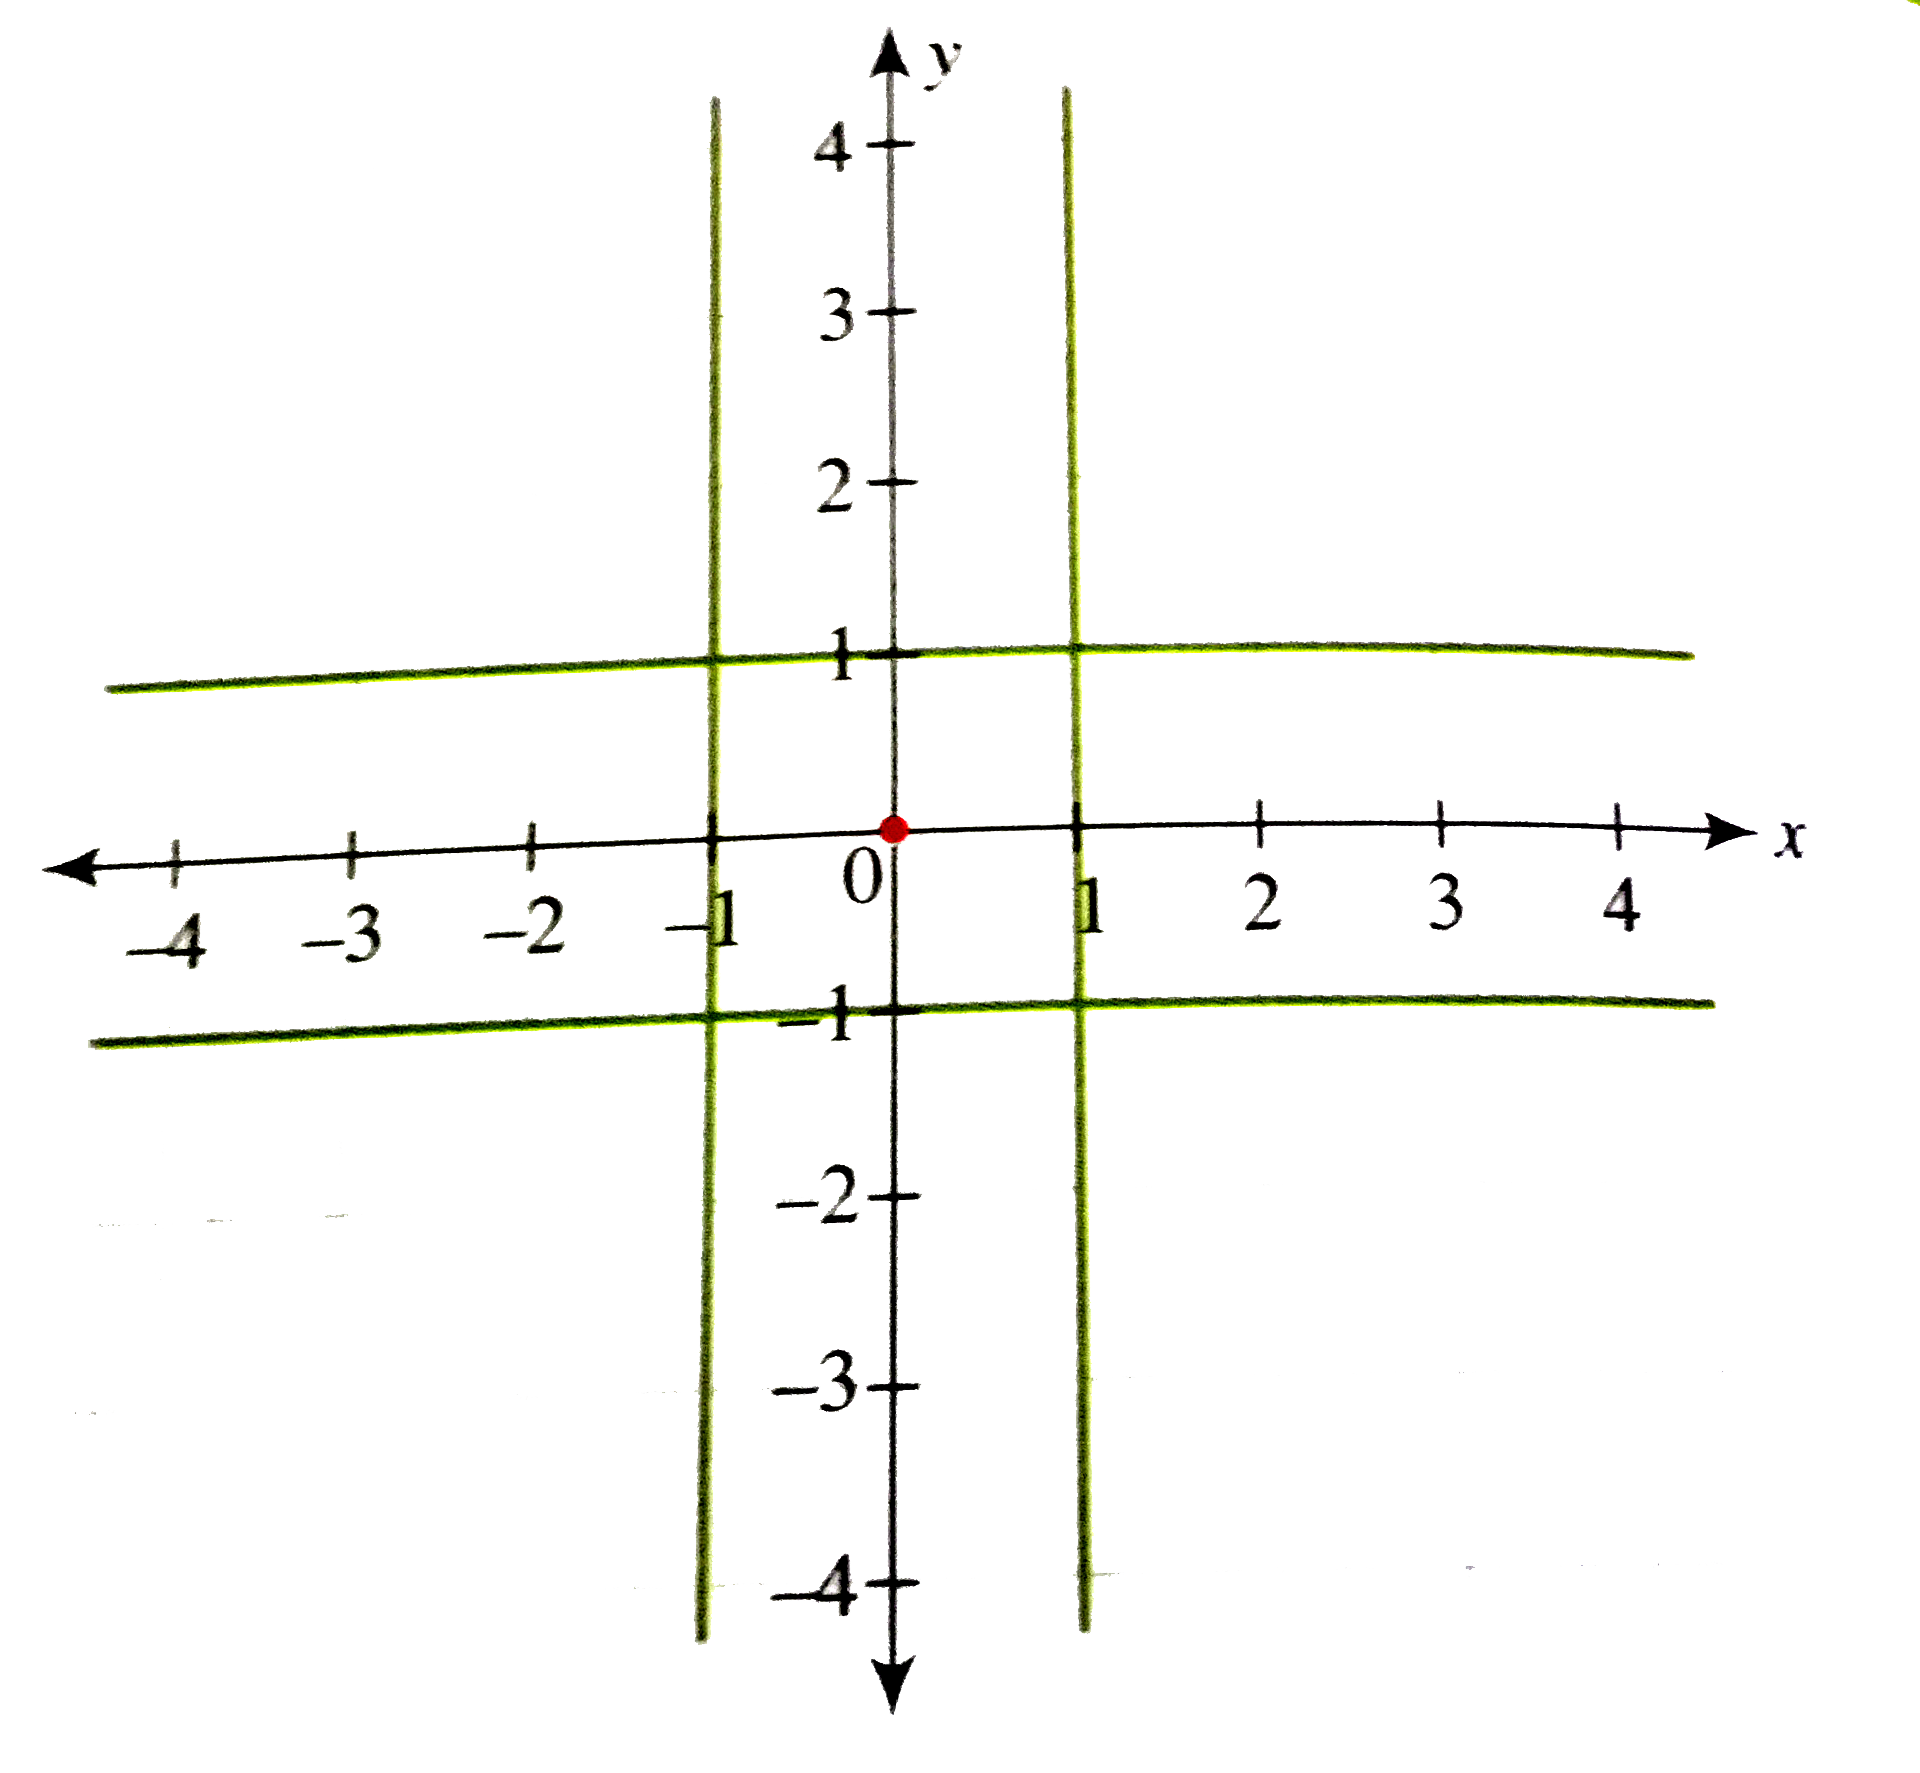
In the above figure, we have three regions, .
In each region, in increasing.
and
and
Hence the graph for is as shown in the following figure.
|
Topper's Solved these Questions
- GRAPHS OF POLYNOMIAL AND RATIONAL FUNCTIONSBook:CENGAGEChapter:GRAPHS OF POLYNOMIAL AND RATIONAL FUNCTIONSExercise:Exercise
Explore 13 Videos
- GRAPHICAL TRANSFORMATIONSBook:CENGAGEChapter:GRAPHICAL TRANSFORMATIONSExercise:Exercise
Explore 22 Videos
- GRAPHS OF ELEMENTARY FUNCTIONS Book:CENGAGEChapter:GRAPHS OF ELEMENTARY FUNCTIONS Exercise:Exercise
Explore 34 Videos
Similar Questions
Knowledge Check
The graph of the function f:R→R defined by f(x)=|x|2+|x|1+x2 may lie in :
A1st and IInd quadrantBIIst and IIInd quadrantCIIIst and IVnd quadrantDnone of theseThe function f:R→R is defined by f(x)=(x−1)(x−2)(x−3) is
Aone-one but not ontoBonto but not one-oneCboth one-one and ontoDneither one-one nor ontoThe function f:R→R defined by f(x)=(x−1)(x−2)(x−3) is
Aone-one but not ontoBonto but not one-oneCboth one-one and ontoDneither one-one nor onto
Draw the graph of the function f(x)=(1+1x)2
View SolutionDraw the graph of the function: f:R→R defined by f(x)=x3,x∈R
View SolutionDraw the graph of the function: f(x)=−|x−1|12
View SolutionDraw the graph of the function f:R→Rdefined by f(x)=x3, x∈R.
View SolutionConsider function f:R−{−1,1}→R. f(x)=x1−|x| Then the incorrect statement is
View Solution