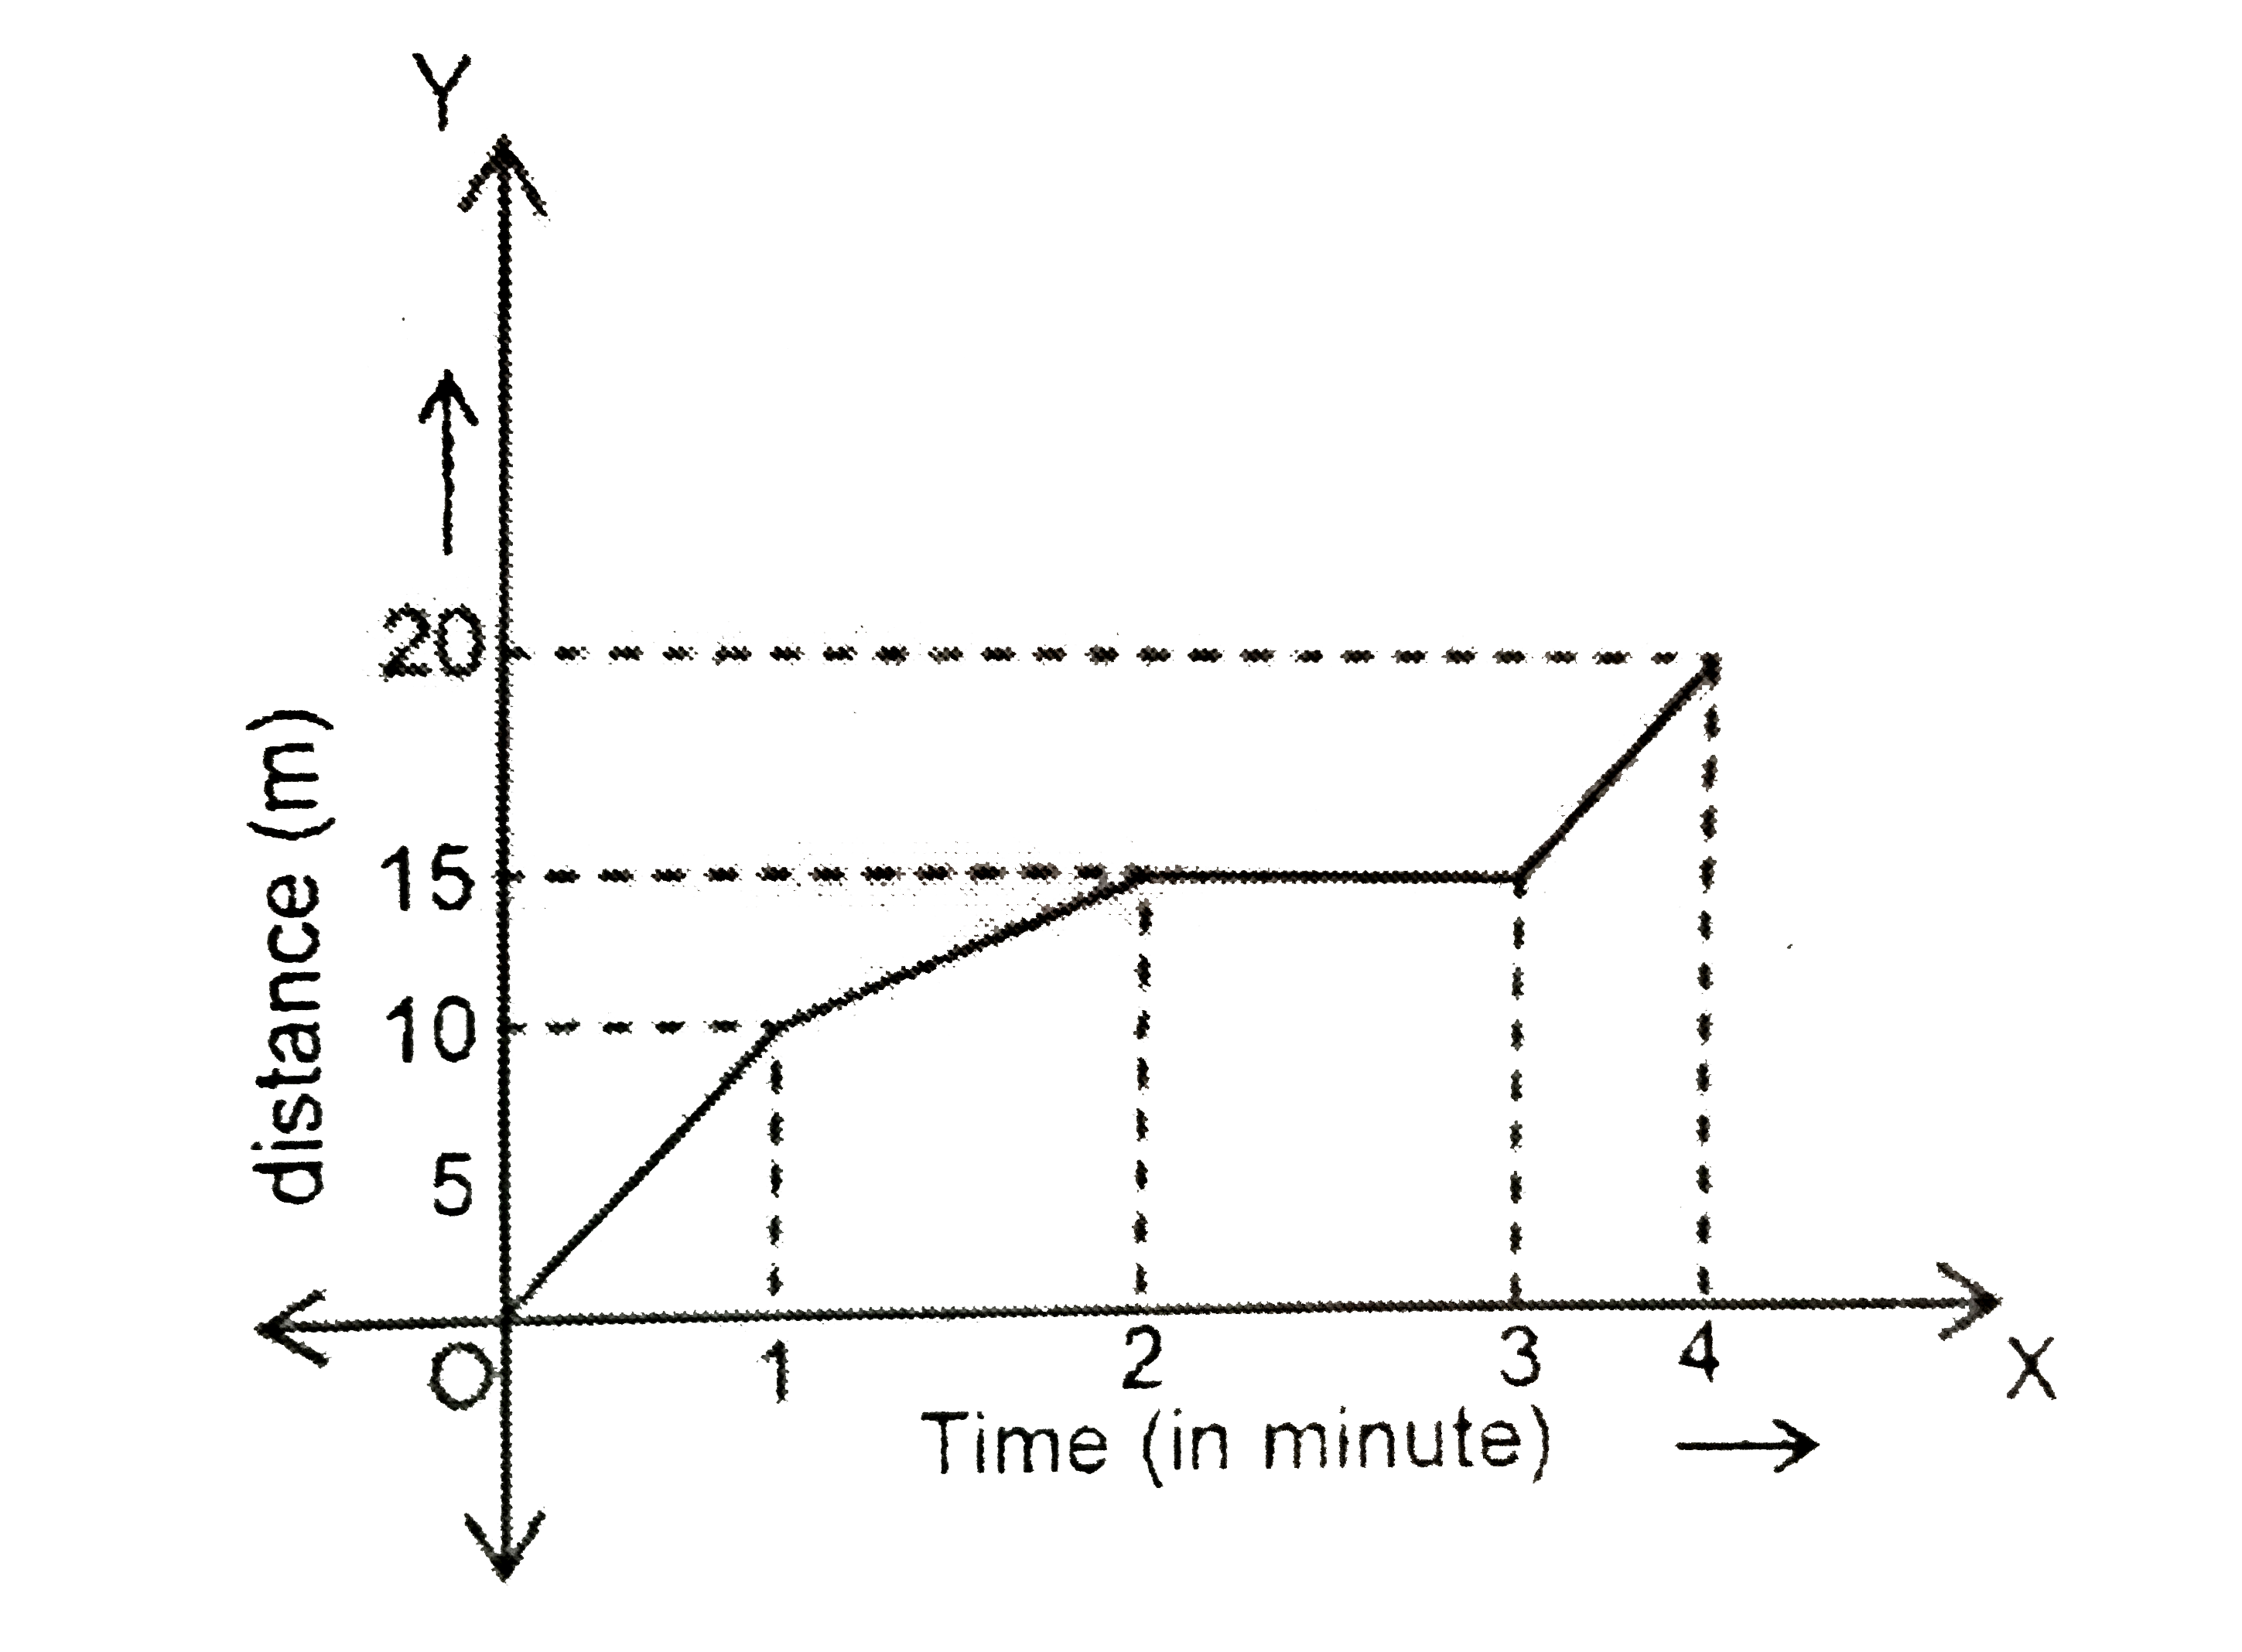
Distance versus time graph of an object is as shown in the figure. The average speed of the object is _____ ms−1
A
0.08
B
0.5
C
1
D
2
Video Solution
Text Solution
The correct Answer is:A
Average velocity = total displacementtotal time=204×60
= 0.08ms−1
|
Topper's Solved these Questions
- KINEMATICSBook:PEARSON IIT JEE FOUNDATIONChapter:KINEMATICSExercise:CONCEPT APPLICATION (LEVEL 1 (MATCH THE COLUMN))
Explore 3 Videos
- KINEMATICSBook:PEARSON IIT JEE FOUNDATIONChapter:KINEMATICSExercise:CONCEPT APPLICATION (LEVEL 2 (SELECT THE CORRECT ALTERNATIVE))
Explore 30 Videos
- KINEMATICSBook:PEARSON IIT JEE FOUNDATIONChapter:KINEMATICSExercise:CONCEPT APPLICATION (LEVEL 1 (FILL IN THE BLANKS))
Explore 10 Videos
- HEAT Book:PEARSON IIT JEE FOUNDATIONChapter:HEAT Exercise:Test 2
Explore 14 Videos
- LIGHTBook:PEARSON IIT JEE FOUNDATIONChapter:LIGHTExercise:ASSESSMENT TEST (TEST 2 (SELECT THE CORRECT ALTERNATIVE))
Explore 15 Videos
Similar Questions
Knowledge Check
The distance-time graph of a moving vehicle is as shown in the figure.
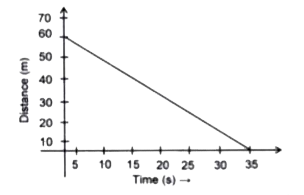 AThe speed of the vehicle is increasing with time.BThe speed of the vehicle is decreasing with time.CThe final speed of the vehicle is zero.DGraph is not possible.
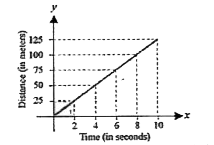
The distance-time graph of an object shown in figure 2.E2.
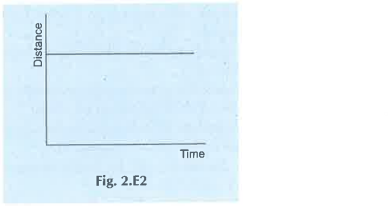
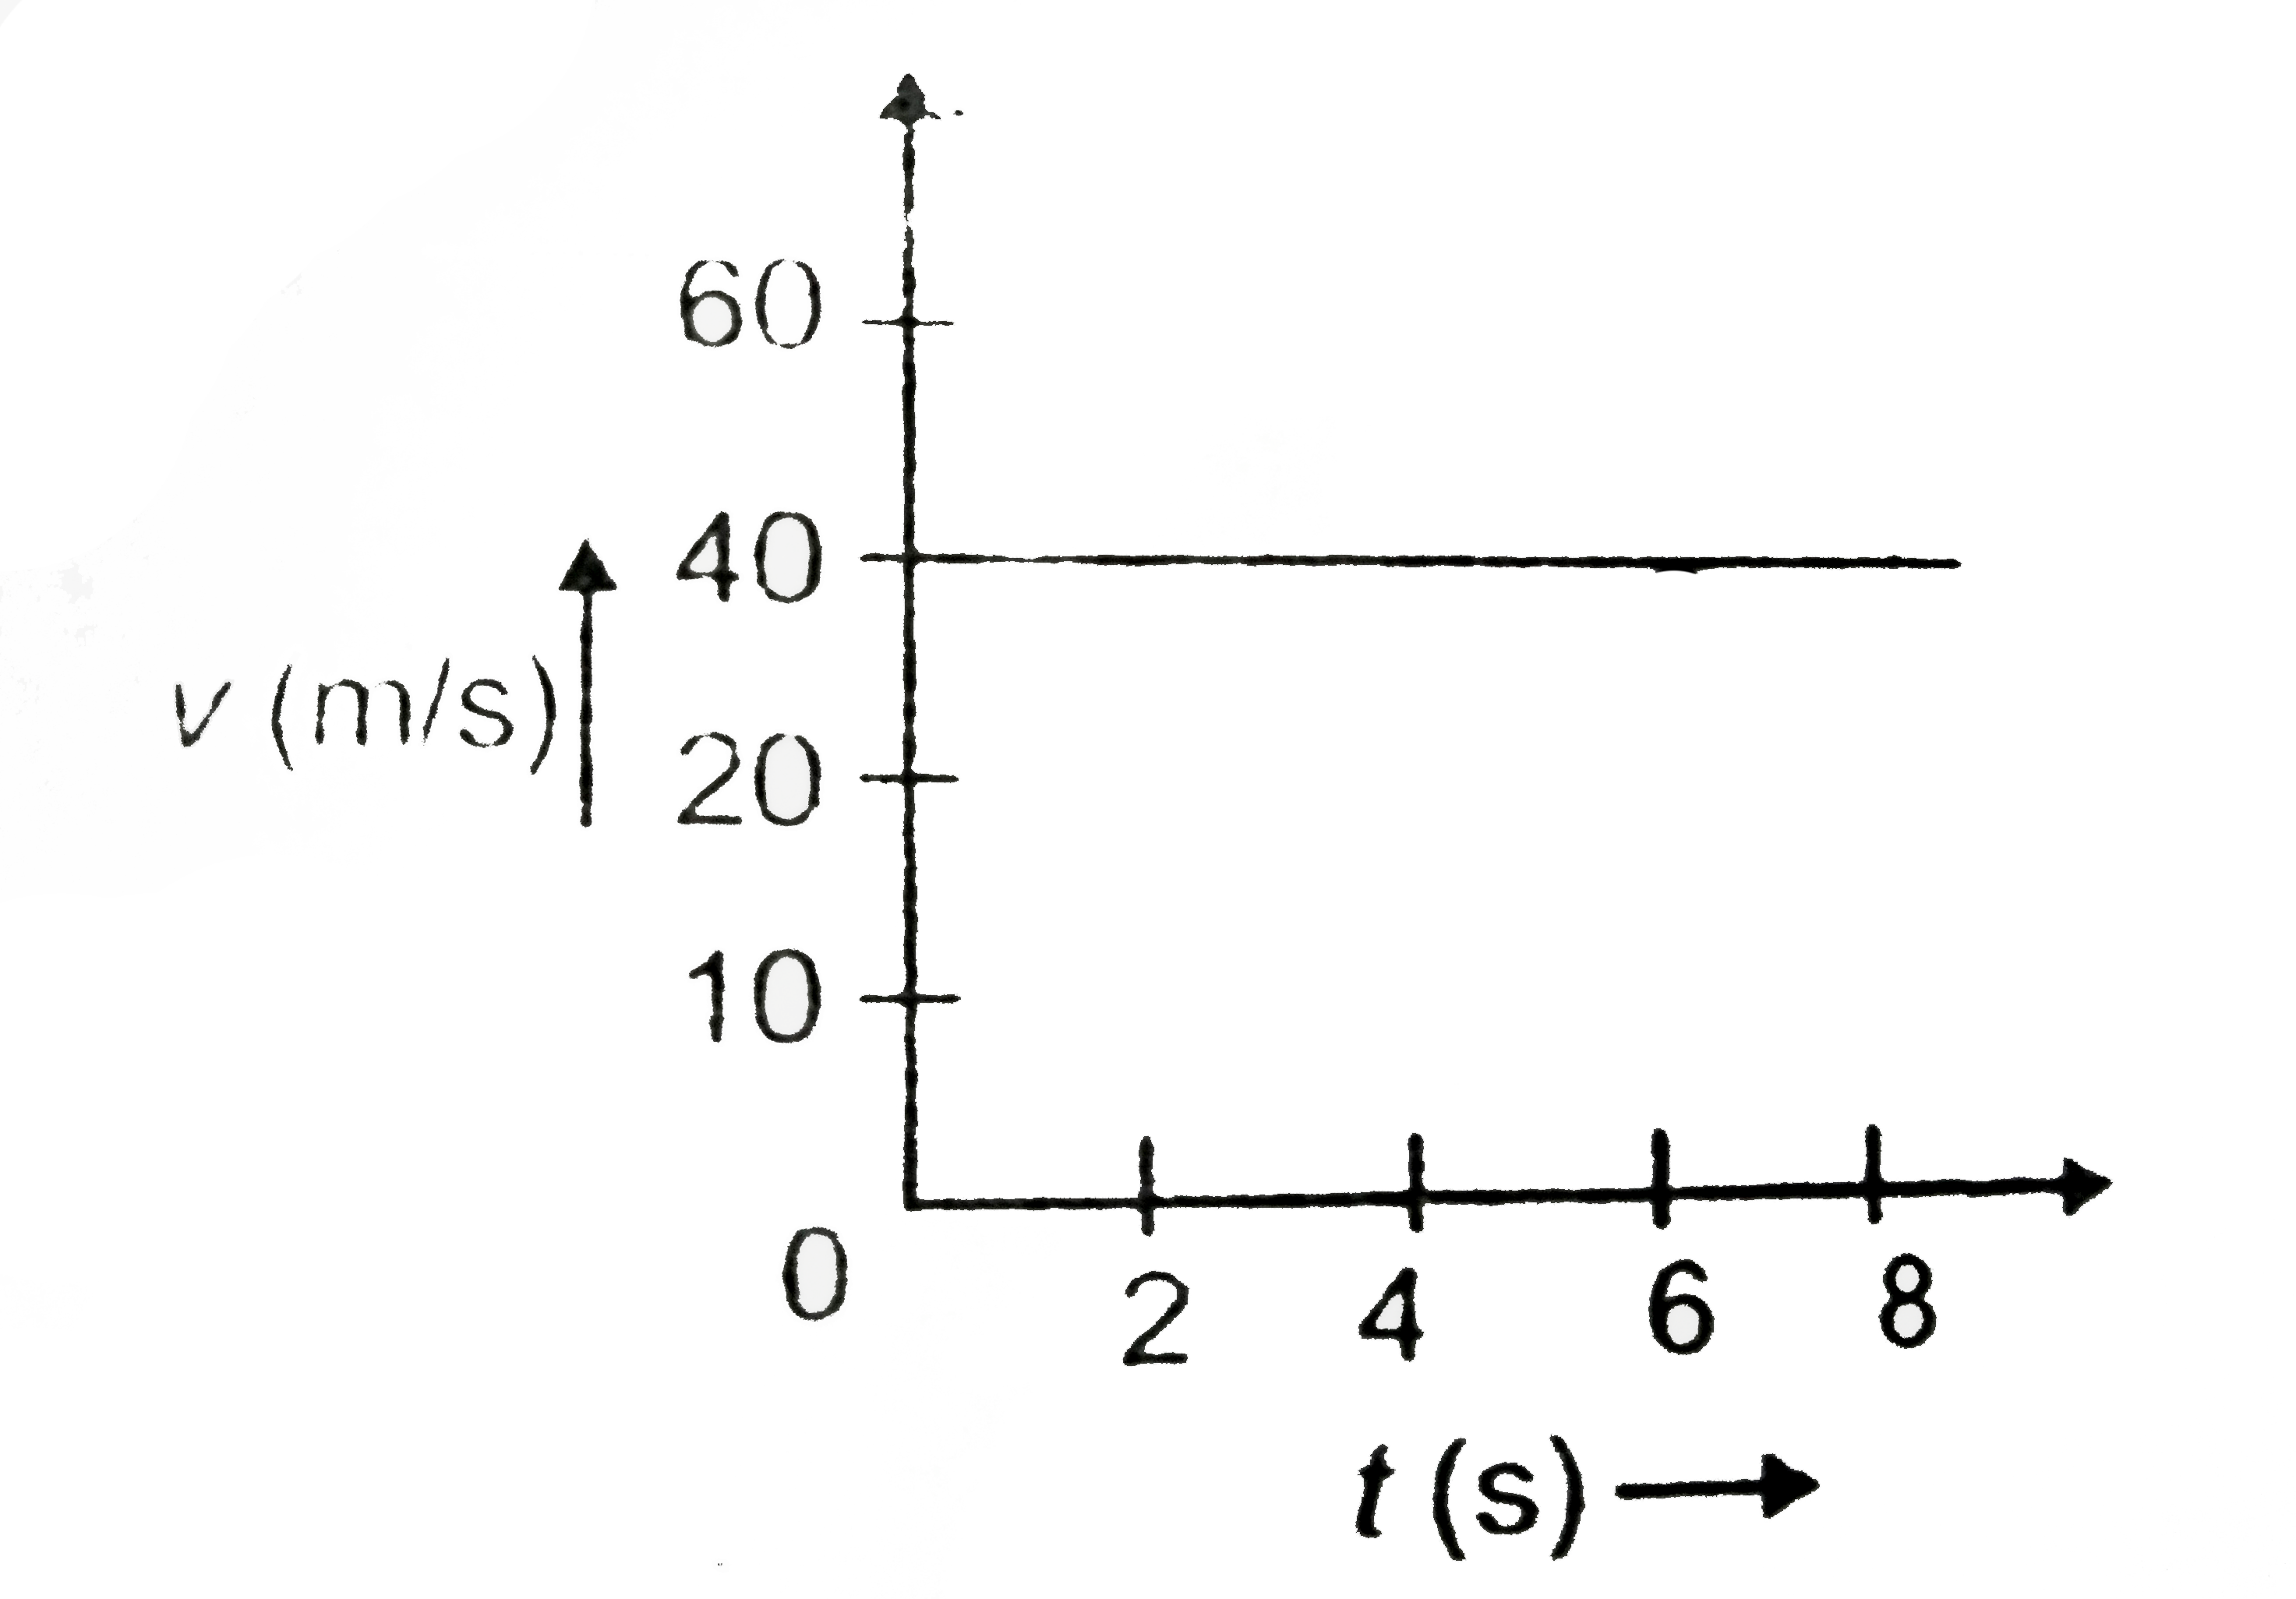
The objectAis at restBmoves with a constant speedCmoves with a constant velocityDmoves with a constant accelerationThe v-t plot of a moving object ios shown in the figure. The average velocity of the object during the first 10 s is
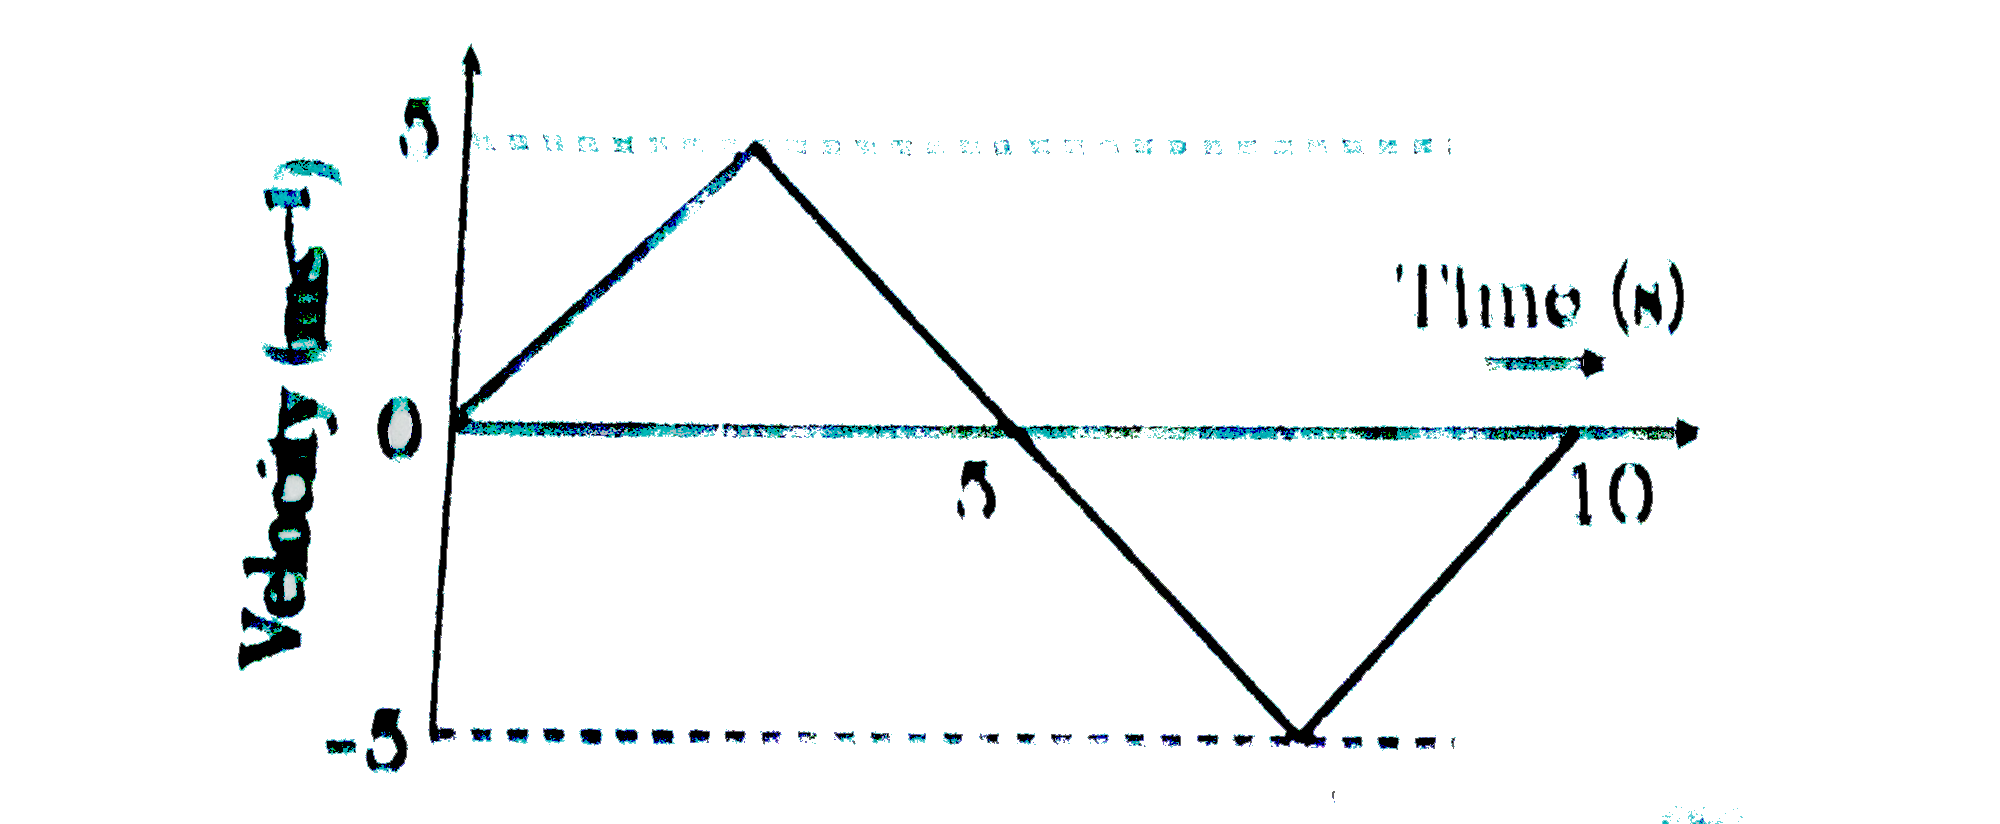 AzeroB2.5ms−1C5ms−1D2ms−1
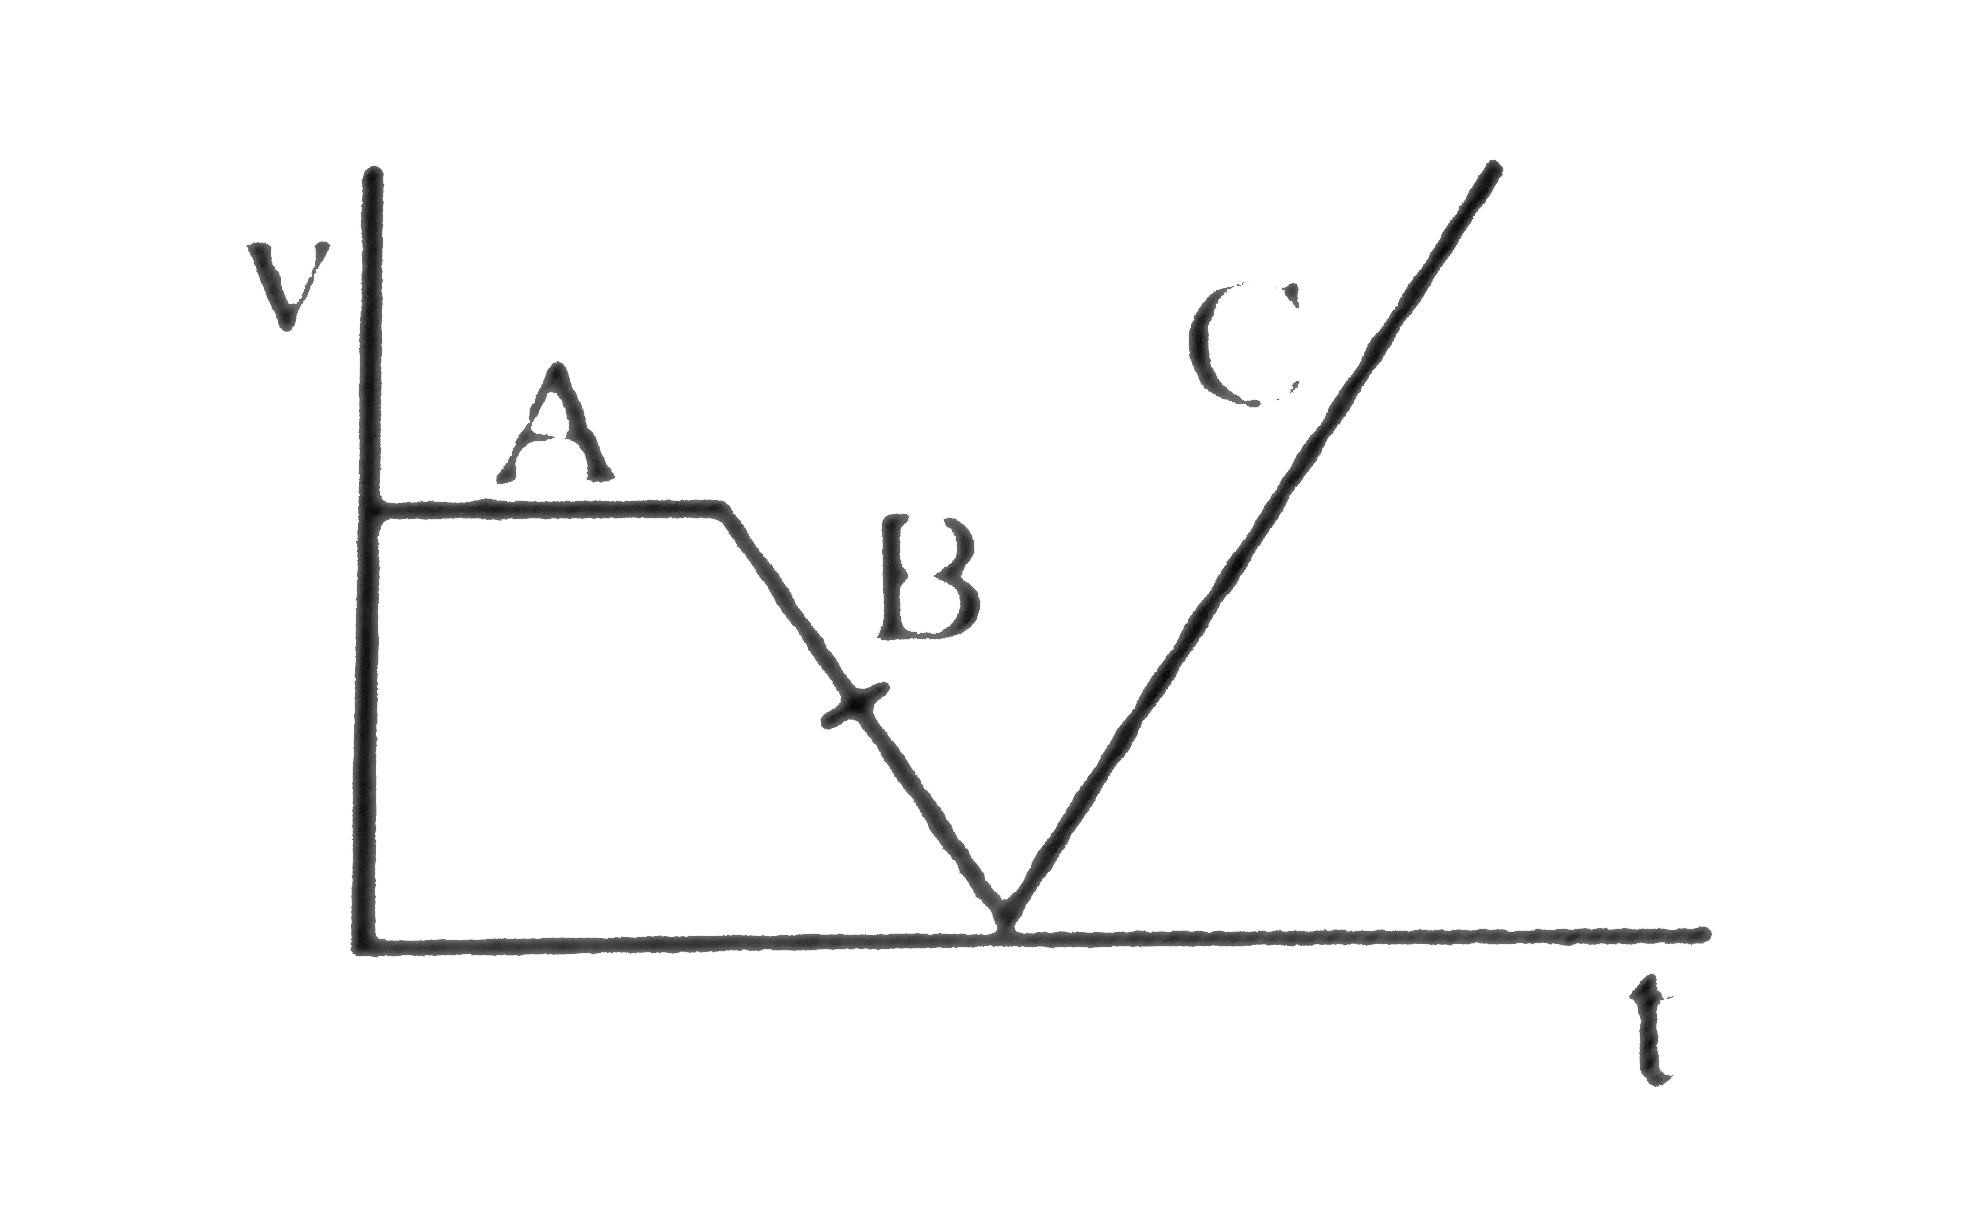
Velocity versus time graph of a body is shown in figure. It explains that
View SolutionAn object travels 20 m in 10 s. What is the average speed of the object ?
View SolutionThe distance -time graph of an object is a straight line parallel to the time axis , then the object is _____.
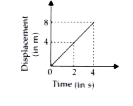
View SolutionDisplacement time graph of an object of mass 2kg is shown in figure. The force required to move the object for first four seconds is
View SolutionThe distance -time graph of an object is a straight line parallel to the time axis , then the object is _____.
View Solution

