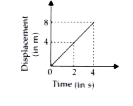
Displacement time graph of an object of mass 2kg is shown in figure. The force required to move the object for first four seconds is
A
0
B
4N
C
2N
D
8N
Video Solution
Text Solution
The correct Answer is:A
The displacement time graph in the question is a straight line with a positive slope . It means object has uniform velocity and zero acceleration.
∴F=m×a=m×0=0
|
Topper's Solved these Questions
- FORCE AND LAWS OF MOTIONBOOK - MTG IIT JEE FOUNDATIONCHAPTER - FORCE AND LAWS OF MOTIONEXERCISE - EXERCISE (MATCH THE FOLLOWING )
2 Videos
- FORCE AND LAWS OF MOTIONBOOK - MTG IIT JEE FOUNDATIONCHAPTER - FORCE AND LAWS OF MOTIONEXERCISE - EXERCISE (ASSERTION AND REASON )
10 Videos
- FORCE AND LAWS OF MOTIONBOOK - MTG IIT JEE FOUNDATIONCHAPTER - FORCE AND LAWS OF MOTIONEXERCISE - EXERCISE MULTIPLE CHOICE QUESTIONS
1 Videos
- FOOTSTEPS TOWARDS NEETBOOK - MTG IIT JEE FOUNDATIONCHAPTER - FOOTSTEPS TOWARDS NEETEXERCISE - Multiple Choice Question
45 Videos
- GRAVITATION BOOK - MTG IIT JEE FOUNDATIONCHAPTER - GRAVITATION EXERCISE - Olympiad/HOTS Corner
20 Videos
Similar Questions
Knowledge Check
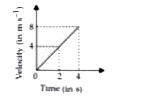
Velocity time graph of an object of mass 2kg is shown in figure. The force required to move the object for first four seconds is
 A0NB4NC2ND8N
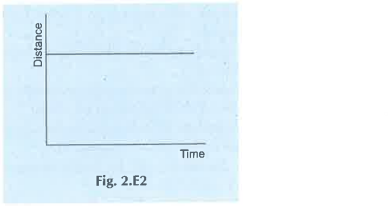
Distance versus time graph of an object is as shown in the figure. The average speed of the object is _____ ms−1
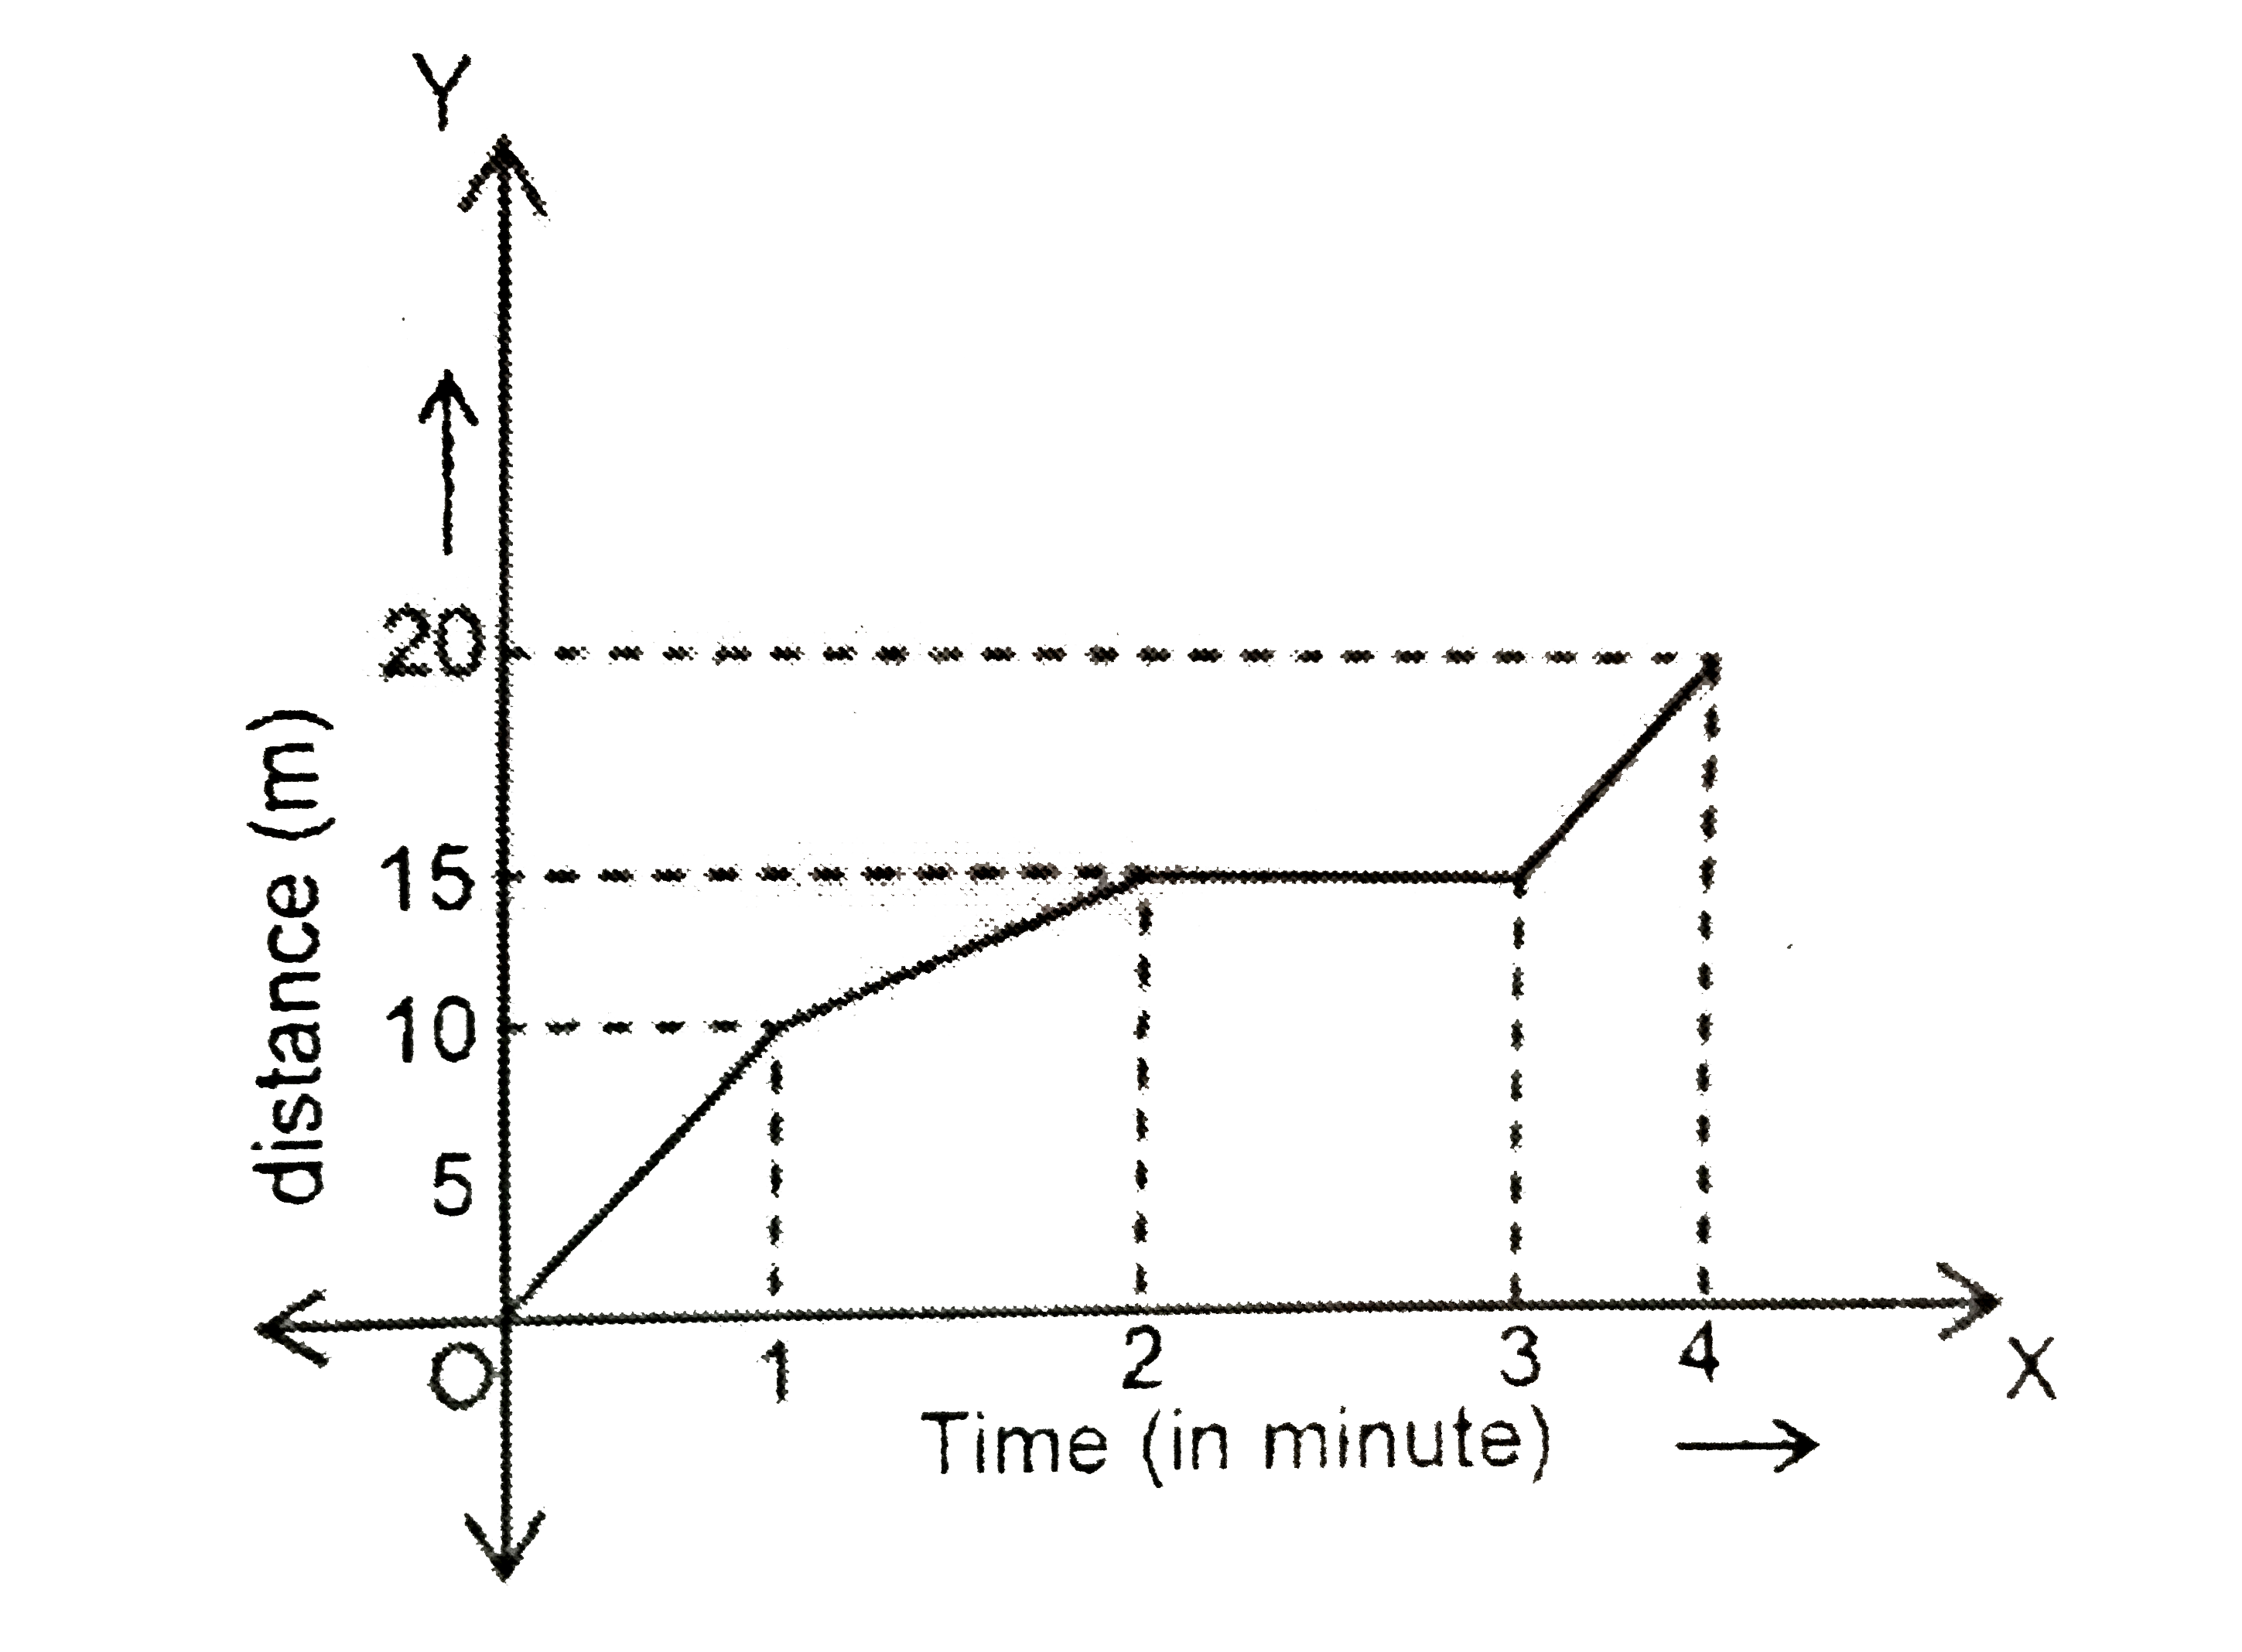 A0.08B0.5C1D2
v-t graph of an object of mass 1 kg is shown. Select the wrong statement -
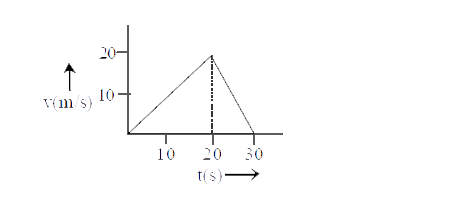 AWork done on the object in 30 s is zeroBThe average acceleration of the object is zeroCThe average velocity of the object is zeroDThe average force on the object is zero
Distance versus time graph of an object is as shown in the figure. The average speed of the object is _____ ms−1

View Solutionv-t graph of an object of mass 1 kg is shown.Select the wrong statement-

View SolutionDisplacement time graph of a particle moving in a straight line is a shown in figure.

View SolutionThe velocity - time graph of a particle of mass 10 kg is shown in the figure. The net work done on the particle in the first two seconds of the motion is

View SolutionThe v-t plot of a moving object ios shown in the figure. The average velocity of the object during the first 10 s is
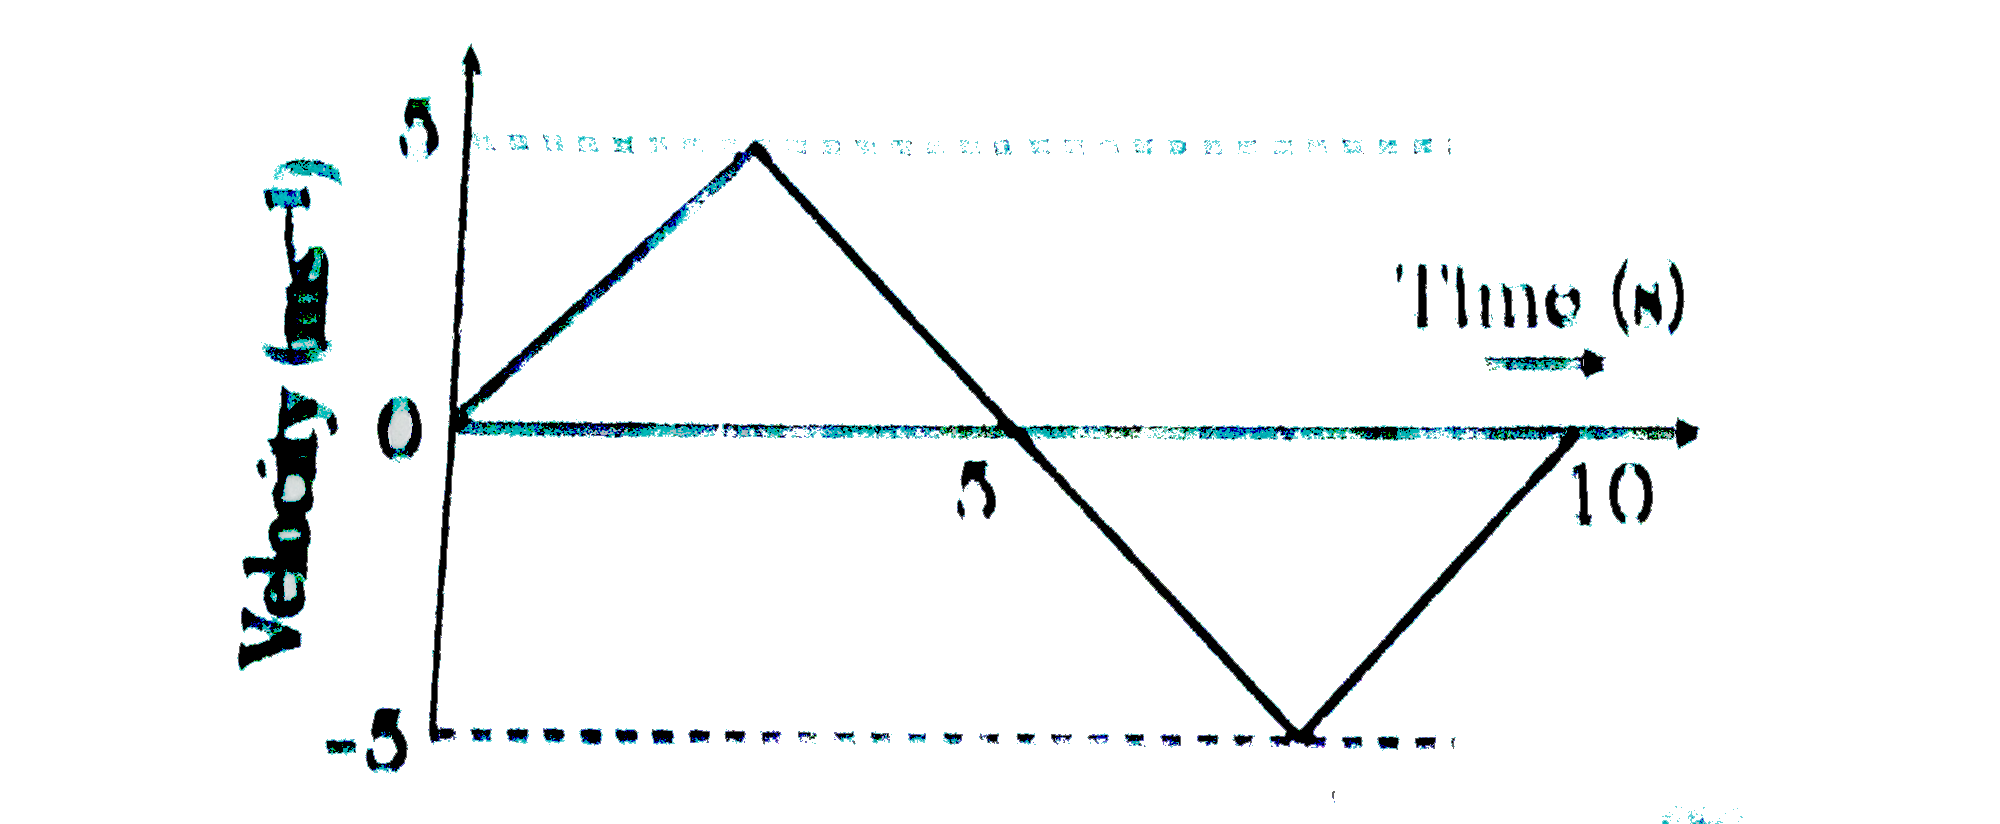
View Solution

