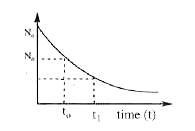
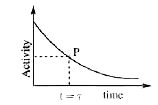
Plot a graph showing variation of activity of a given radioactive sample with time.Solution in Punjabi
Step by step video & image solution for Plot a graph showing variation of activity of a given radioactive sample with time. by Physics experts to help you in doubts & scoring excellent marks in Class 12 exams.
Similar Questions
Lother Meyer plotted a graph showing the variation of
01:53View SolutionPlot a graph showing the variation of undecayed nuclei N versus time t. From the graph, find out how one can determine the half-life and average life of the radioactive nuclei.
View SolutionA radioactive sample decays to form a stable nuclide. A graph showing variation of rate of disintegration (dNdt) of radioactive sample with time (t) is
View SolutionPlot a graph showing variation of current versus voltage for the material Ga.
02:04View SolutionGraph shows the variation of the number of radioactive atoms left undecayed with time. Find the time corresponding to N=N0/3 ?
 View Solution
The activity of a certain radioactive sample is plotted against time in graph. If the initial slope of the curve is m, then find the slope of the curve at point P ?
 View Solution
Plot the graph showing variation of of resistance with increase in cell constant
01:39View Solution

