The graph obtained by plotting loge(A) [A is the activity of a radioactive sample] against t (time) out of the following
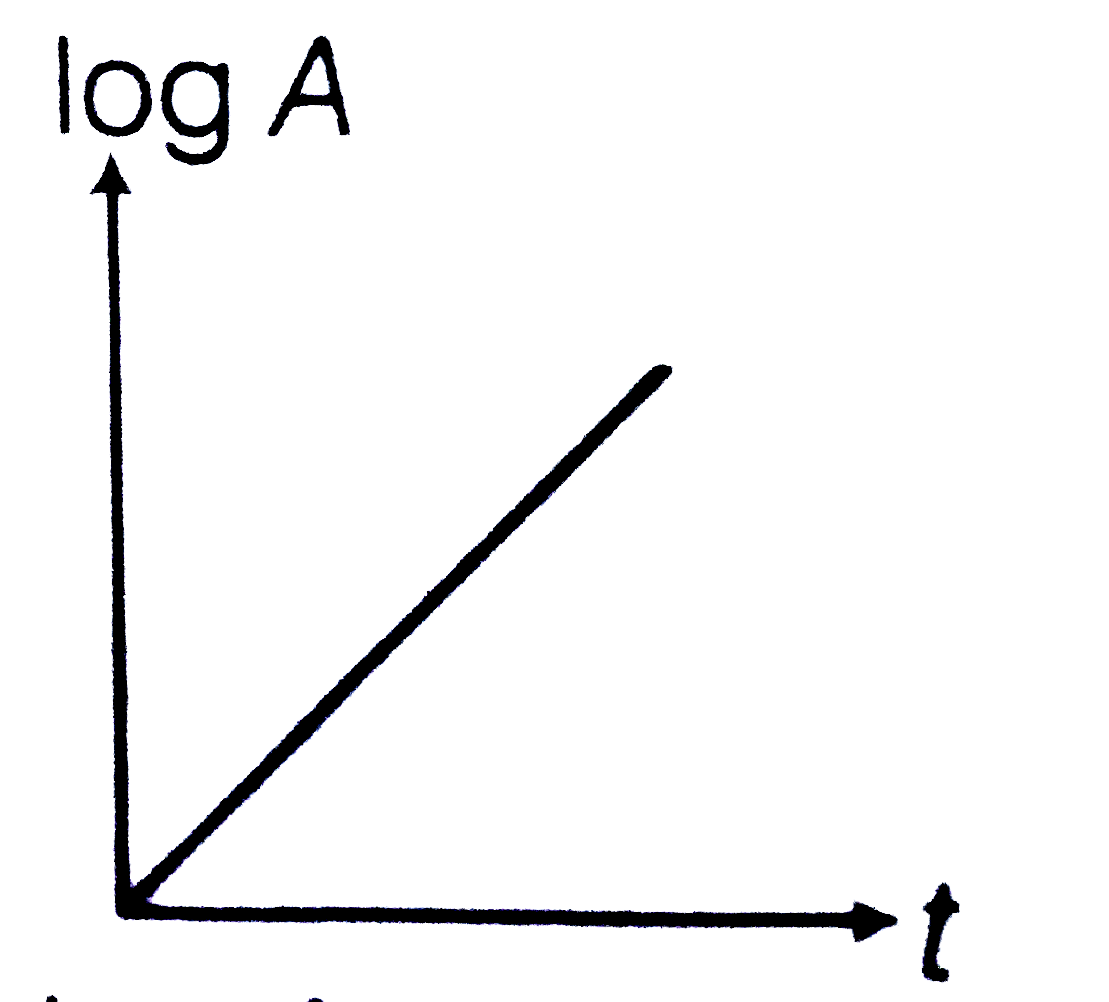
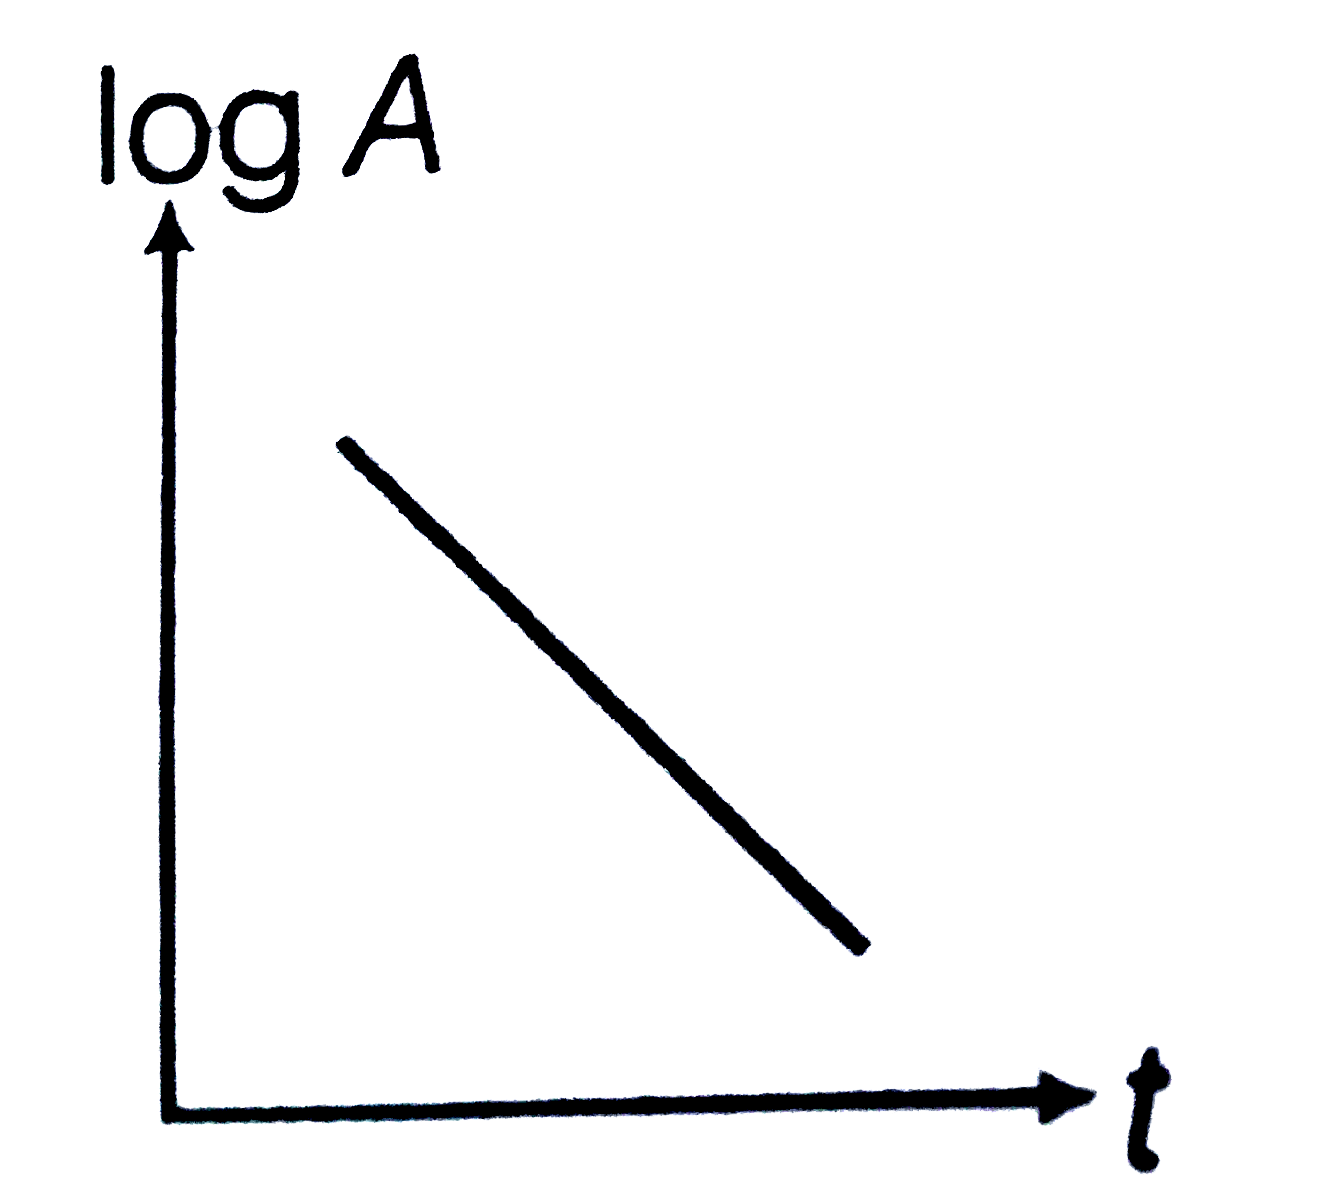
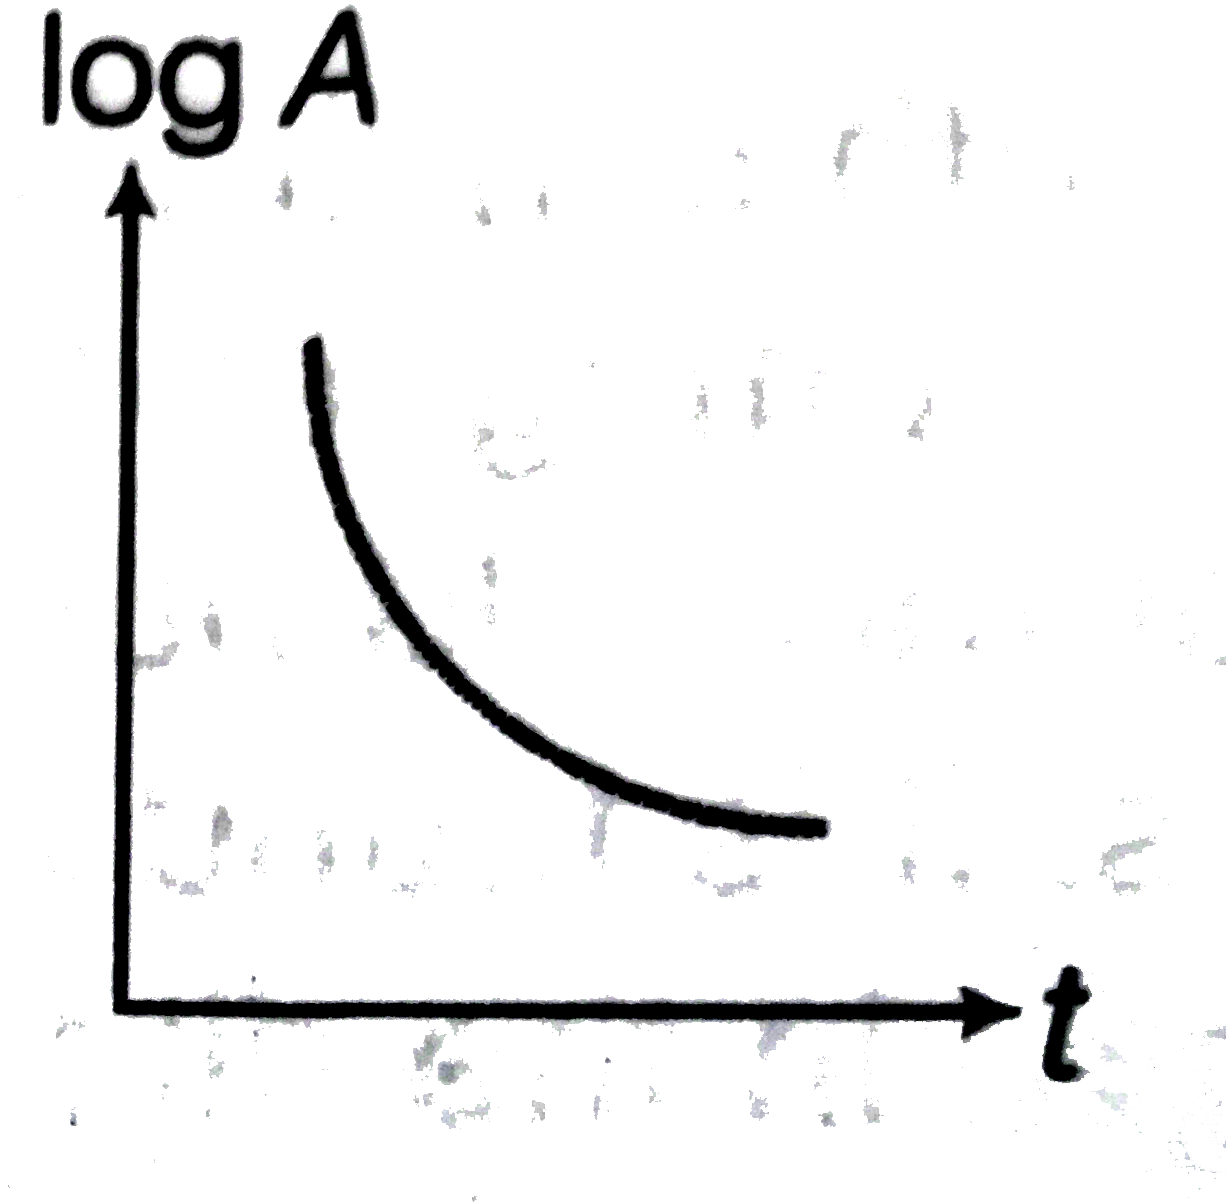
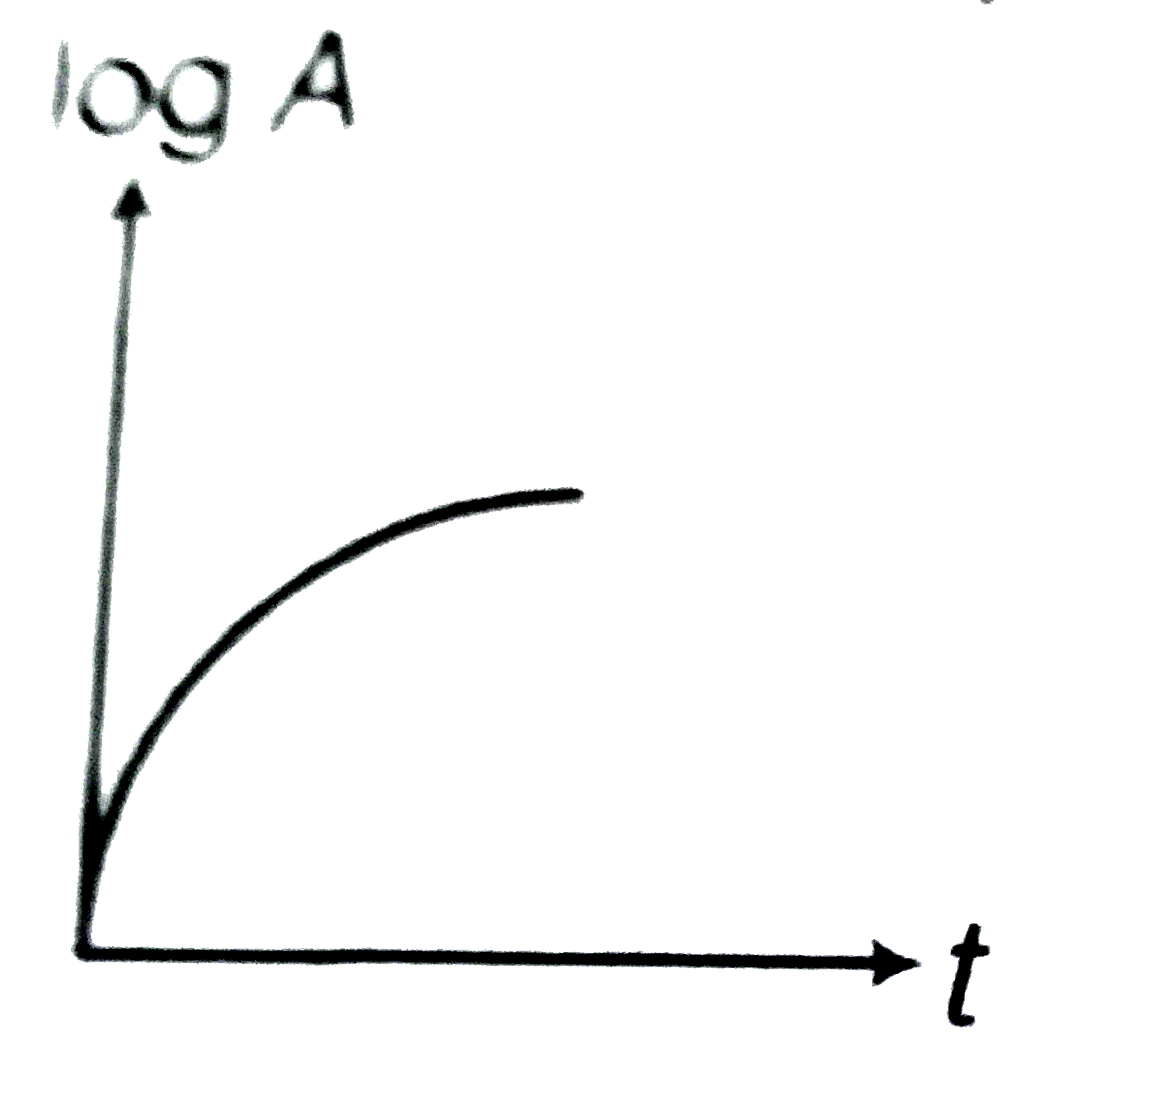
The correct Answer is:B
Step by step video, text & image solution for The graph obtained by plotting log_(e)(A) [A is the activity of a radioactive sample] against t (time) out of the following by Physics experts to help you in doubts & scoring excellent marks in Class 12 exams.
Topper's Solved these Questions
Similar Questions
Knowledge Check
- Question 1 - Select One
The activity of a radioactive sample is independent of
Athe mass number of the nucleusBthe mass of the sampleCthe number of atoms in the sampleDthe physical conditions - Question 2 - Select One
The curve between the activity A of a radioactive sample and the number of active atoms N is.
A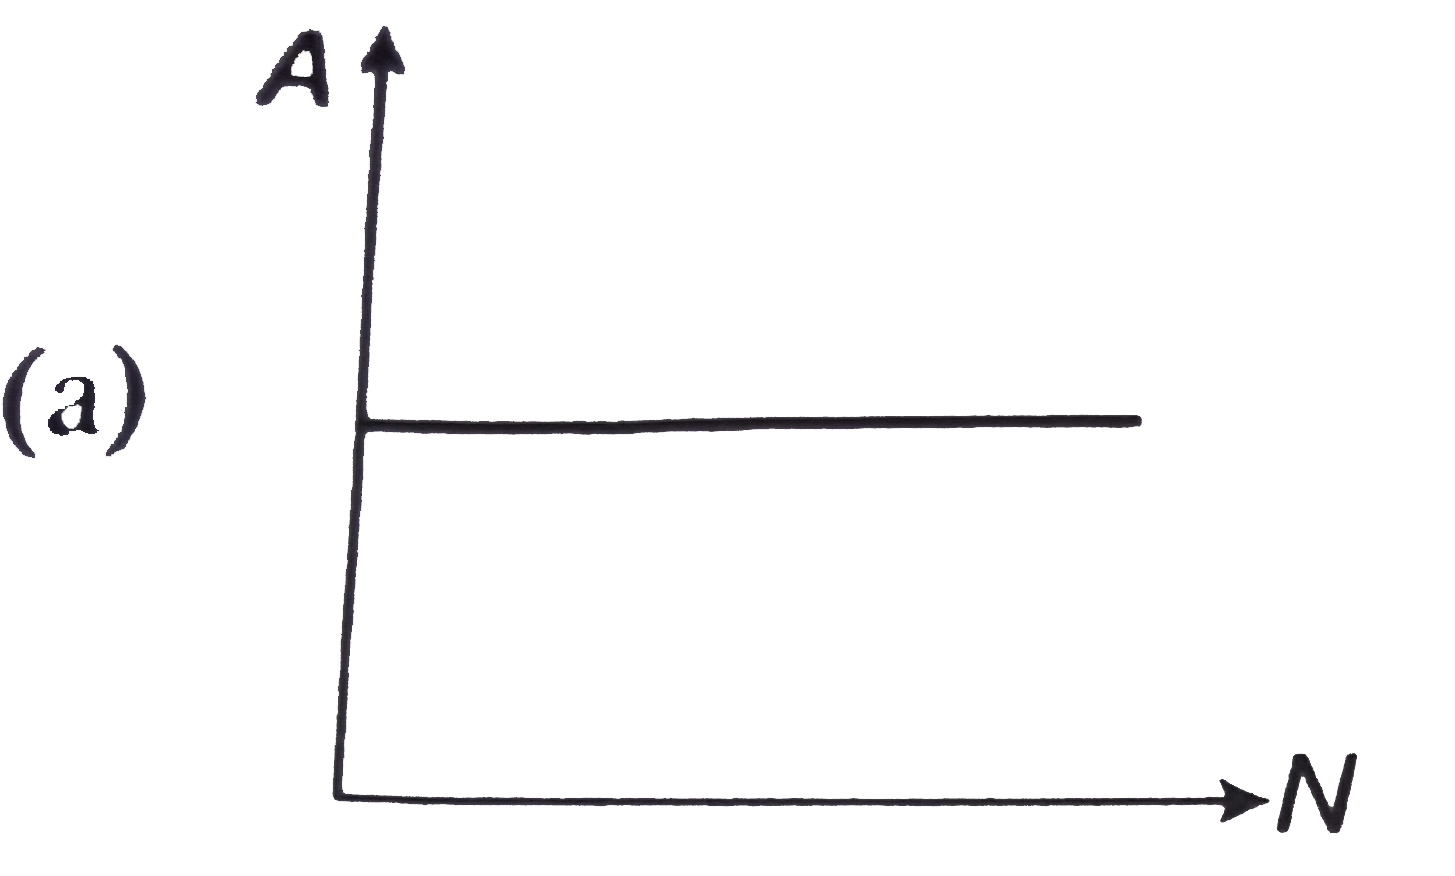 B
B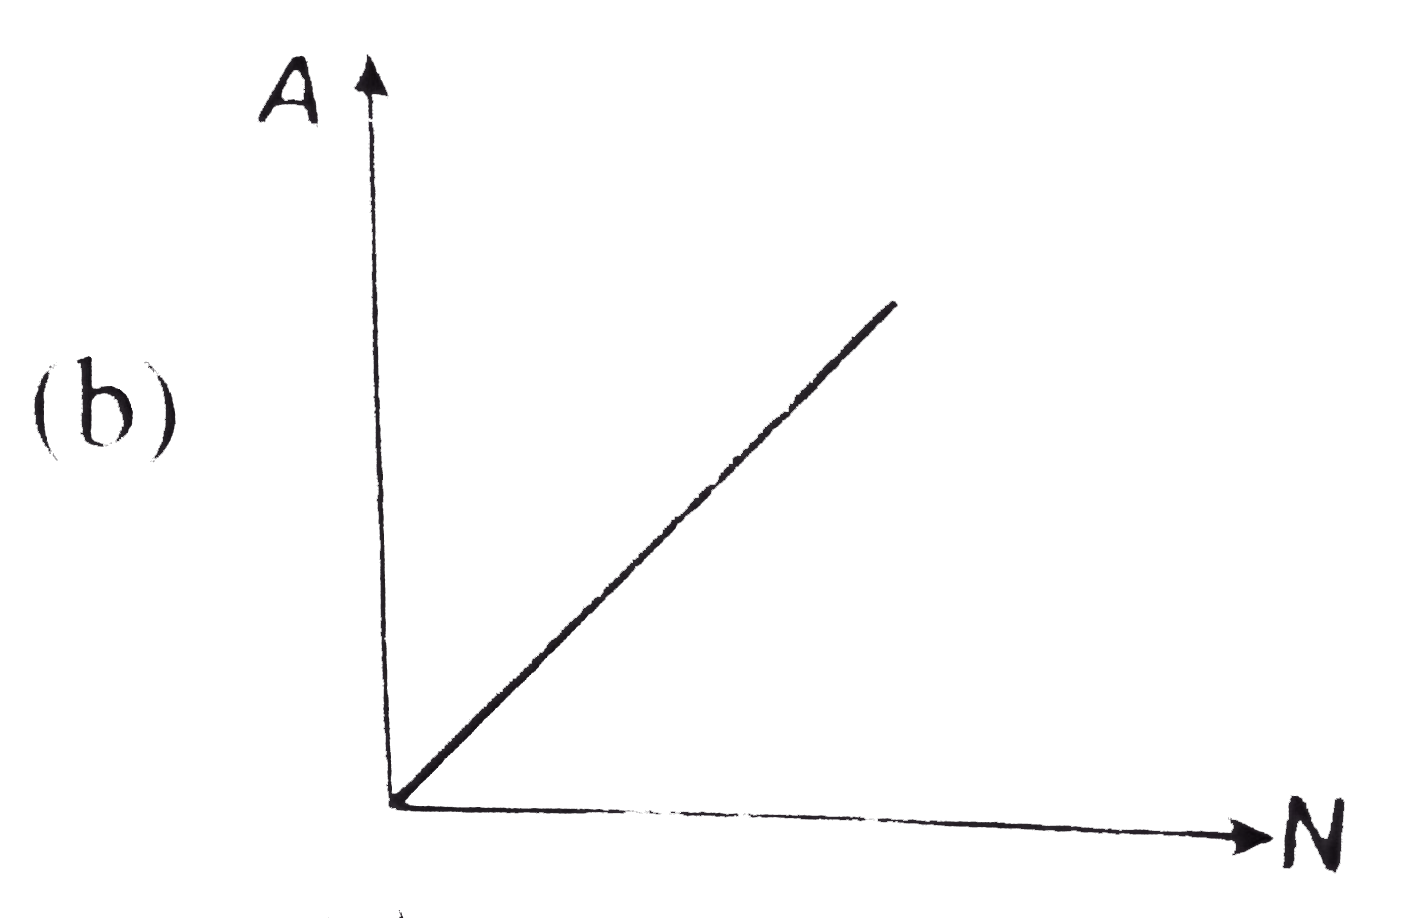 C
C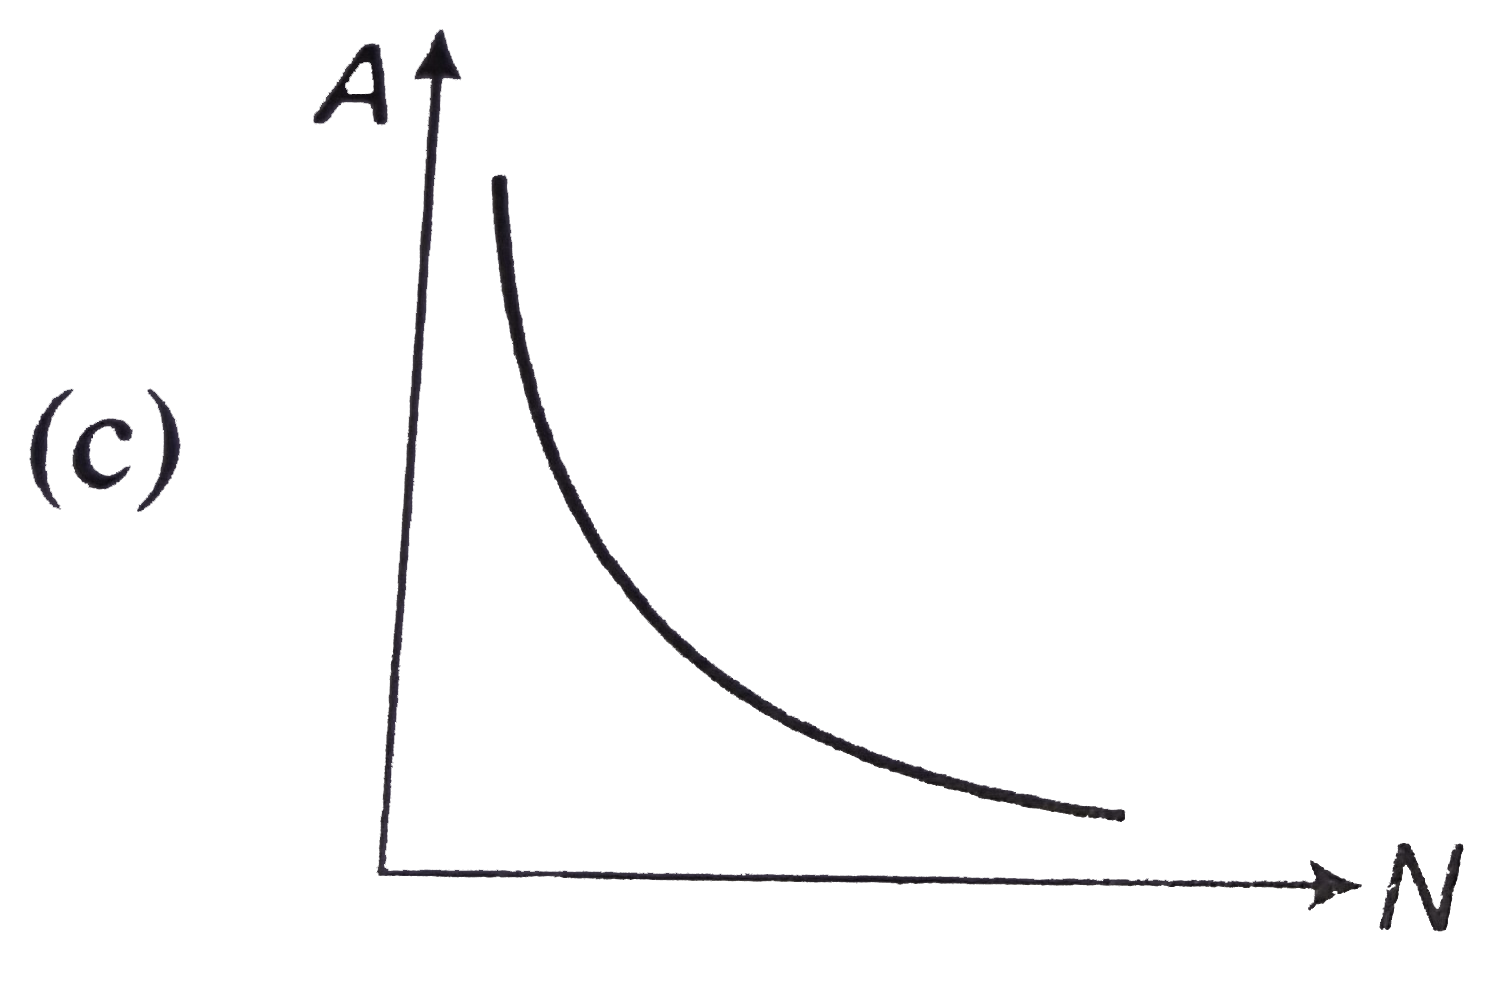 D
D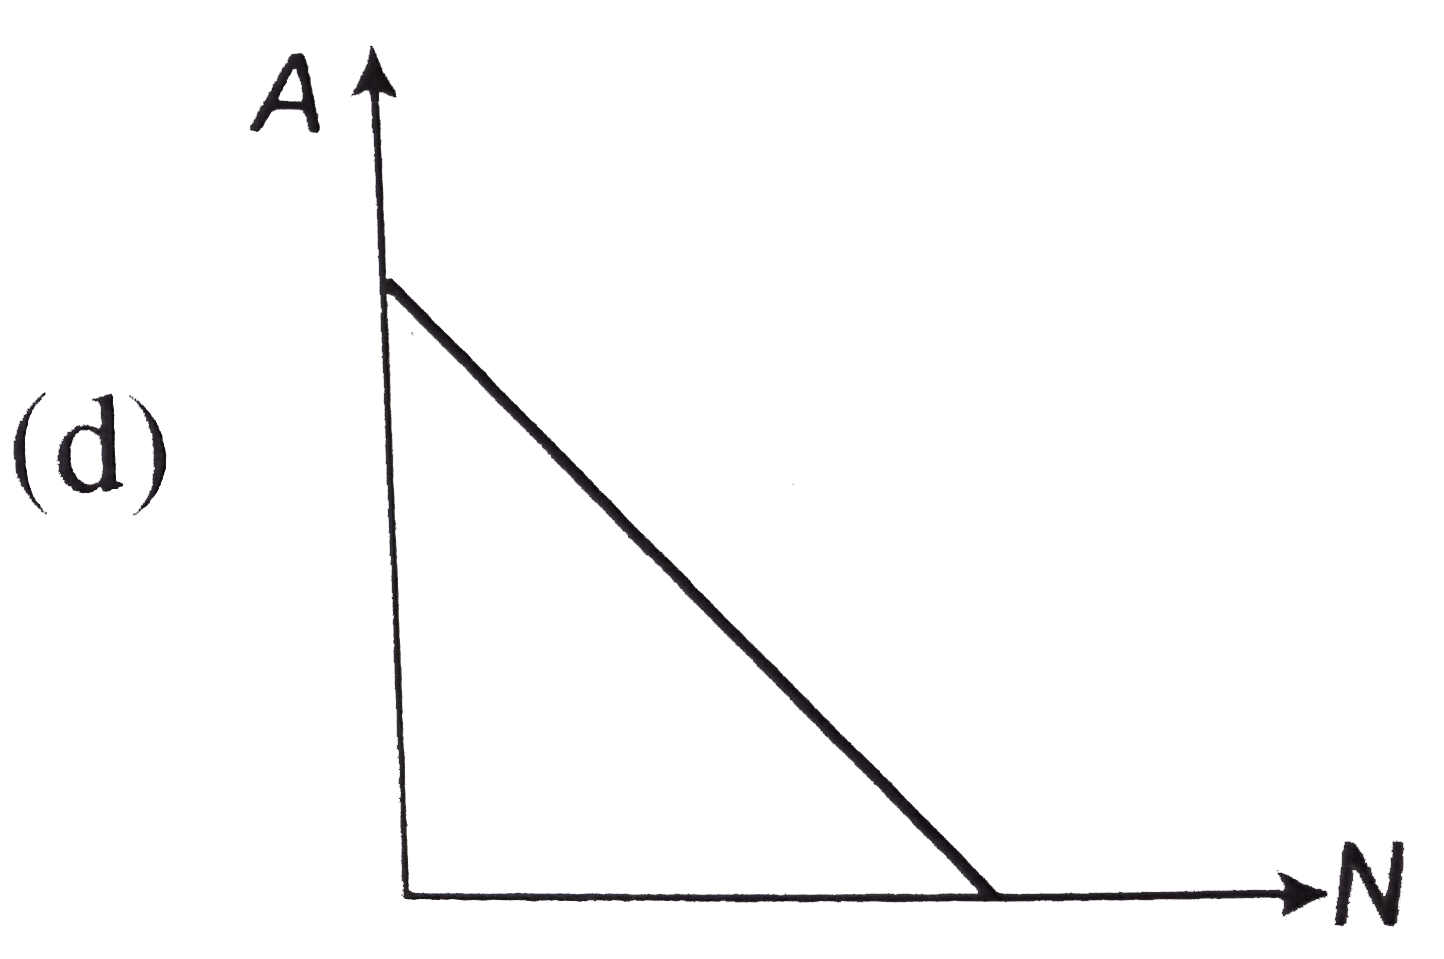
- Question 3 - Select One
The rate of decay (R) of nuclei in a radioactive sample is plotted against time (t). Which of the following best represents the resulting curve ?
A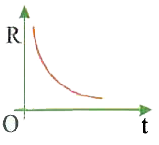 B
B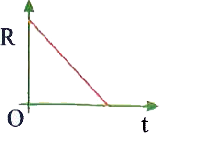 C
C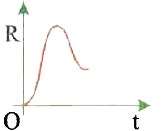 D
D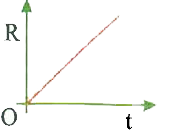
The figure shows the velocity (v) of a particle plotted against time (t).
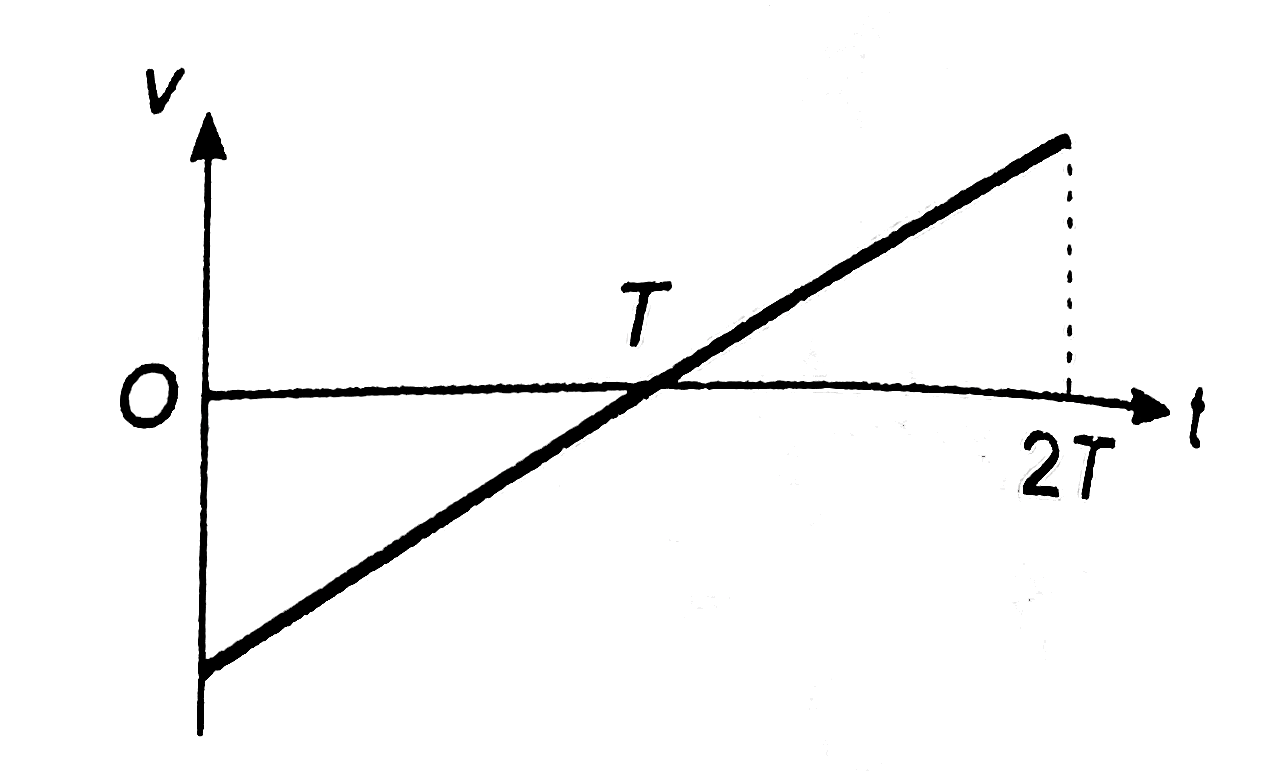 View Solution
The graph shows the log of activity (logR) of a radioactive material as a function of time t in minutes

The half -life (in minutes) for the decay is closest toView SolutionWhich of the following graphs represents the variation of activity (A) of a radioactive substance with time (t).
View SolutionIn Fig. X represents time and Y represent activity of a radioactive sample. Then the activity of sample, varies with time according to the curve
 View Solution
20% radioactive sample decay in time t. How much sample decay in time 2t ?
View Solution

