The population of active nuclei in a sample of radioactive isotope has been plotted with time in figure. Look at the graph carefully and find the value of t2−t1. It is given that t0=50 munite.
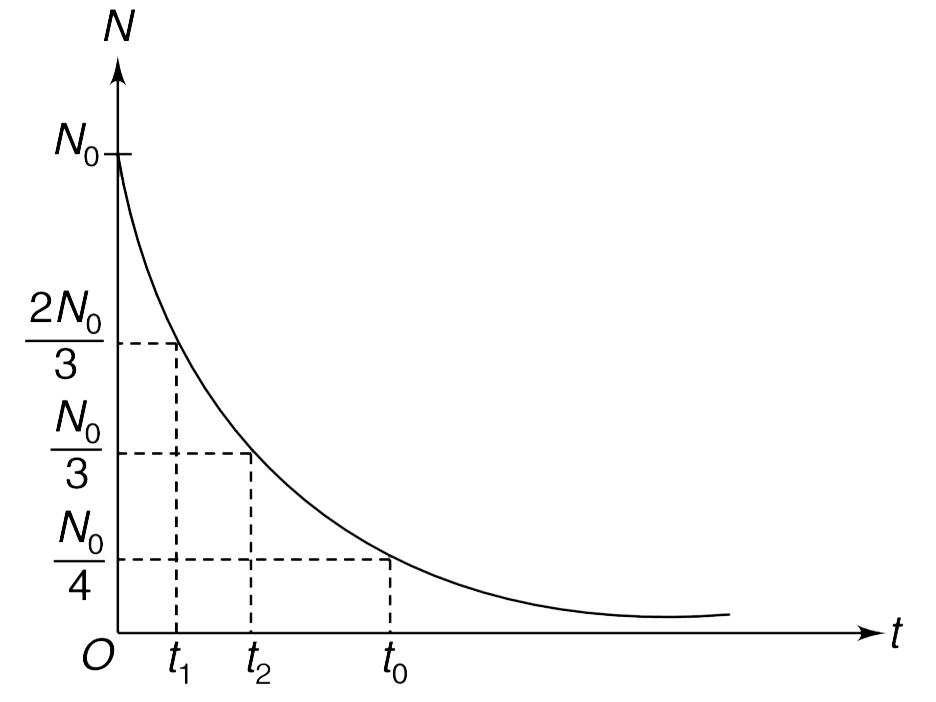
The correct Answer is:25min.
Step by step video, text & image solution for The population of active nuclei in a sample of radioactive isotope has been plotted with time in figure. Look at the graph carefully and find the value of t_(2)-t_(1). It is given that t_(0)=50 munite. by Physics experts to help you in doubts & scoring excellent marks in Class 12 exams.
Updated on:21/07/2023Topper's Solved these Questions
Similar Questions
Knowledge Check
The rate of decay (R) of nuclei in a radioactive sample is plotted against time (t). Which of the following best represents the resulting curve ?
A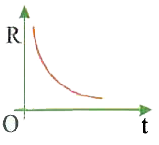 B
B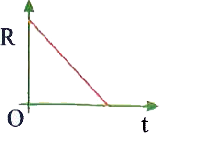 C
C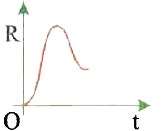 D
D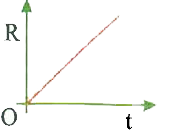
The rate of decay (R) of nuclei in a radioactive sample is plotted against time (t). Which of the following best represents the resulting curve ?
A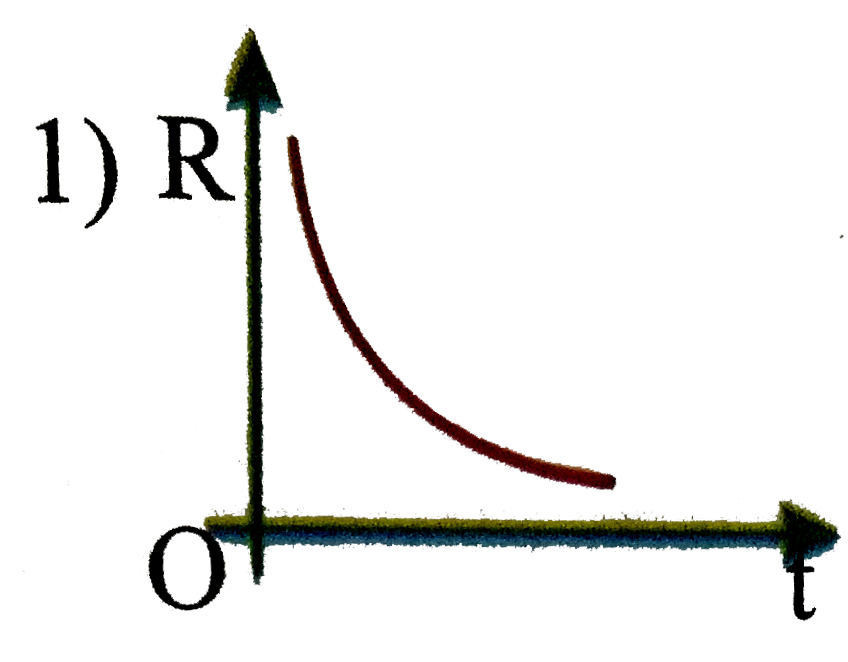 B
B C
C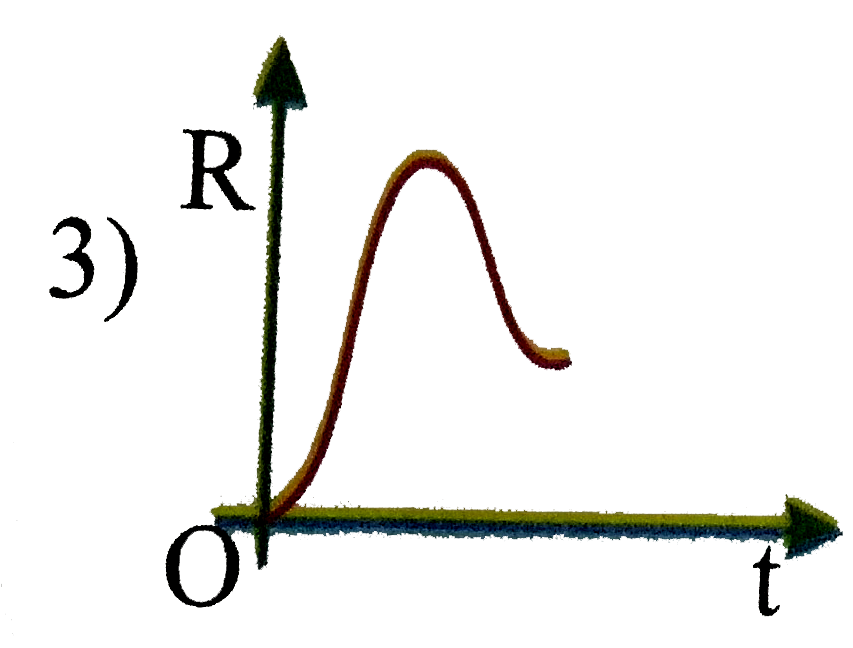 D
D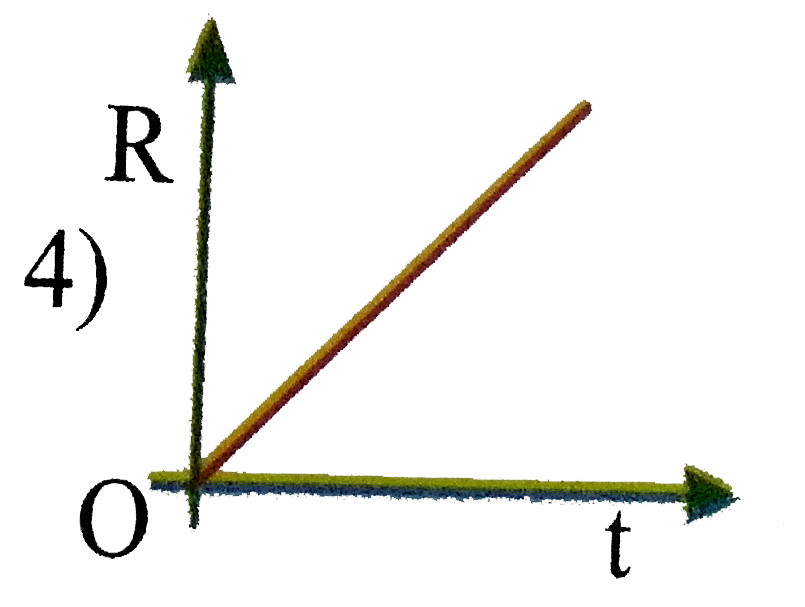
Figure is given a plot of the cooordinate of the body against time. From t1 to t2 the graph is a parabola.
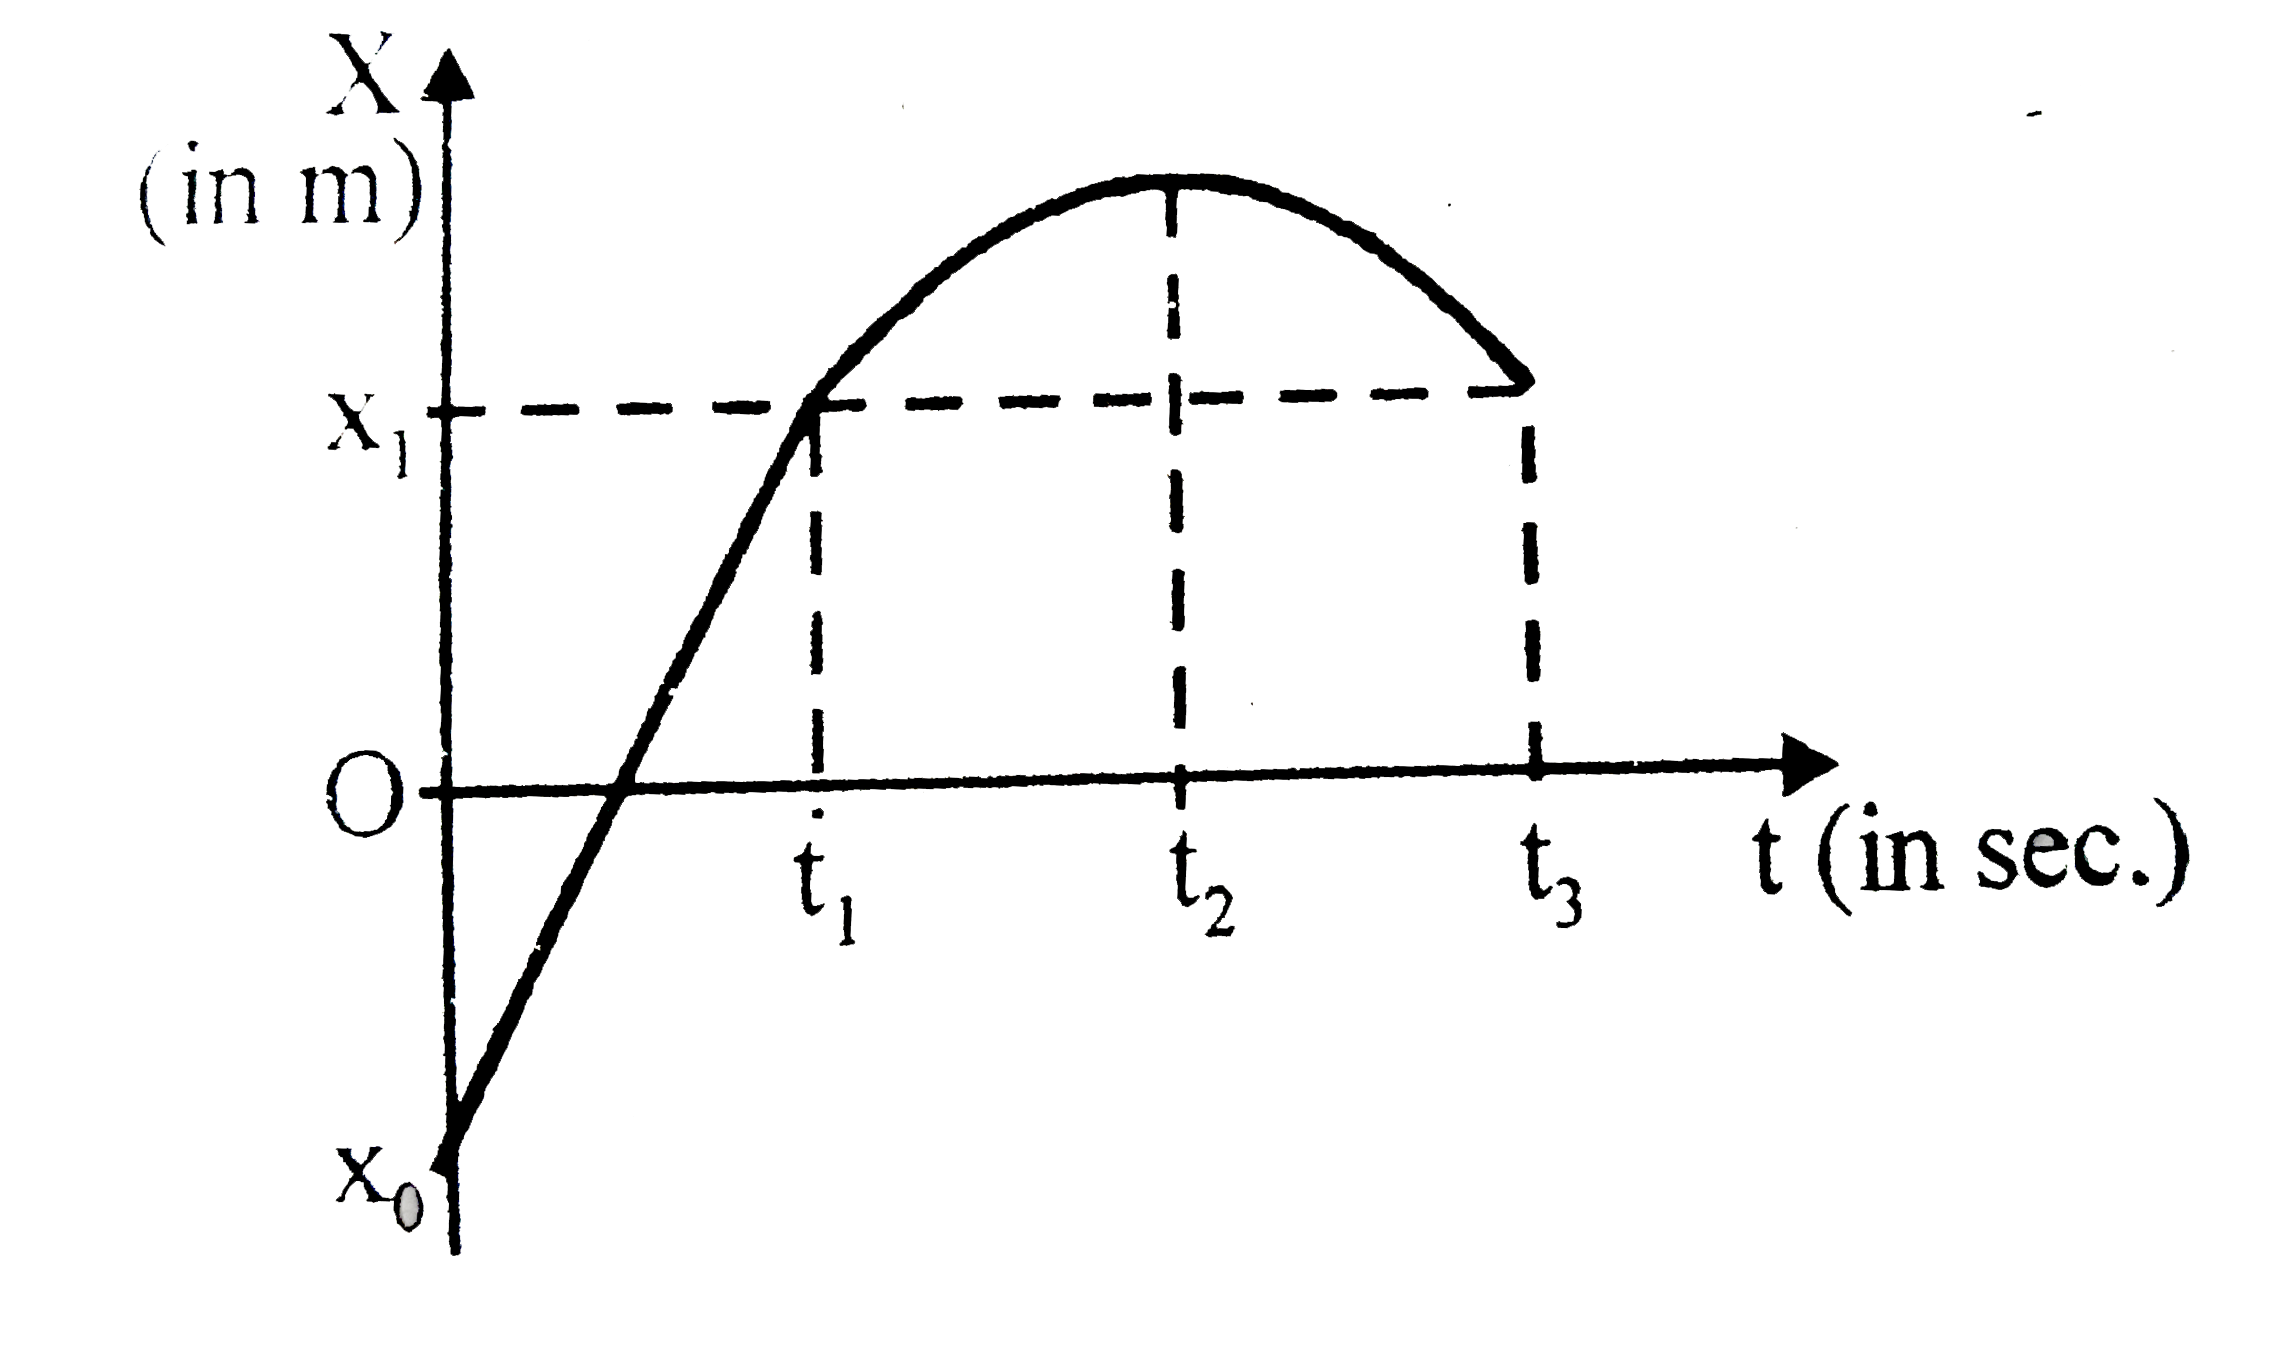 AThe acceleration from t1 to t3 is 2(x1−x0)t1(t3−t1)BThe initial velocity is x1−x0t1CThe maximum x coordinates is x1+(x1−x0)(t3−t1)t1DThe body is speeding up at all times.
Four thousand active nuclei of a radioactive material are present at t=0. After 60 minutes 500 active nuclei are left in the sample. The decay constant of the sample is
View SolutionLet T be the mean life of a radioactive sample. 75% of the active nuclei present in th sample initially will deacy in time
View SolutionThe activity of a sample of a radioactive meterial is A1 , at time t1 , and A2 at time t2(t2>t1) . If its mean life T, then
View Solution20% radioactive sample decay in time t. How much sample decay in time 2t ?
View SolutionThe graph obtained by plotting loge(A) [A is the activity of a radioactive sample] against t (time) out of the following
View Solution

