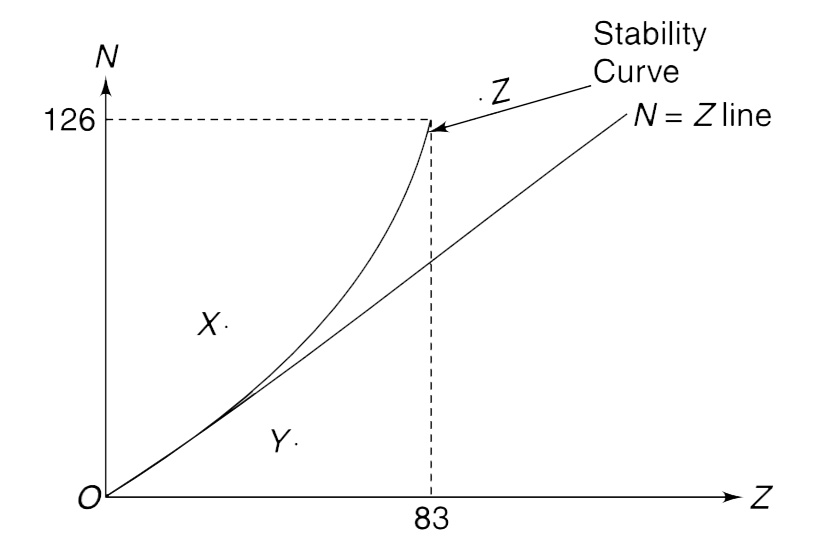
The figure shows a plot of number of neutron (N) versus number of protons (z) in all stable nuclei found in nature. What kind of decay are nuclei X,Y and Z expected to show?

The correct Answer is:X→ negative β decay Y→ positron emission Z→ alpha decay
Step by step video, text & image solution for The figure shows a plot of number of neutron (N) versus number of protons (z) in all stable nuclei found in nature. What kind of decay are nuclei X,Y and Z expected to show? by Physics experts to help you in doubts & scoring excellent marks in Class 12 exams.
Updated on:21/07/2023Topper's Solved these Questions
Similar Questions
The atoms of two element A and B contain the same number of protons but different number of neutrons in their nuclei. What kind of element are A and B?
View SolutionStaements I: Light nuclei are most stable if N =Z, while heavy nuclei are more stable if N gtZ. (N→ number of neutrons, Z→ number of protons)
Staements II: As the number of protons increases in a nucleus, the Coulomb's repulsive forece increases, which tends to break the nucleus apart. So, to keep the nucleus apart. So, to keep the nucleus stable, more number of neutrons are needed which are neutral in nature.
View Solution
Knowledge Check
A plot of the number of neutrons (n) against the number of protons (p) of stable nuclei exhibits upward deviation from linearity for atomic number, Z>20. For an unstable nucleus having n/p ratio less than 1, the possible mode (s) of decay is (are)
Aβ−− decay (β emission)BOrbital or K-electron captureCNeutron emissionDβ+− decay (positron emission)A plot of the number of neutrons (n) against the number of protons (p) of stable nuclei exhibits upward deviation from linearity for atomic number, Z>20. For an unstable nucleus having n/p ratio less than 1, the possible mode (s) of decay is (are)
Aβ− -decay (β-emission)Borbital and K-electron captureCneutron emissionDβ+ -decay (positron emission)A plot of the number of neutrons (n) against the number of protons (p) of stable nuclei exhibits upward deviation from linearity for atomic number, Z > 20. For an unstable nucleus having n, p ratio less than 1, the possible mode(s) of decay is(are)
Aβ−-decay (βemission)Borbital or K- electron captureCneutron emissionDβ+-decay (positron emission).
A plot of the number of neutrons (n) against the number of protons (p) of stable nuclei exhibits upward deviation from linearity for atomic number, Z>20. For an unstable nucleus having n/p ratio less than 1, the possible mode (s) of decay is (are)
View SolutionStatement : The plot of atomic number ( y -axis ) versus number of neutrons ( x -axis ) for stable nuclei shows a curvature towards x-axis fron the line of 45∘ slope as the atomic number is increased .
Explanation : proton -proton electrostatic repulsions begin to overcome attracive forces involving protons and neutrons in heavier nuclides.
View SolutionStatement-1: Th plot of atomic number (y-axis) versus number of neutrons (x-axis) for stable nuclei shows a curvature towards x-axis from the line of 45∘C slope as the atomic number is increased.
Statement-2: Proton-proton electrostatic repulsions begin to overcome attractive forces involving protons and neutrons in heavier nuclides.
View SolutionStatement : The plot of atomic number ( y -axis ) versus number of neutrons ( x -axis ) for stable nuclei shows a curvature towards x-axis fron the line of 45∘ slope as the atomic number is increased .
Explanation : proton -proton electrostatic repulsions begin to overcome attracive forces involving protons and neutrons in heavier nuclides.
View Solution

