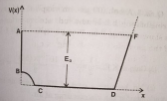
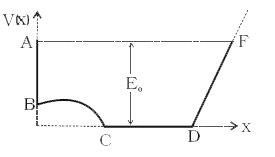
A graph of potential energy V (x) versus x is shwon in figure. A particle of energy E0 is executing motion in it. Draw graph of velocity and kinetic energy versus x for one complete cycle AFA.
 Solution in Punjabi
Step by step video & image solution for A graph of potential energy V (x) versus x is shwon in figure. A particle of energy E_0 is executing motion in it. Draw graph of velocity and kinetic energy versus x for one complete cycle AFA. by Physics experts to help you in doubts & scoring excellent marks in Class 11 exams.
Updated on:21/07/2023Topper's Solved these Questions
Similar Questions
Can mechanical waves travel through vacuum?
View SolutionA graph of potential energy V(x) verses x is shown in figure. A particle of energy E_(0) is executing motion in it. Draw graph of velocity and kinetic energy versus x for one complete cycle AFA.
View SolutionAssertion : Graph between potential energy of a spring versus the extension / compression (x) of the string is a straight ling.
Reason : This is because potential energy is directly proportional to x.
View SolutionThe kinetic energy (KE) versus time graph for a particle moving along a straight line is as shown in the figure. The force versus time graph for the particle may be

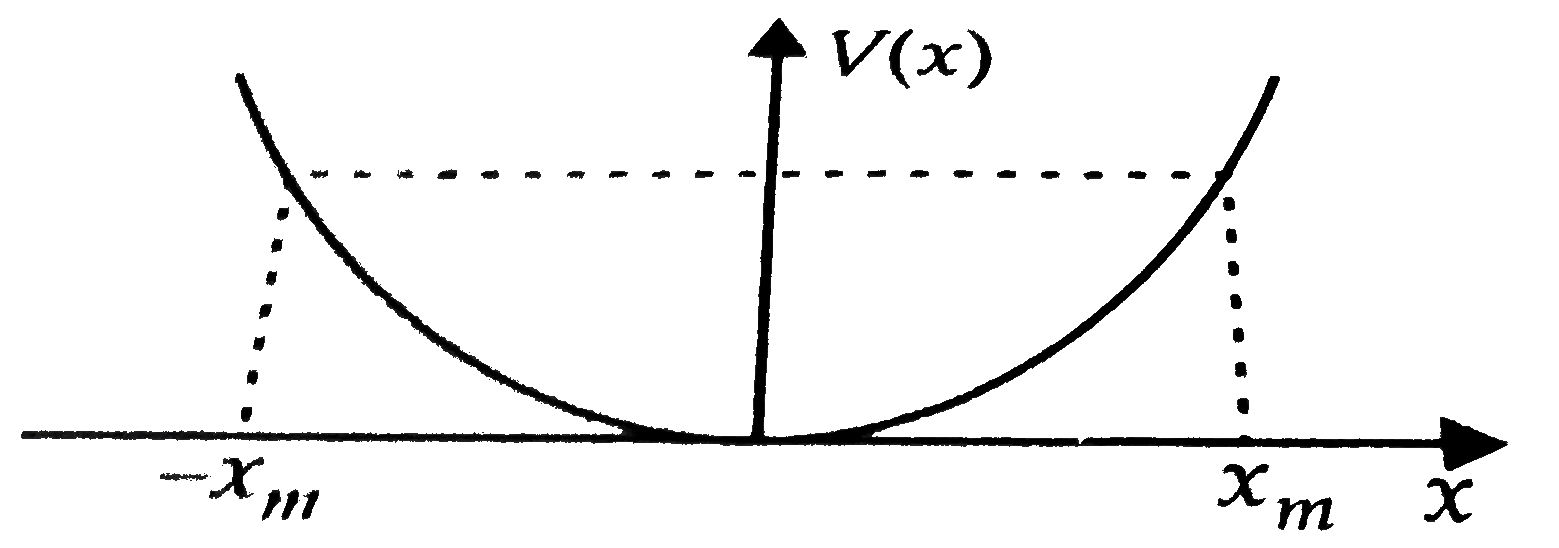
View SolutionThe potential energy function for a particle executing linear SHM is given by V(x)=12kx2 where k is the force constant of the oscillator. For k=0.5Nm−1, the graph of V(x) versus x is shown in the figure A particle of total energy E turns back when it reaches x=±xm.if V and K indicate the potential energy and kinetic energy respectively of the particle at x=+xm,then which of the following is correct?
View SolutionThe potential energy ‘V’ of a particle moving along the positive x-direction in a conservative force field varies as shown in the figure. The total energy is E=2. Draw the corresponding kinetic energy K vs x graph.
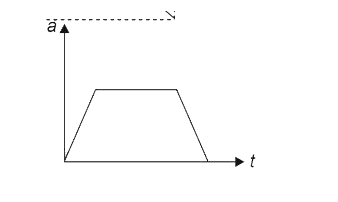
View SolutionAcceleration versus time graph of a particle moving in a straight line is as shown in adjoining figure. If initially particle was at rest. Then corresponding kinetic energy versus time graph will be :
View SolutionA particle moves along x-axis whose potential energy versus x-coordinate graph is shown in the given figure. At x = 0, the particle is released form rest. Two potential wells A and B are shown in the figure. Then,
View SolutionThe slope of potential energy versus position graph represents
View SolutionExplain and draw the graphs of kinetic energy, potential energy and mechanical energy versus displacement for SHM.
View SolutionDraw a plots of mechanical energy , potential energy and kinetic versus dispalcement for different position of a motion of block attached to a spring .
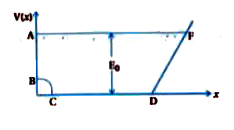
View SolutionA graph of potential energy V(x) verses x is shown in figure .A particle of energy E0 is executing motion in it . Draw graph of velocity and kinetic energy verses x for one complete cycle AFA.
View SolutionThe potential energy function for a particle executing linear SHM is given by V(x)=12kx2 where k is the force constant of the oscillator. For k=0.5Nm−1, the graph of V(x) versus x is shown in the figure A particle of total energy E turns back when it reaches x=±xm.if V and K indicate the potential energy and kinetic energy respectively of the particle at x=+xm,then which of the following is correct?

View SolutionFigure shows the graph of velocity versus displacement of a particle executing simple harmonic motion. Find the period of oscillation of the particle
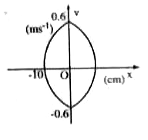
View Solutionस्थितिज ऊर्जा V (x) और दूरी x के बीच ग्राफ चित्र में दर्शाया गया है। यहाँ E0 ऊर्जा का एक कण गति कर रहा है। एक पूर्ण चक्र AFA के संगत वेग एवं दूरी तथा गतिज ऊर्जा एवं दूरी के बीच ग्राफ खींचिए।
View SolutionThe kinetic energy (KE) versus time graph for a particle moving along a straight line is as shown in the figure. The force versus time graph for the particle may be
View Solution
