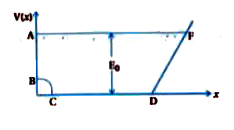
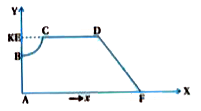
A graph of potential energy V(x) verses x is shown in figure .A particle of energy is executing motion in it . Draw graph of velocity and kinetic energy verses x for one complete cycle AFA.
 Solution in Gujrati
We know that
Total
at A , x = 0 ,V(x) =
at B ,
(Maximum)
K=0
At F,
the variation is as below ,

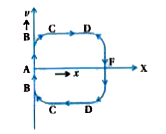
Velocity versus x graph :
As
At A and F , where KE = 0 , v = 0
At C and d , KE is maximum .Therefore , v is max .
At B . KE is positive but not maximum .
Therefore , v is some value ( max)
The variation is shown in the diagram .

Topper's Solved these Questions
- BOOK - KUMAR PRAKASHANCHAPTER - WORK, ENERGY AND POWER EXERCISE - SECTION - D NCERT Exemplar Solutions (Long Answer Type Questions)5videos
WORK, ENERGY AND POWER
- BOOK - KUMAR PRAKASHANCHAPTER - WORK, ENERGY AND POWER EXERCISE - SECTION - E Multiple Choice Questions (MCQs)64videos
WORK, ENERGY AND POWER
- BOOK - KUMAR PRAKASHANCHAPTER - WORK, ENERGY AND POWER EXERCISE - SECTION - D NCERT Exemplar Solutions (Very Short Answer Type Questions)12videos
WORK, ENERGY AND POWER
- BOOK - KUMAR PRAKASHANCHAPTER - WAVESEXERCISE - SECTION-F (Questions From Module) (Sample questions for preparation of competitive exams)23videos
WAVES
Similar Questions
A block of mass 1 kg is pushed up a surface inclined to horizontal at an angle of 30∘ by a force of 10 N parallel to the inclined surface (figure) . The coefficient of friction between block and the incline is 0.1 .If the block is pushed up by 10 m along teh inclined calculate

(a) work done against gravity
(b) work done against force of friction
(c ) increases in potential energy
(d) increases in kinetic energy
(e) work done by applied force06:43View SolutionThe potential energy of 1 kg particle , free to move allong is given by U(x)=(x33−x22)I. if its mechanical energy is 2J . Its maximum speed is …… ms−1
02:38View SolutionA through inclined is placed on car moving with a constant velocity u on horizontal ground . A block of mass M rests on the inclined plane . Is any work done by force of friction then a dissipation of energy ?
01:55View SolutionIn a standing wave formed by two atoms separated by 1.21Å, there are 3 nodes and 2 antinodes. Find its wavelength.
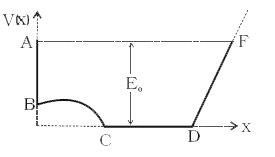
01:50View SolutionA graph of potential energy V(x) verses x is shown in figure. A particle of energy E_(0) is executing motion in it. Draw graph of velocity and kinetic energy versus x for one complete cycle AFA.
04:22View SolutionThe figure below shows a graph of potential energy U(s) verses position x for a particle executing on edimensional motion along the x axis. The total mechanical energy of the system is indicated by the dashed line. At t=0 the particle is somewhere between points A and G. For later times choose the correct statement:-
08:32View SolutionA particle with the potentila energy shown in the graph is moving to the right. It has 1.0J of kinetic energy at x=1.0m. Where the particle reverses its direction of motion?
 05:57View Solution
The potential energy U(x) of a particle moving along x- axis is shown in figure. Which one of the following graphs represents the variation of kinetic energy of this particel if its total mechanical enery is E_(0)
02:05View SolutionThe potential energy ‘V’ of a particle moving along the positive x-direction in a conservative force field varies as shown in the figure. The total energy is E=2. Draw the corresponding kinetic energy K vs x graph.
11:27View SolutionDraw the graph between displacement and kinetic energy for a particle executing SHM.
02:03View SolutionDraw the graph between displacement and potential energy for a particle executing SHM.
07:28View Solutionkinetic energy E_(k) And the graph between velocity V is -
03:52View Solutionस्थितिज ऊर्जा V (x) और दूरी x के बीच ग्राफ चित्र में दर्शाया गया है। यहाँ E0 ऊर्जा का एक कण गति कर रहा है। एक पूर्ण चक्र AFA के संगत वेग एवं दूरी तथा गतिज ऊर्जा एवं दूरी के बीच ग्राफ खींचिए।
 06:55View Solution
In the graph of kinetic energy verses frequency, the intercept gives
05:05View SolutionPlot graphs showing the variation of kinetic energy, potential energy and total mechanical energy of a particle executing S.H.M with its displacement.
03:23View Solution
