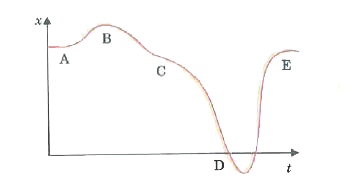
A graph of x versus t is shown in fig. choose corredt alternatives from below.
 Solution in Punjabi
The particle was released from rest at t = 0
At B, the acceleration a gt 0
At C, the fvelocity and the acceleration vanish , Average velocity for the motion between A and D is positive
The speed at D exceeds that at E.
Step by step video & image solution for A graph of x versus t is shown in fig. choose corredt alternatives from below. by Physics experts to help you in doubts & scoring excellent marks in Class 11 exams.
Updated on:21/07/2023Topper's Solved these Questions
- MOTION IN A STRAIGHT LINEBOOK - MBDCHAPTER - MOTION IN A STRAIGHT LINEEXERCISE - EXERCISE
14 Videos
- MOTION IN A PLANEBOOK - MBDCHAPTER - MOTION IN A PLANEEXERCISE - EXERCISE
17 Videos
- MOTION OF SYSTEM OF PARTICLES AND RIGID BODYBOOK - MBDCHAPTER - MOTION OF SYSTEM OF PARTICLES AND RIGID BODYEXERCISE - EXERCISE
15 Videos
Similar Questions
In which of the following examples of motion, can the body be considered approximately a point object:
View SolutionIs it necessary to mention the direction of a vector having zero magnitude?
View SolutionDefine centre of mass.
View SolutionPressure versus temperature graph of an ideal gas of equal number of moles of different volumes is plotted as shown in Fig. Choose the correct alternative.
View SolutionPressure versus temperature graph of an ideal gas as shown in Fig. Corresponding density (rho) versus volume (V) graph will be
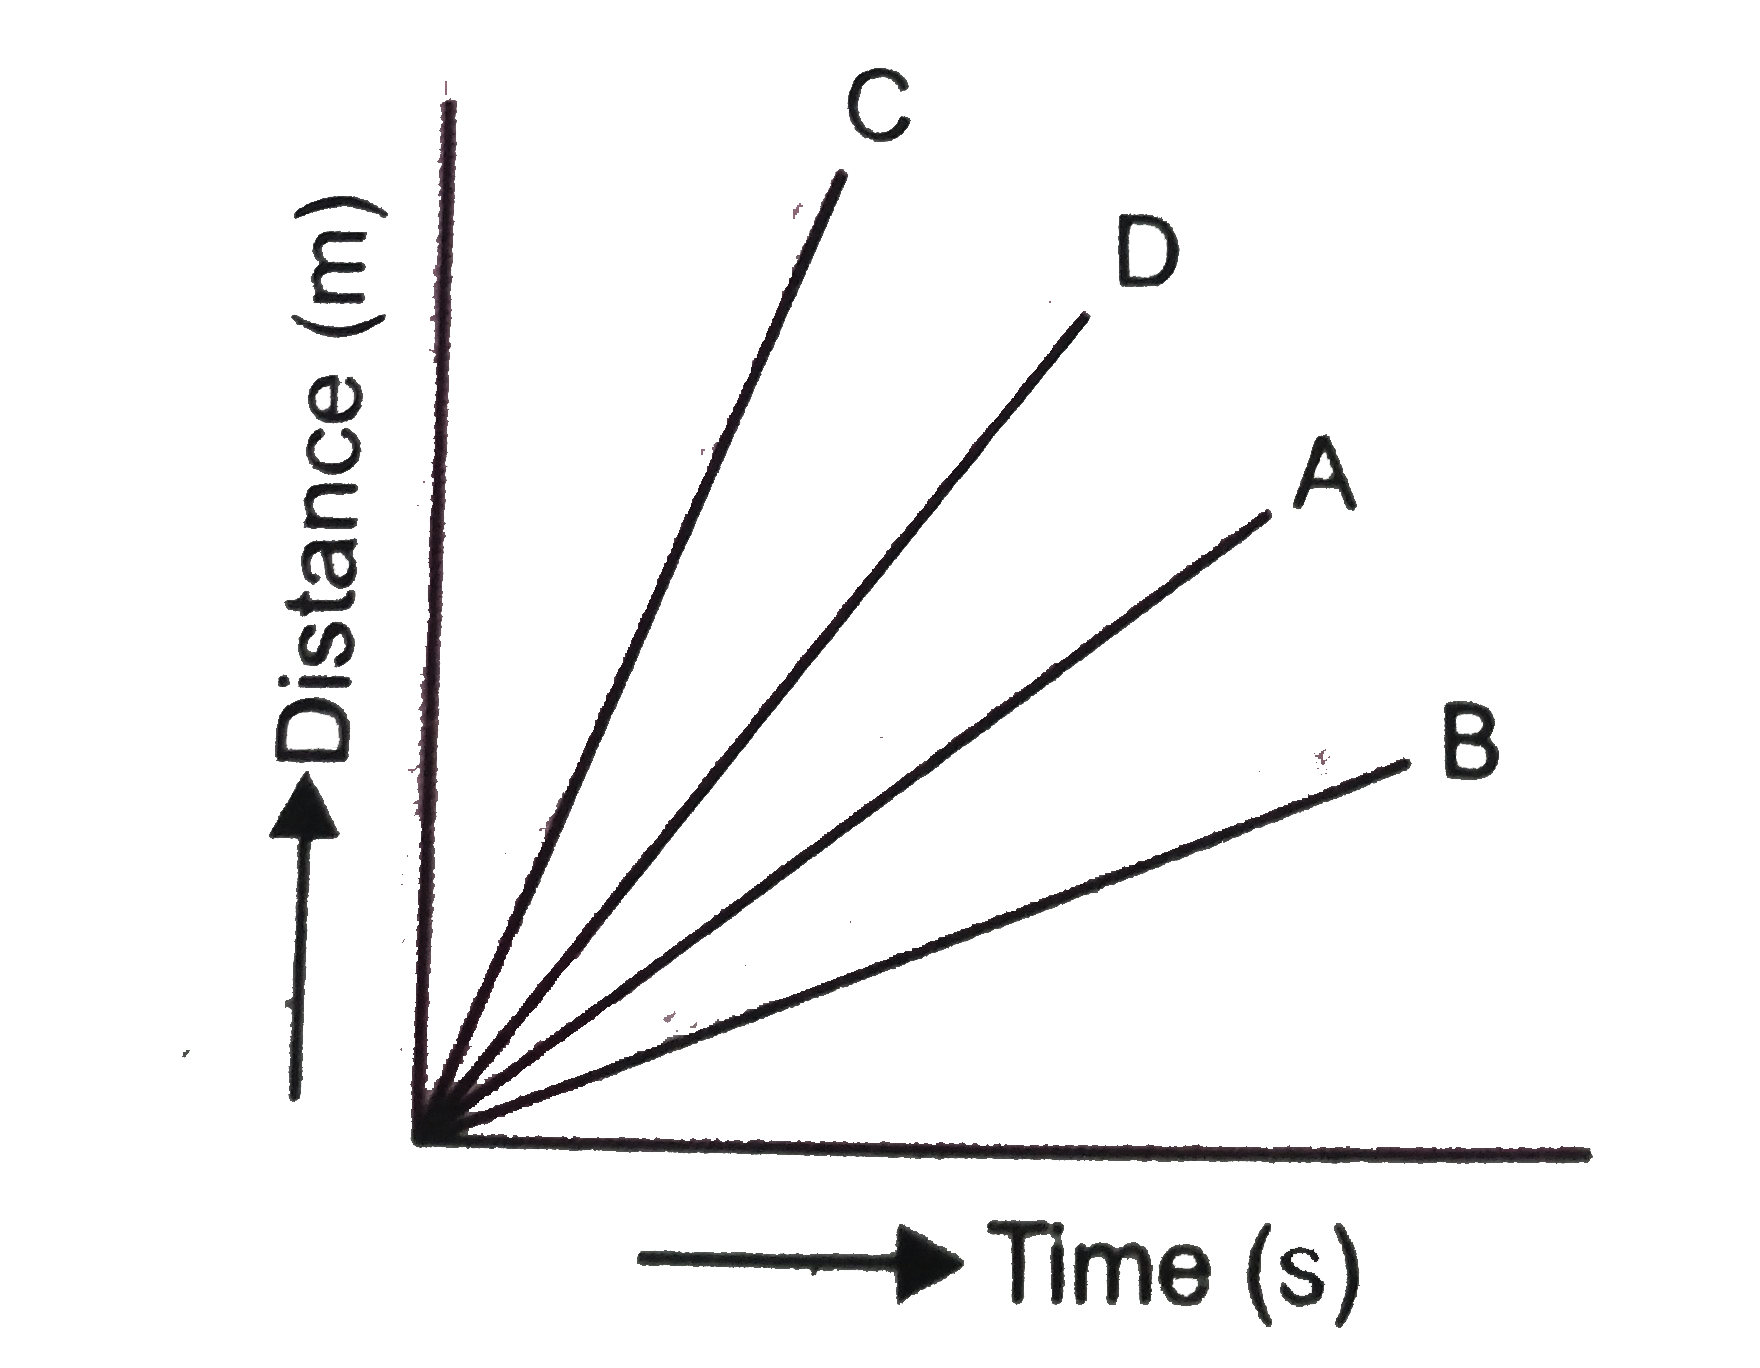
View SolutionFour cars A,B and C are moving on a levelled road. Their distance versus time graphs are shown in Fig. Choose the correct statement
View SolutionA graph of x versus t is shown in figure. Choose correct alternative from below.
View SolutionPV versus T graph of equal masses of H_(2) , He and CO_(2) is shown in figure. Choose the correct alternative?
View SolutionPV versus T graph of equal masses of H_(2) , He and O_(2) is shown in Figure choose the correct alternative.
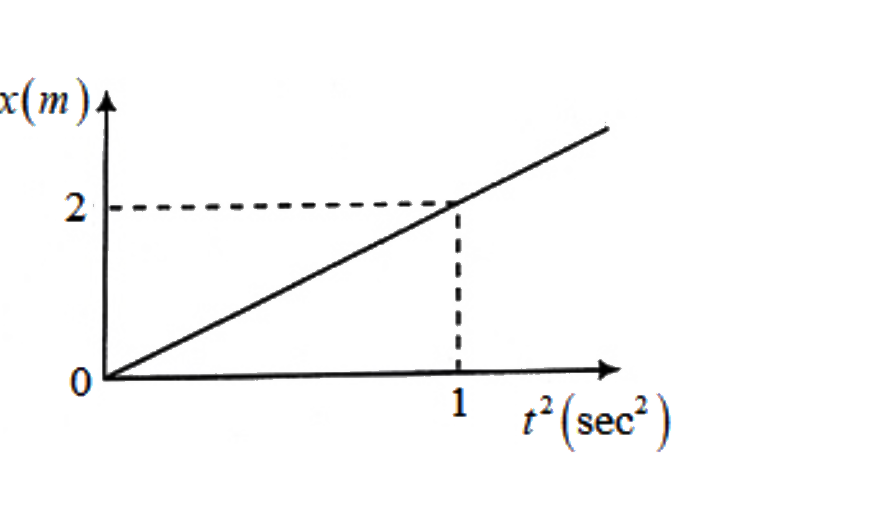
View SolutionDisplacement x versus t2 graph is shown for a particle. The acceleration of particle is
View SolutionPosition (x) versus time (t) graph of a particle is as shown. The velocity is zero at?
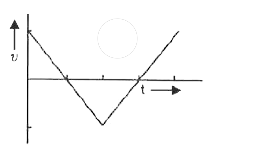
View SolutionThe graph shown in Fig. shows the velocity v tk versus time for a body, Which of the graphs shown below represents the corresponding accelera-tion versus time graphs ?
View SolutionA graph of x verus t is shown in the figure given below. Choose correct alternatives from below.
View SolutionA graph of x versus t is shown in figure. Choose correct alternatives given below.
View Solution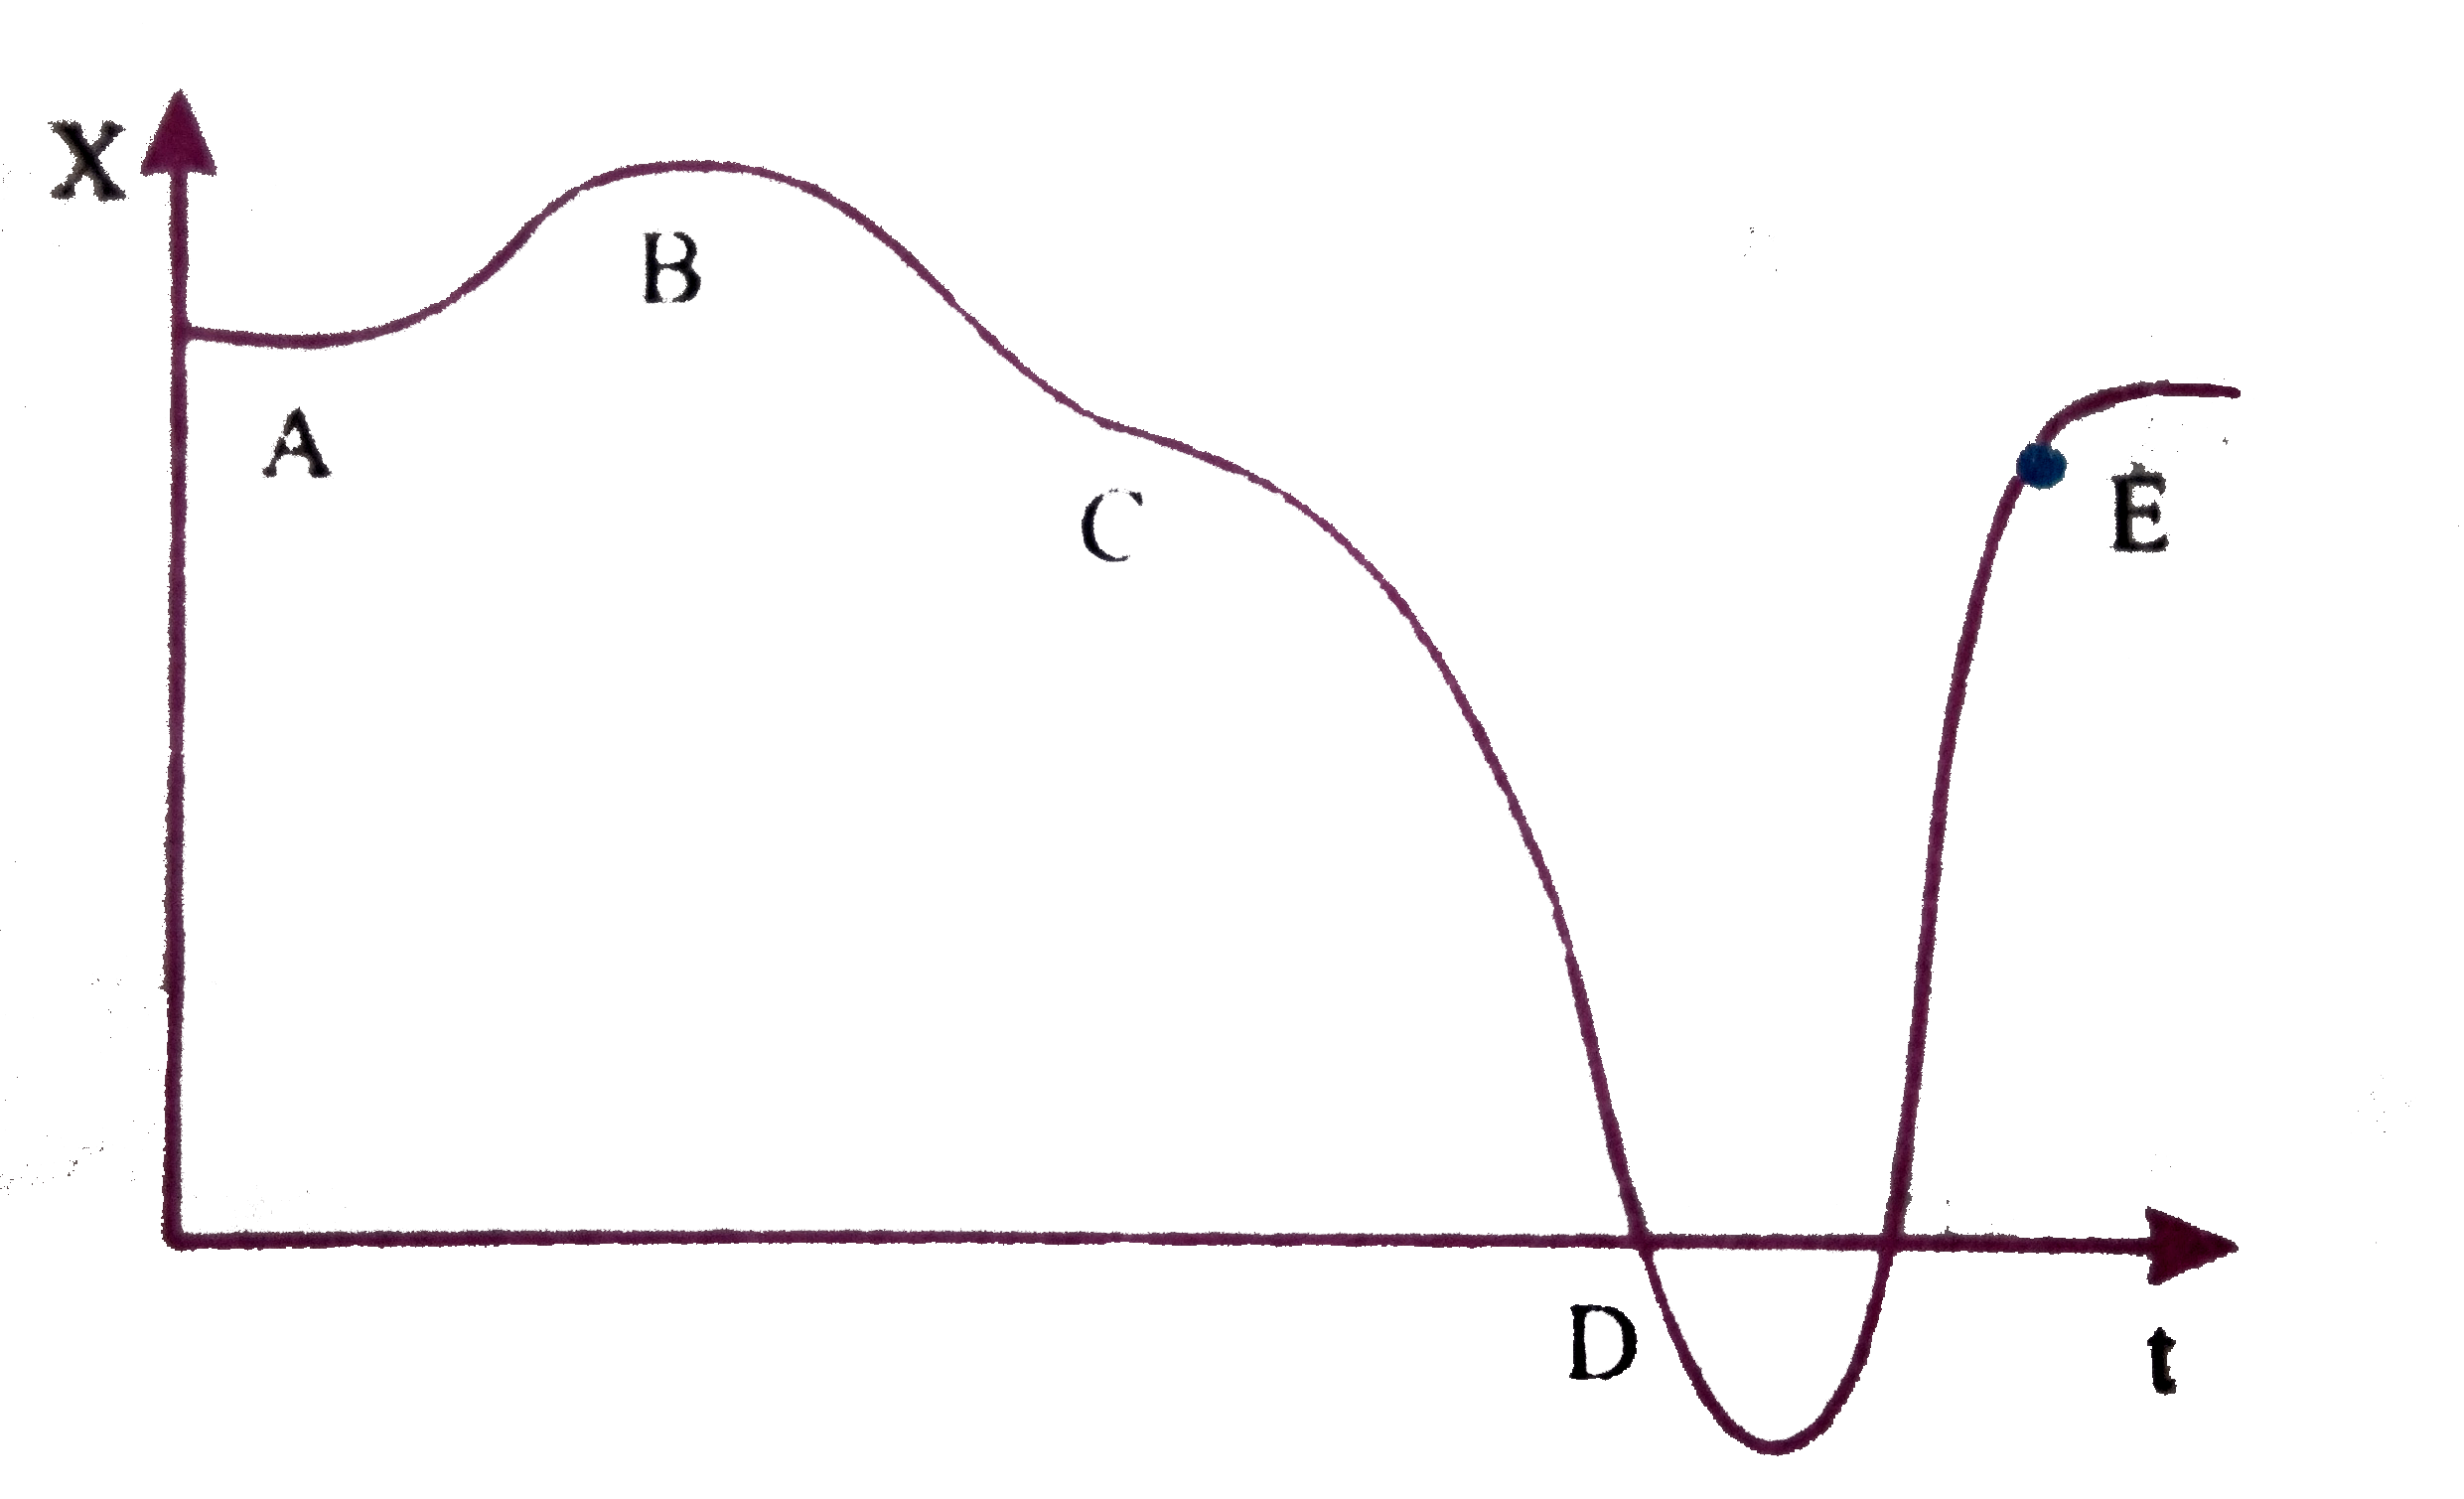
A graph of x versus t is shown in figure. Choose correct alternative from below.
View SolutionFour cars A,B and C are moving on a levelled road. Their distance versus time graphs are shown in Fig. Choose the correct statement

View Solution
