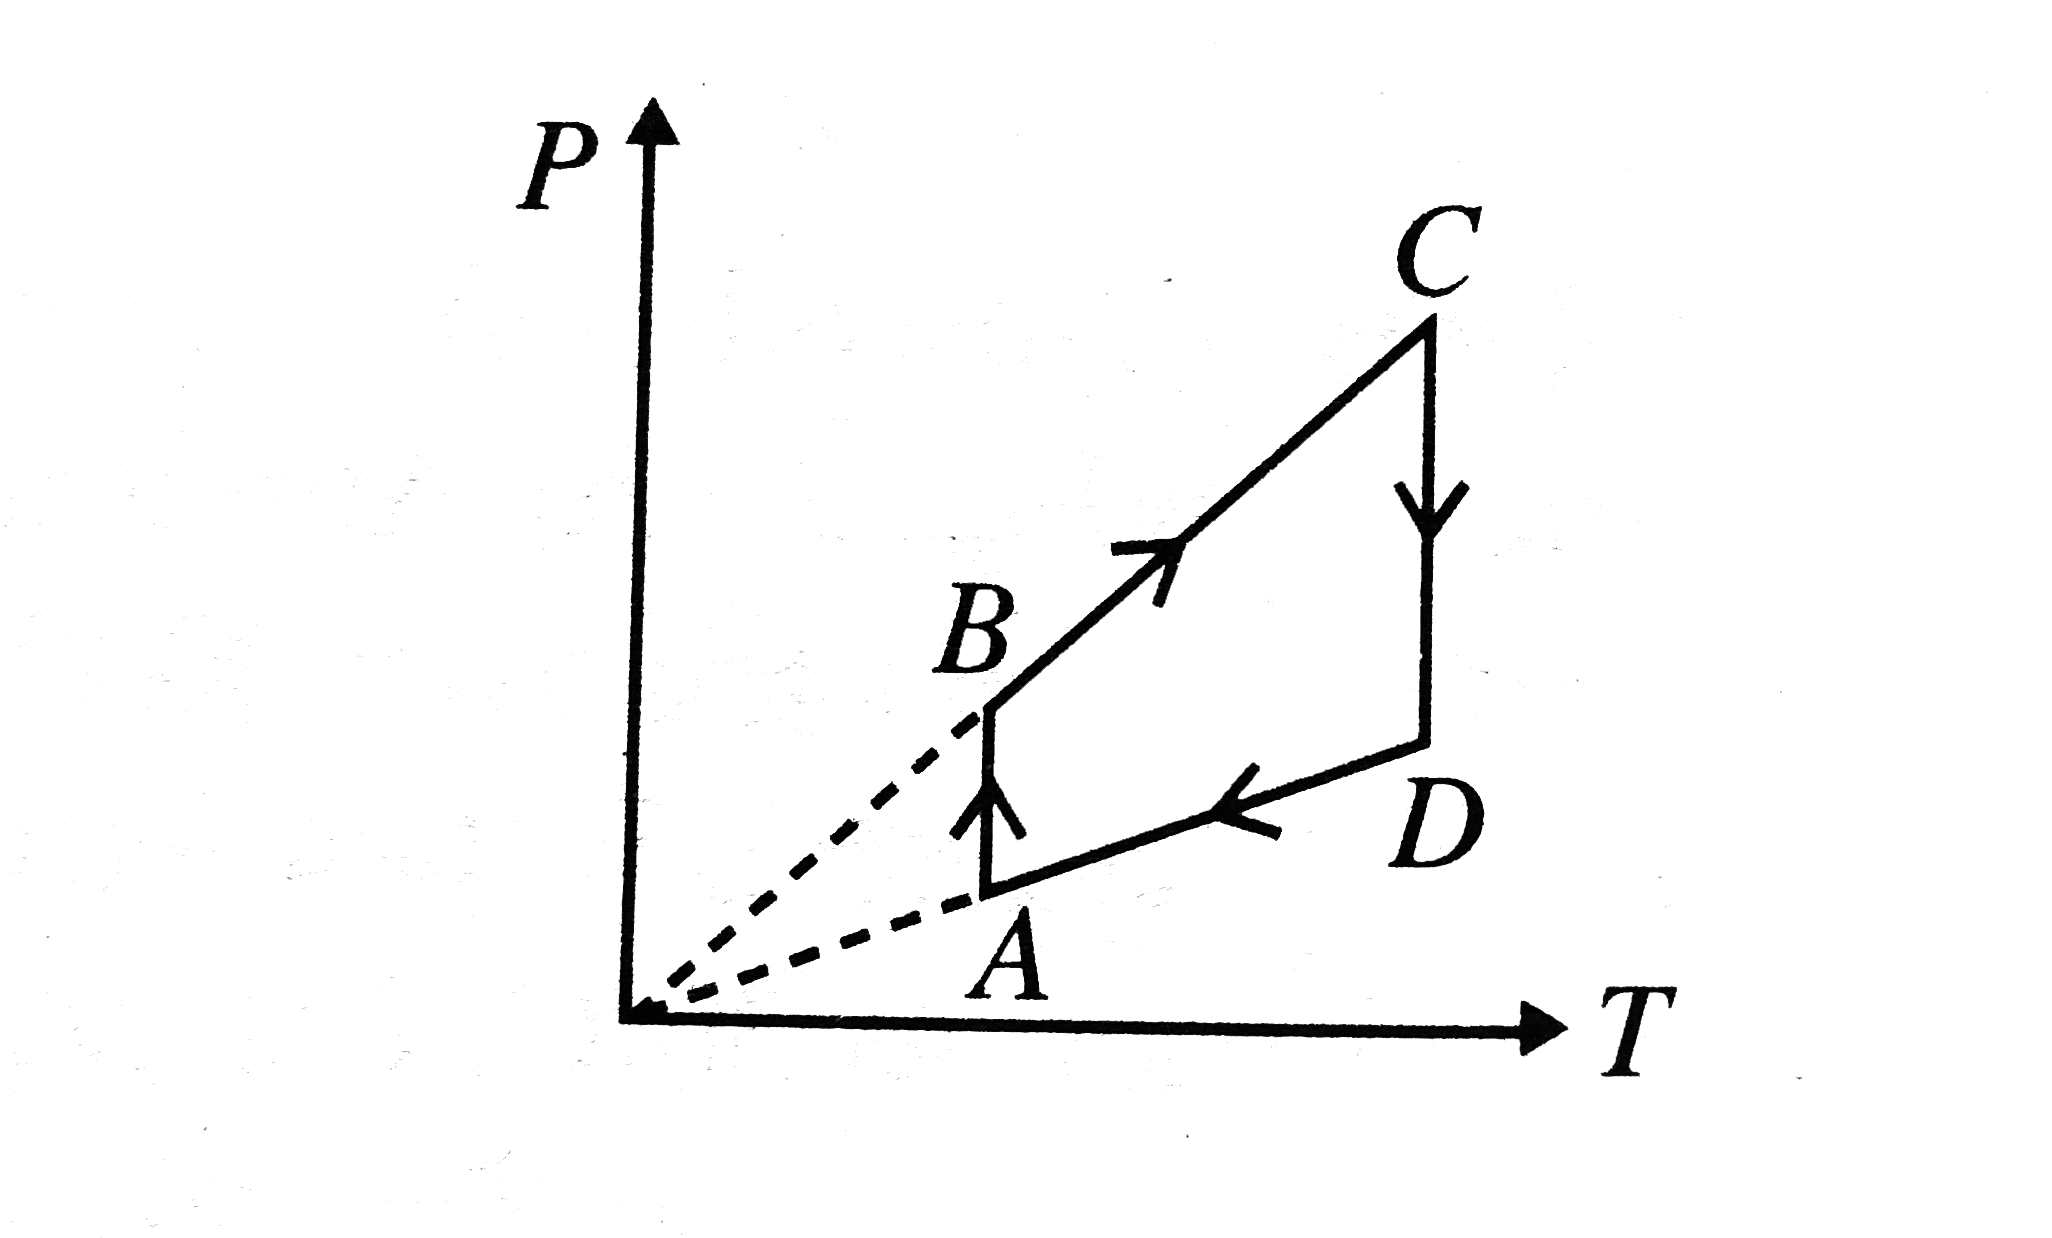
Pressure versus temperature graph of an ideal gas as shown in Fig.
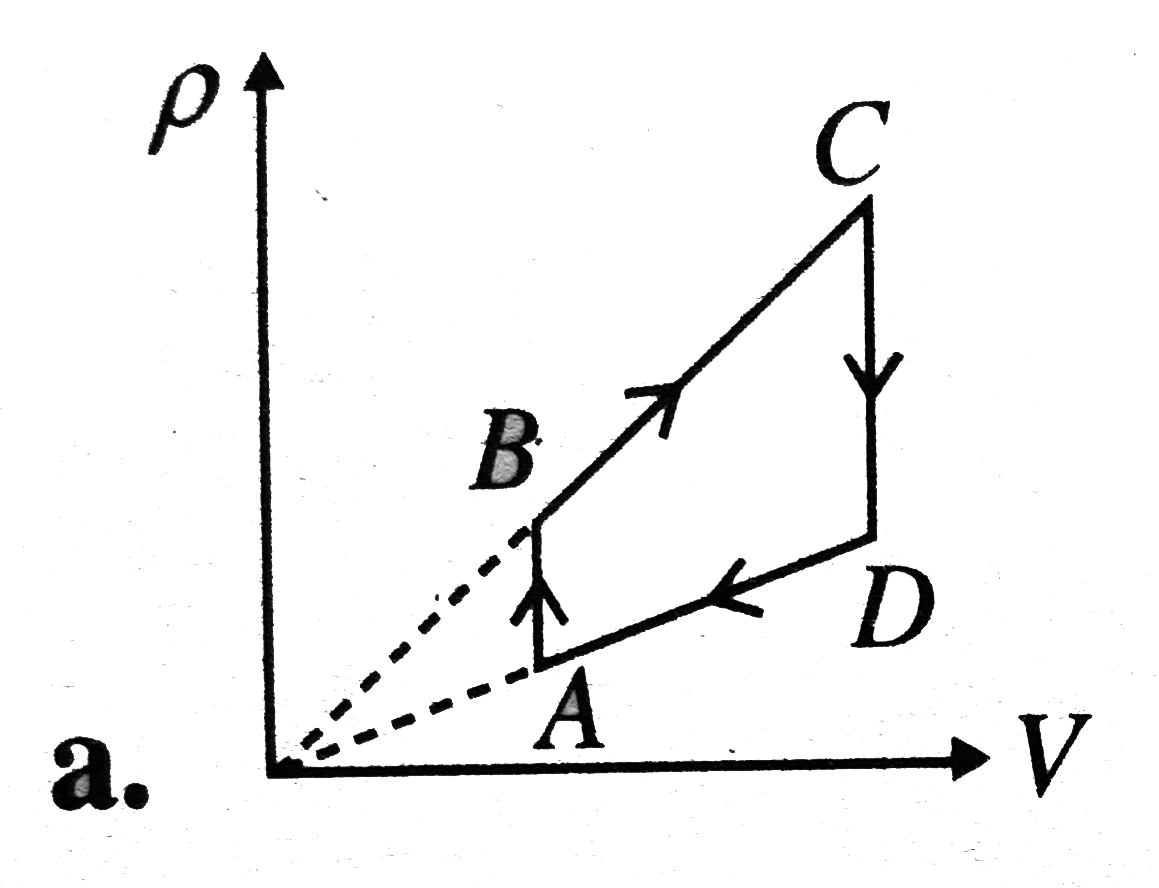
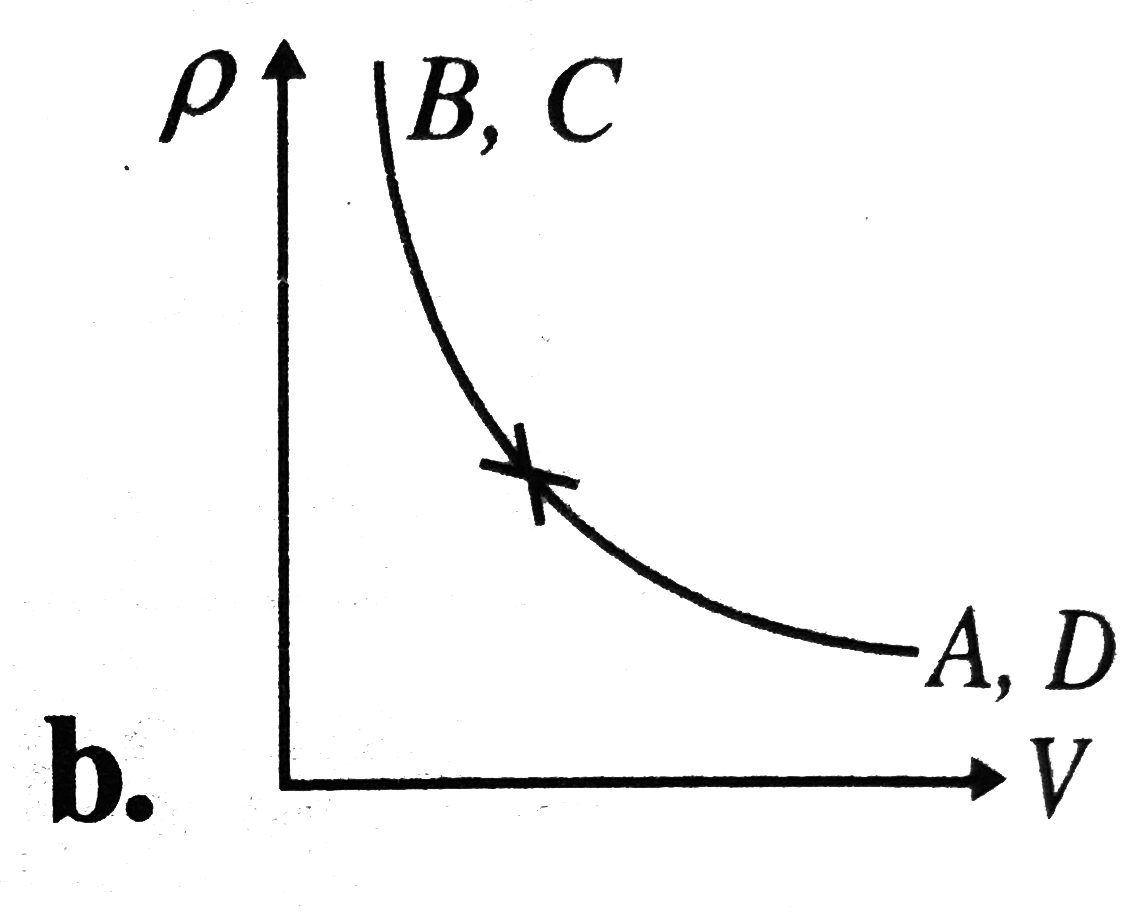
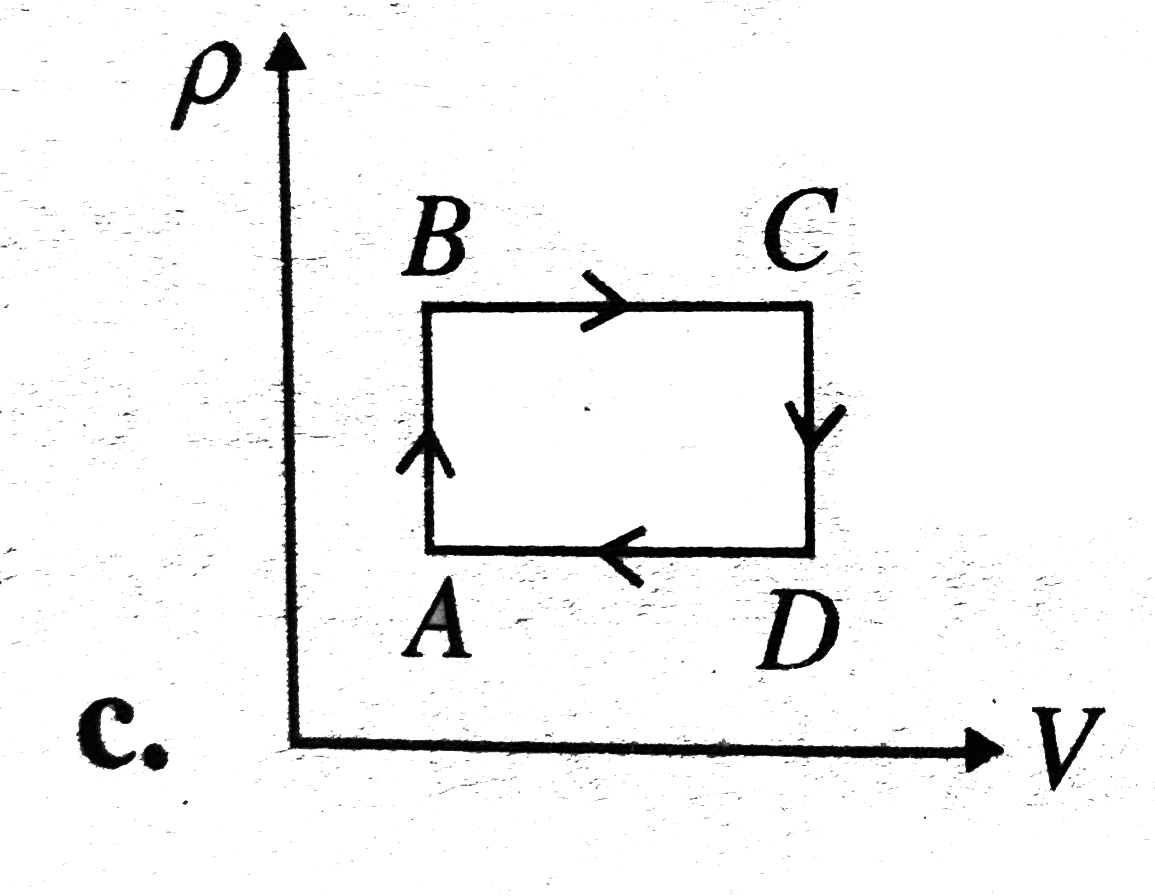
Corresponding density (ρ) versus volume (V) graph will be
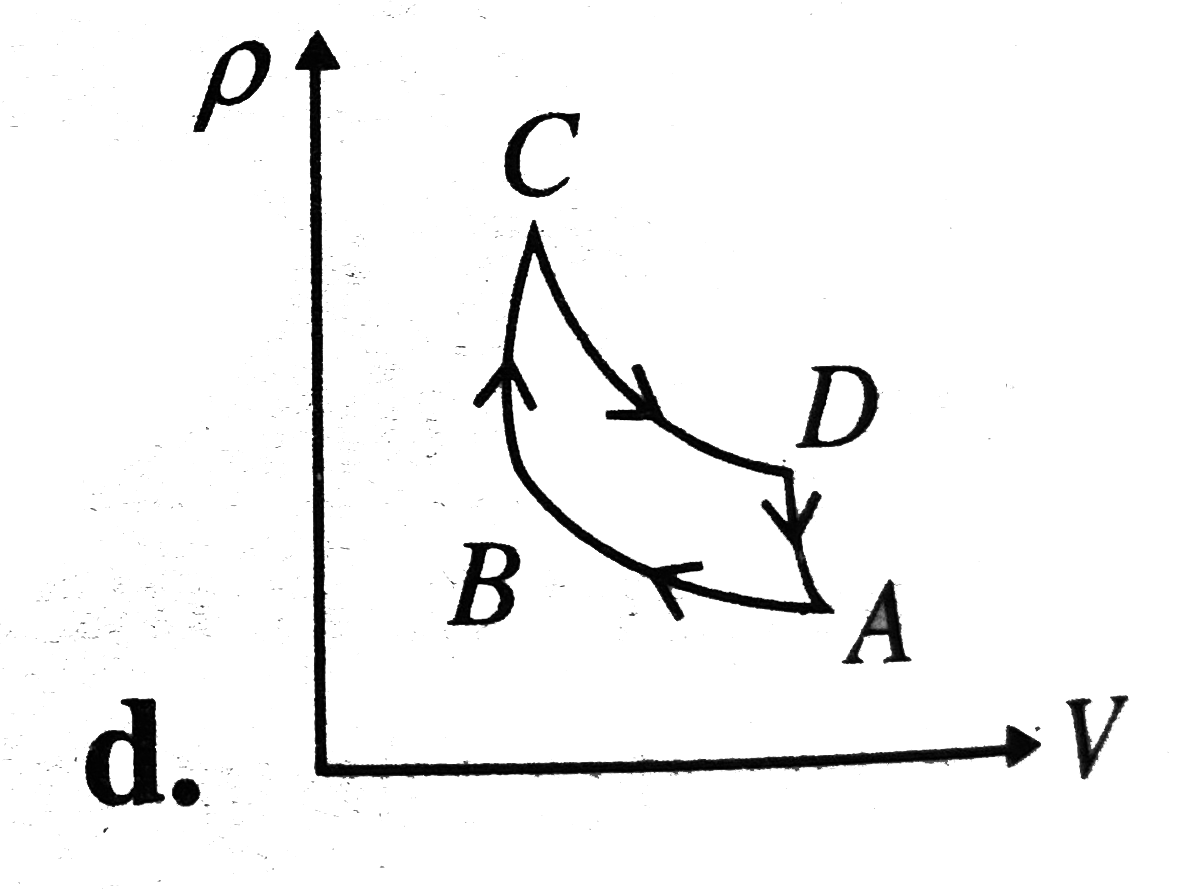
The correct Answer is:B
b. Process AB is an isothermal process, i.e., P∝1/V and since ρ∝1/V, ρ−V graph will be a rectangular hyperbola. Pressure is increasing, therefore, volume will increase. Process BC is an isochoric process. Therefore, V= constant and since ρ=m/V, density is also constant, i.e.,ρ−V graph is a dot. Process CD is inverse of process AB and process DA is inverse is BC.
Topper's Solved these Questions
- KINETIC THEORY OF GASES AND FIRST LAW OF THERMODYNAMICSBOOK - CENGAGE PHYSICS ENGLISHCHAPTER - KINETIC THEORY OF GASES AND FIRST LAW OF THERMODYNAMICSEXERCISE - Multiple Corrects
29 Videos
- KINETIC THEORY OF GASES AND FIRST LAW OF THERMODYNAMICSBOOK - CENGAGE PHYSICS ENGLISHCHAPTER - KINETIC THEORY OF GASES AND FIRST LAW OF THERMODYNAMICSEXERCISE - Assertion-Reasoning
6 Videos
- KINETIC THEORY OF GASES AND FIRST LAW OF THERMODYNAMICSBOOK - CENGAGE PHYSICS ENGLISHCHAPTER - KINETIC THEORY OF GASES AND FIRST LAW OF THERMODYNAMICSEXERCISE - Subjective
22 Videos
- KINETIC THEORY OF GASESBOOK - CENGAGE PHYSICS ENGLISHCHAPTER - KINETIC THEORY OF GASESEXERCISE - Compression
2 Videos
- LINEAR AND ANGULAR SIMPLE HARMONIC MOTIONBOOK - CENGAGE PHYSICS ENGLISHCHAPTER - LINEAR AND ANGULAR SIMPLE HARMONIC MOTIONEXERCISE - Single correct anwer type
14 Videos
Similar Questions
Pressure versus density graph of an ideal gas is shown in figure
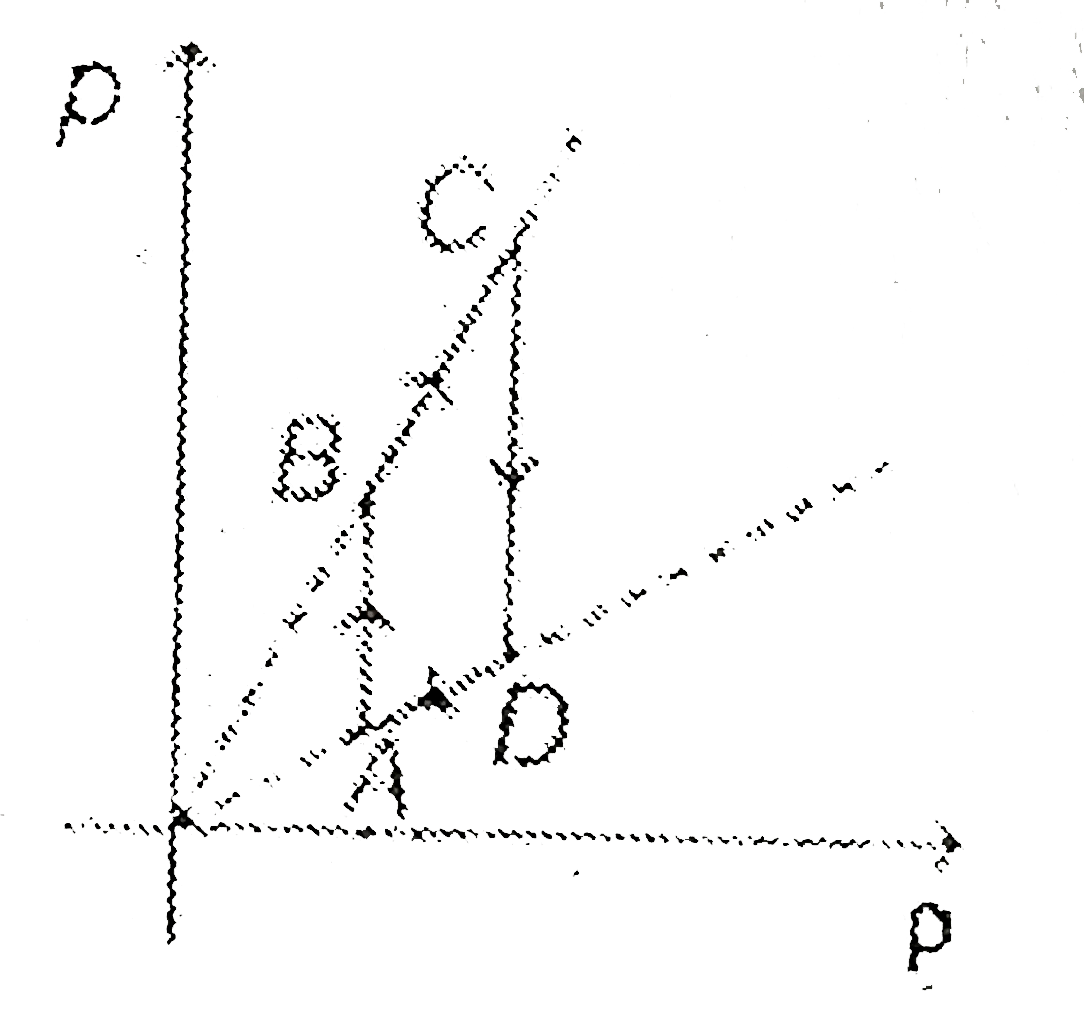
View SolutionPressure versus temperature graphs of an ideal gas are as shown in figure. Choose the wrong statement
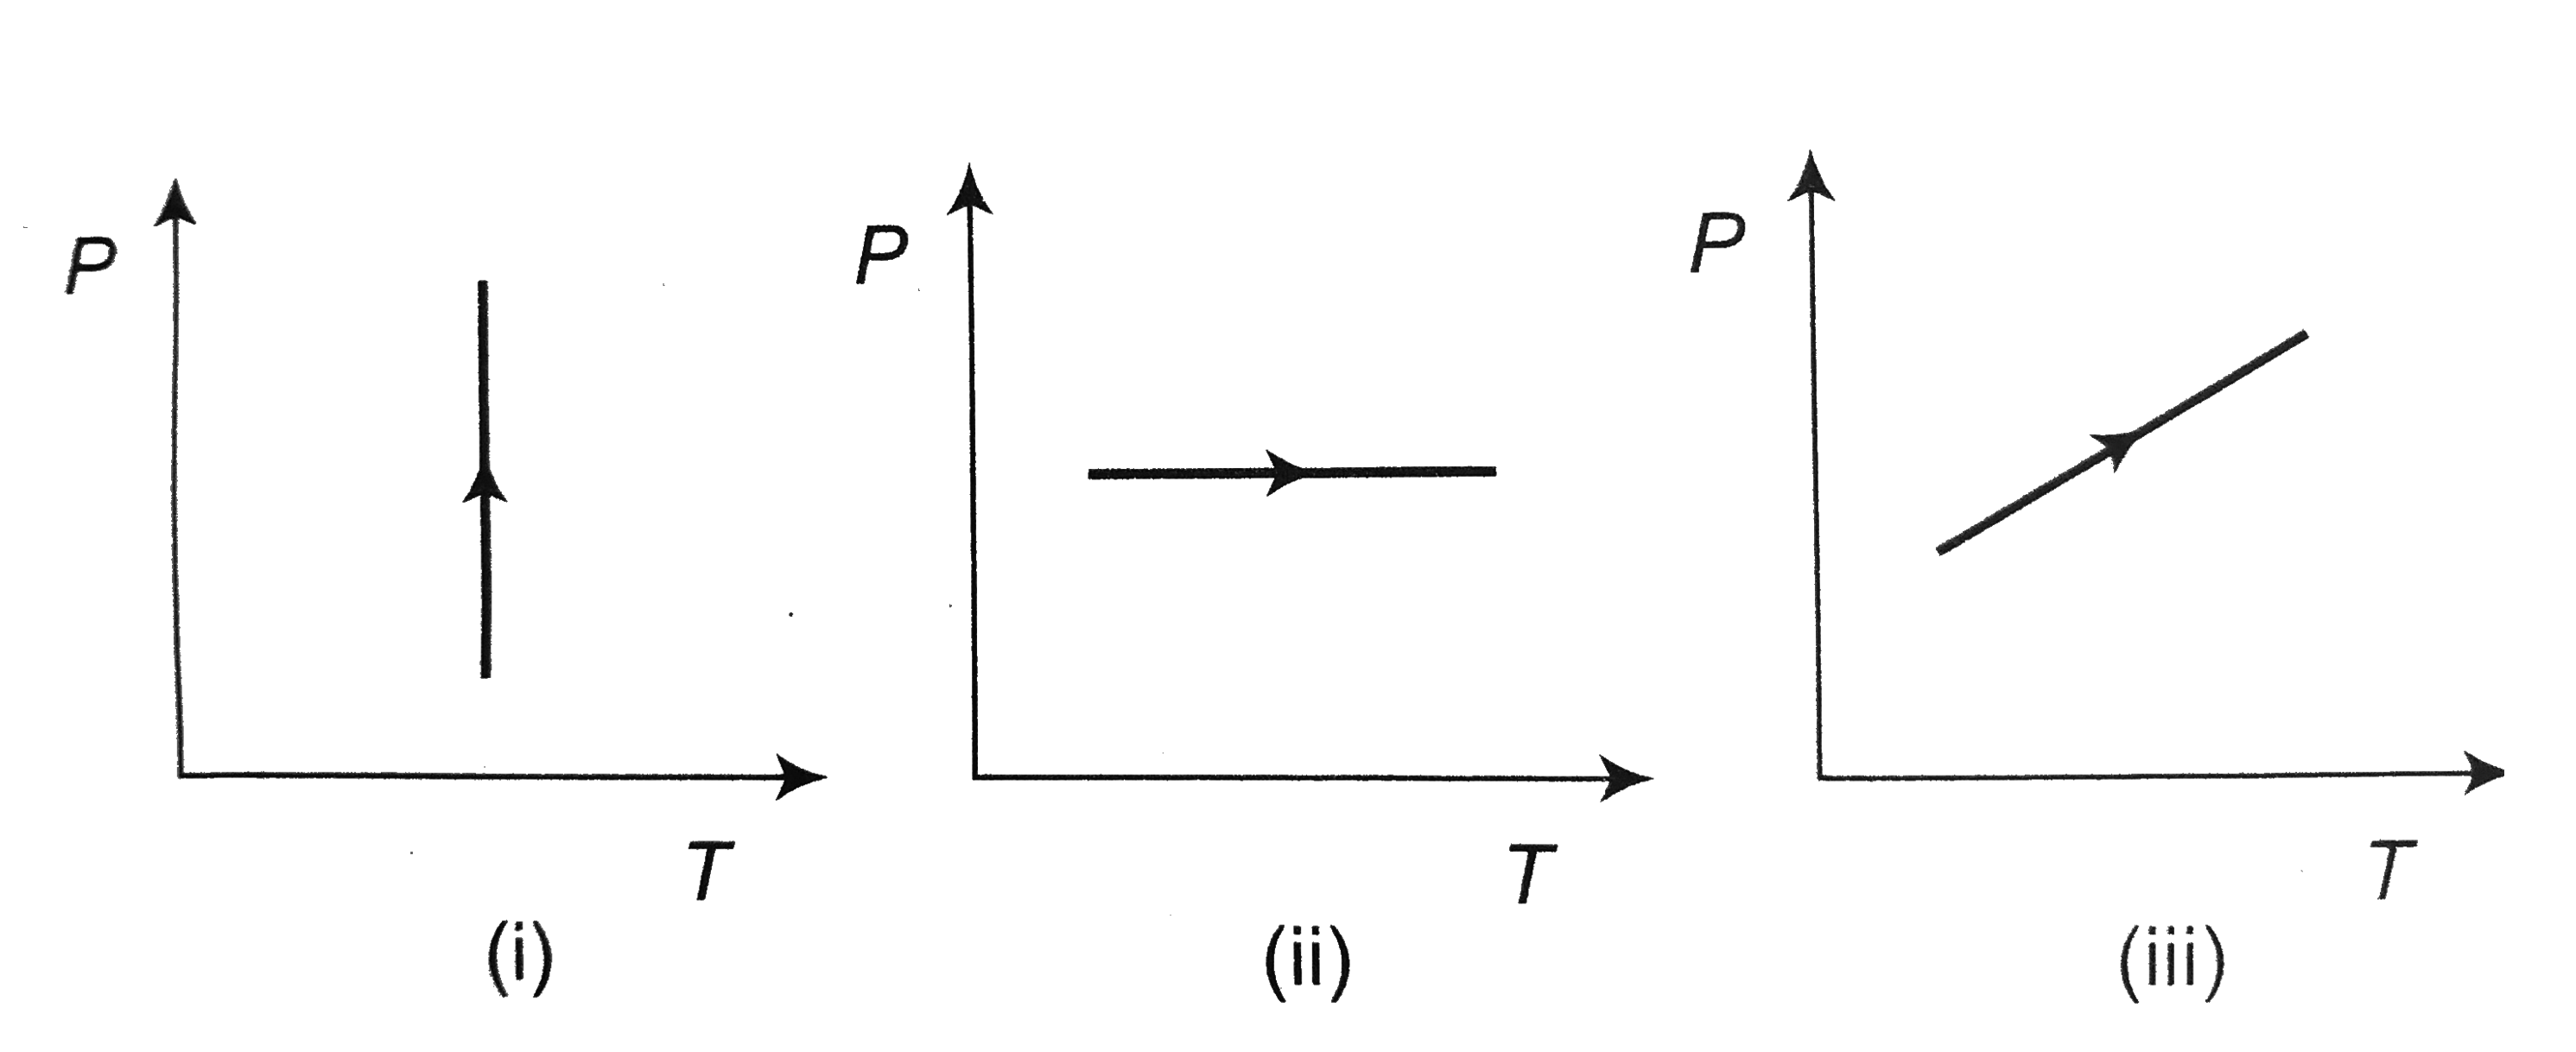
View SolutionPressure versus temperature graphs of an ideal gas are as shown in figure. Choose the wrong statement

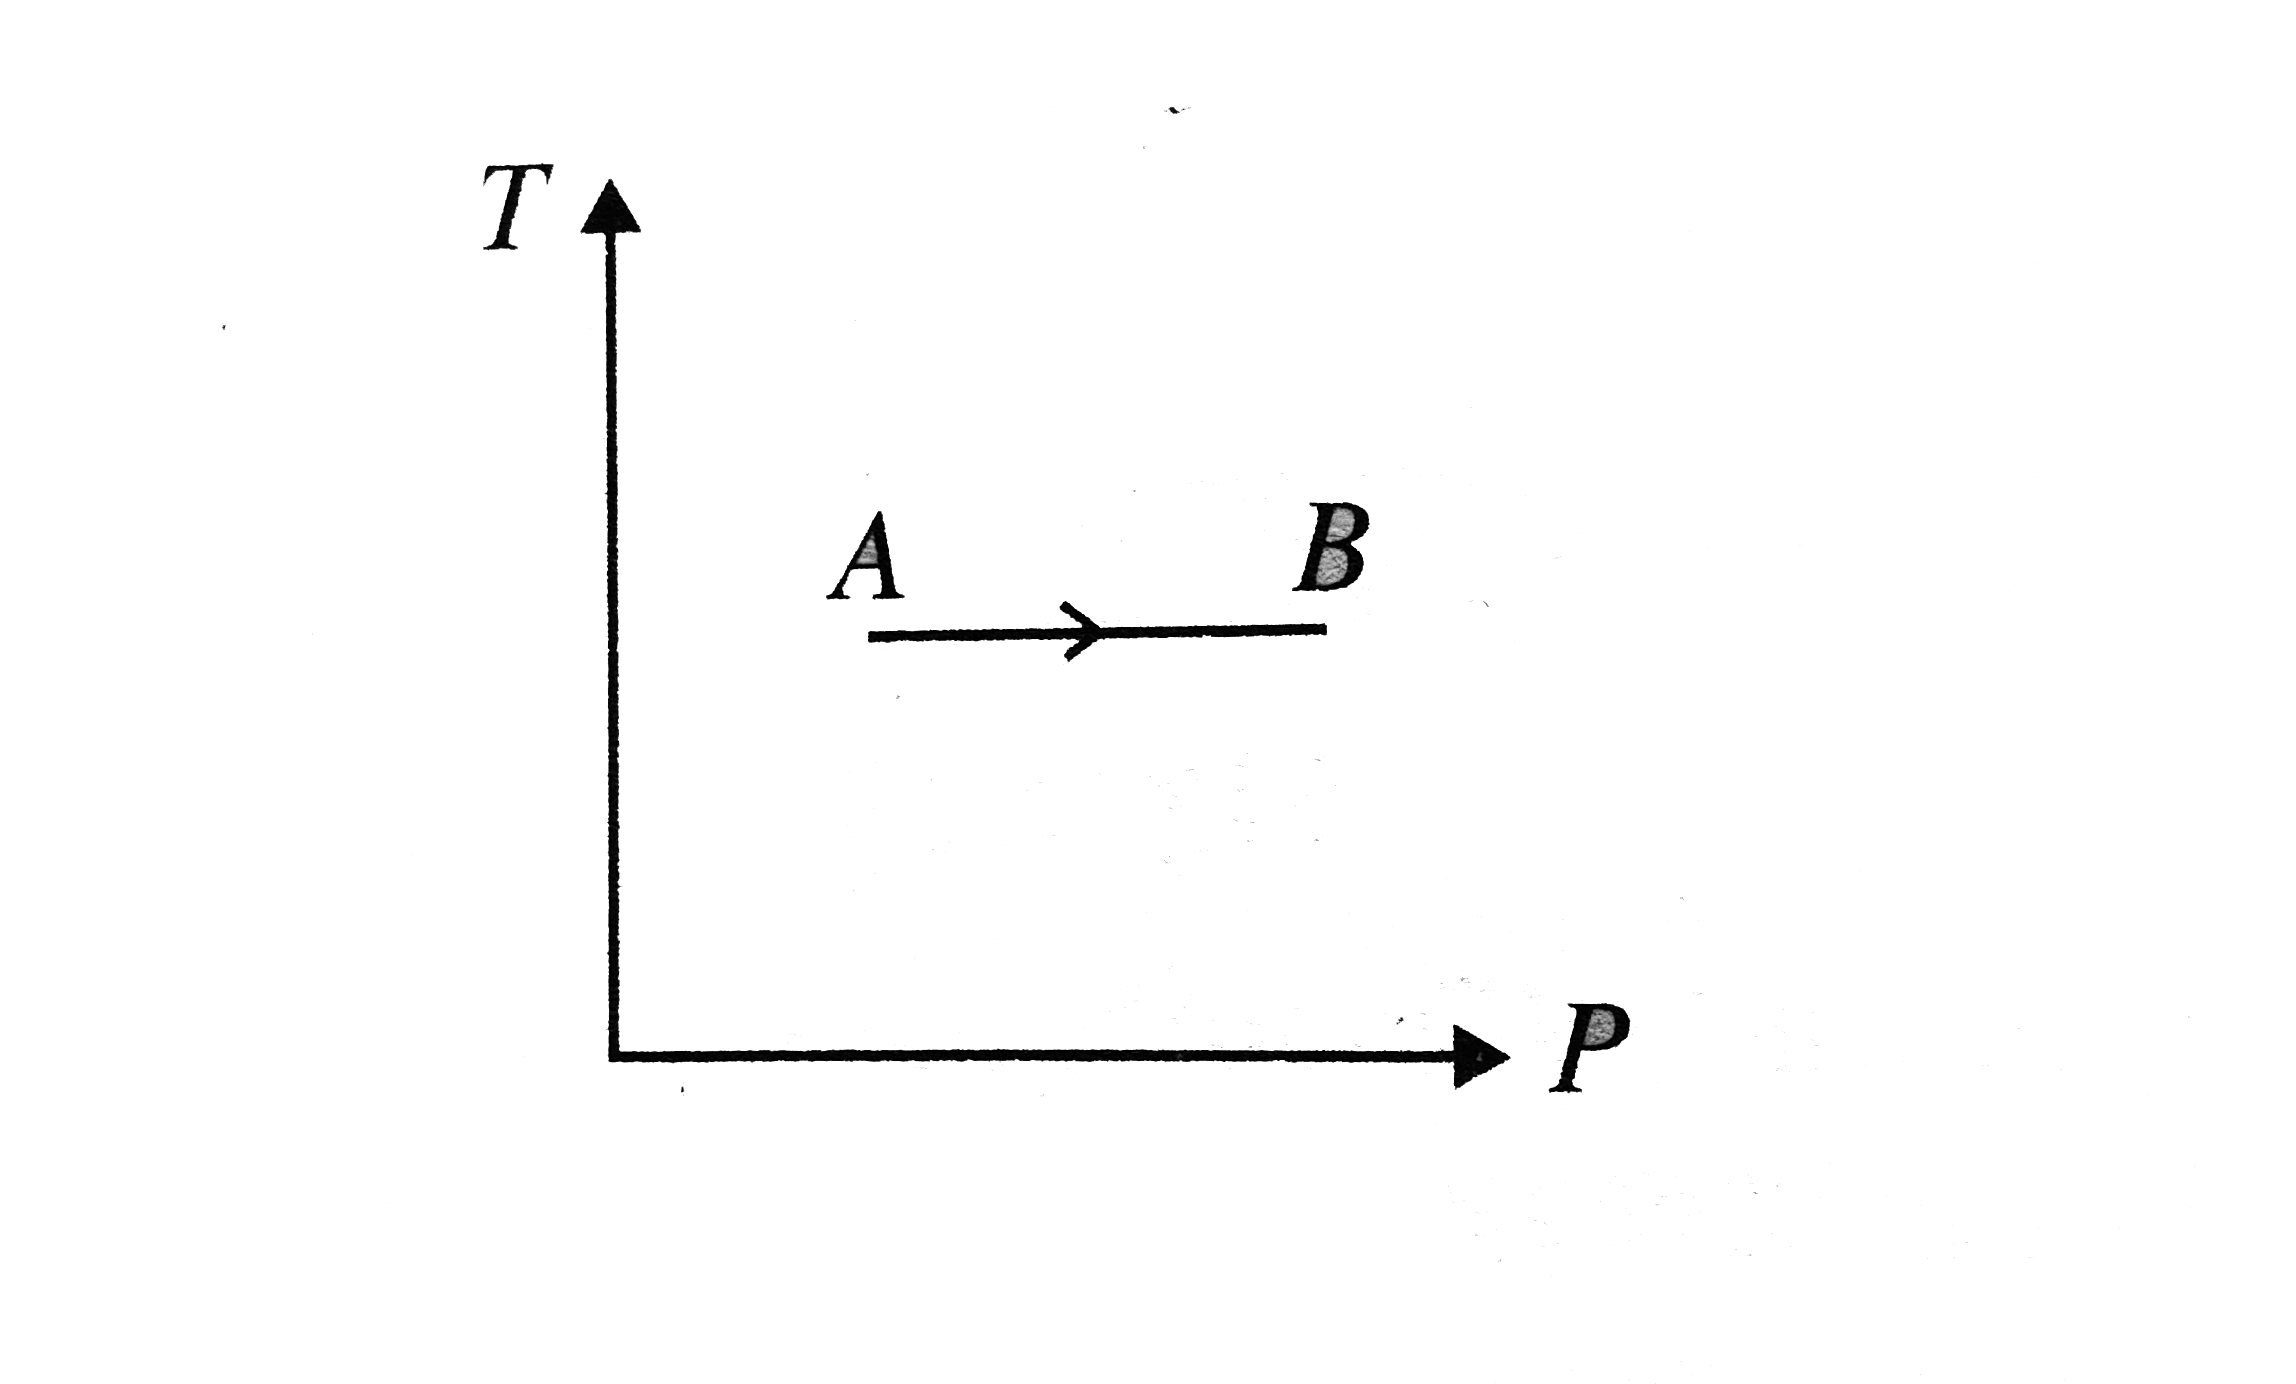
View SolutionTemperature versus pressure graph of an ideal gas is shown in Fig. During the process AB
View SolutionPressure versus temperature graph of an ideal gas is shown in figure. Density of the gas at point A is ρ0. Density at B will be
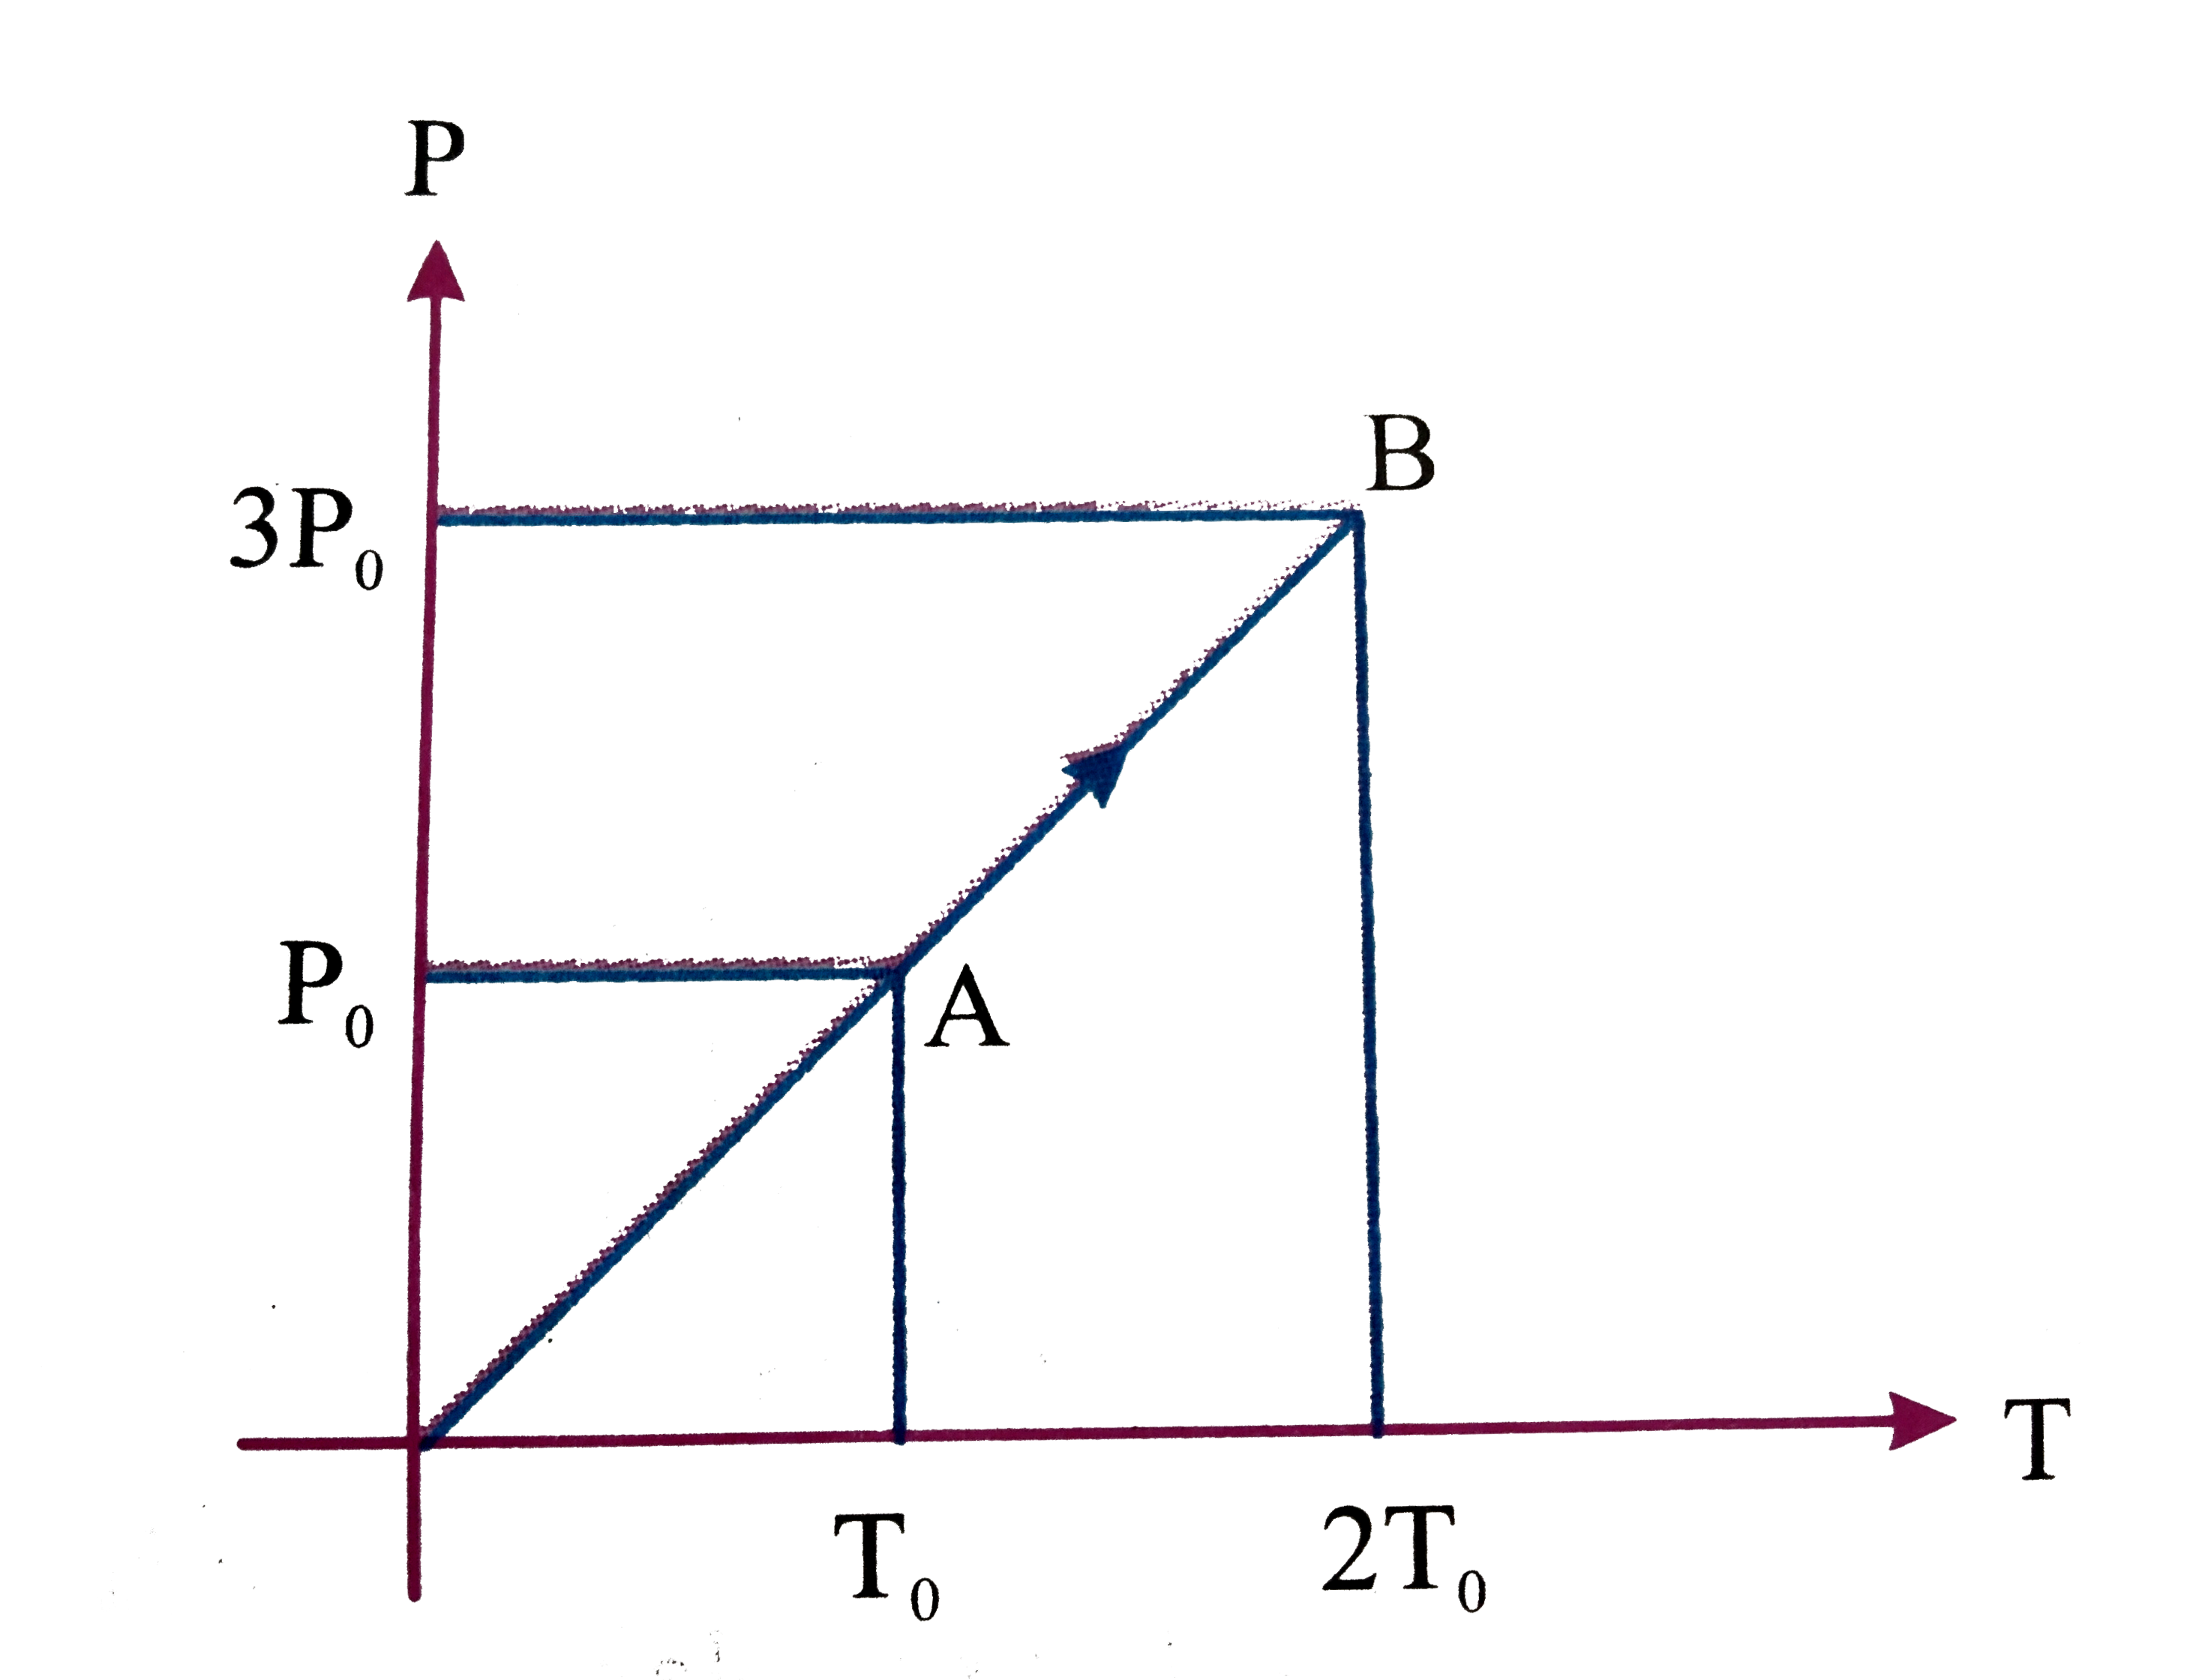
View SolutionIn figure shown,Pressure versus temperature graph of an ideal gas is as . Density of the gas at point A is ρ0 . Density at point B will be ____
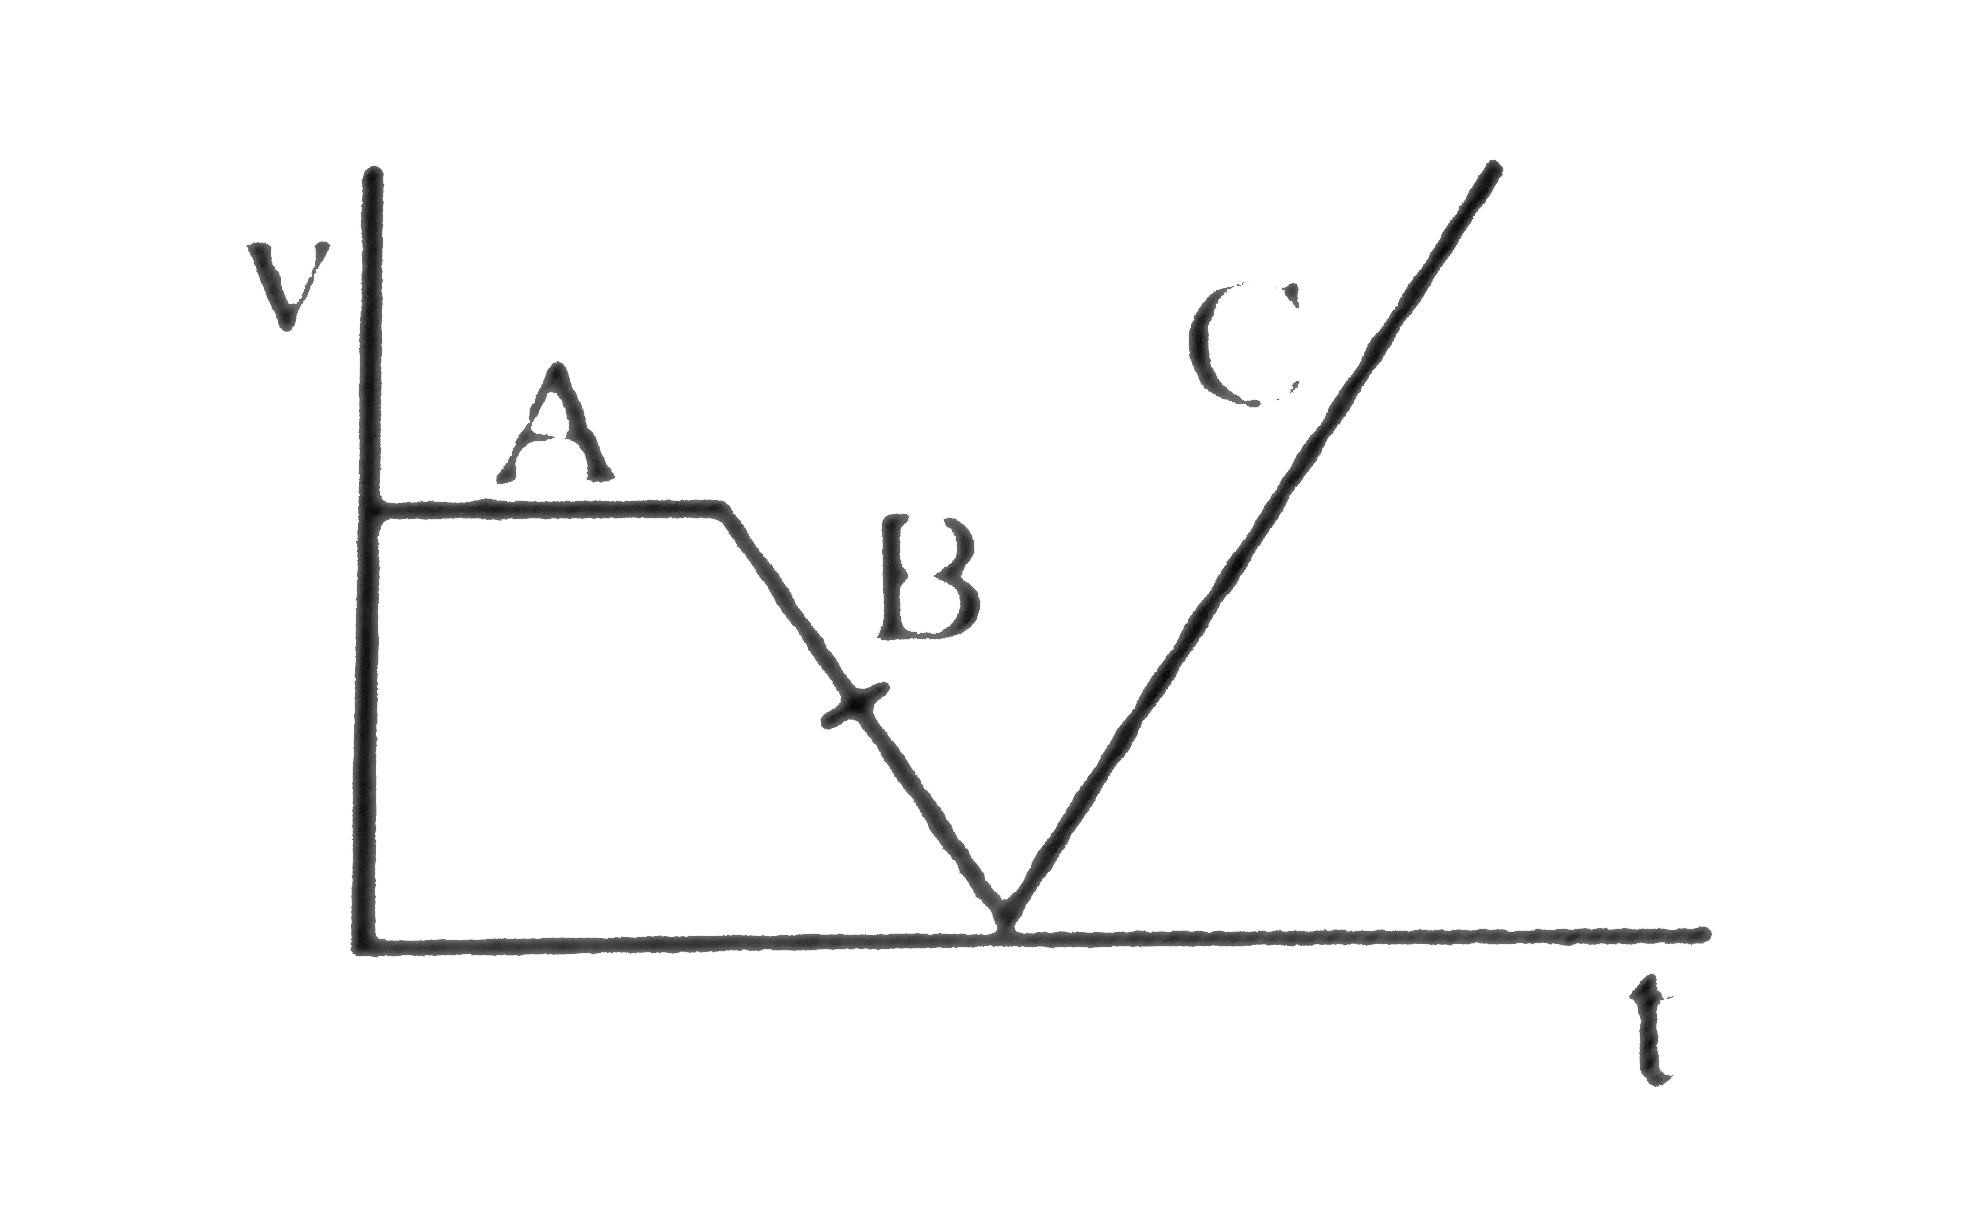
View SolutionVelocity versus time graph of a body is shown in figure. It explains that
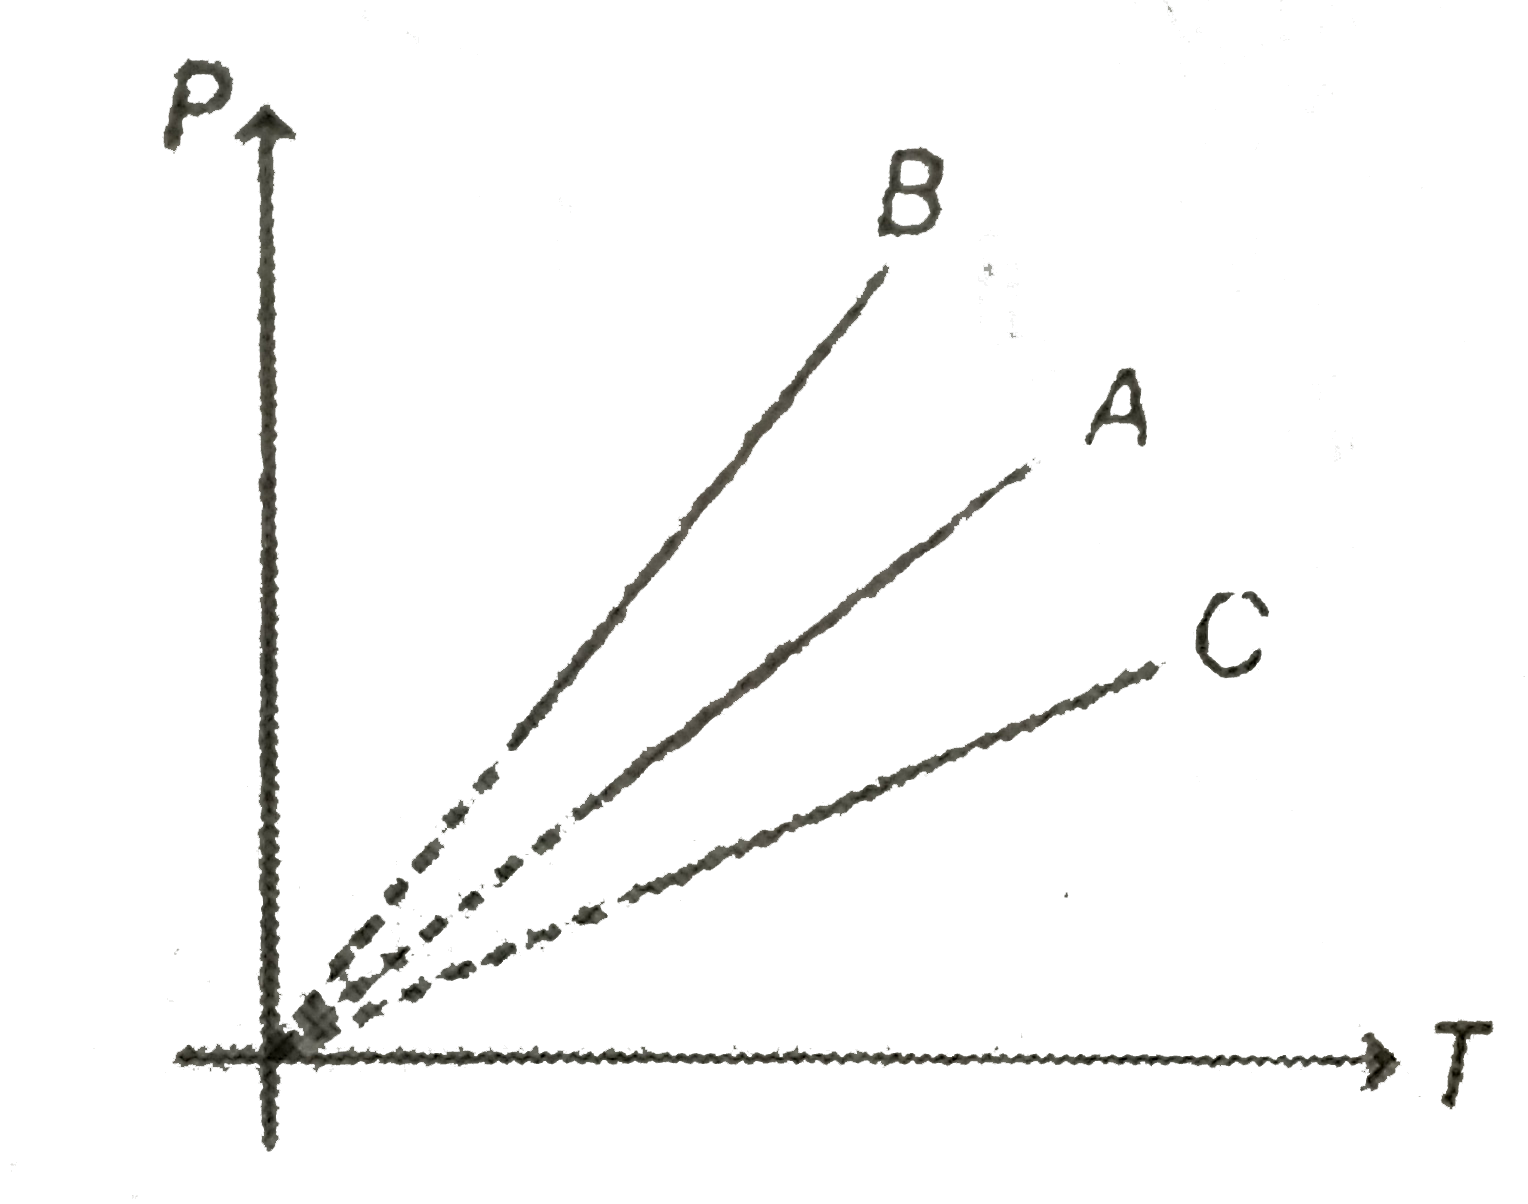
View SolutionPressure versus temperature graph of an ideal gas at constant volume V is shown by the straight line A. Now mass of the gas is doubled and the volume is halved, then the corresponding pressure versus temperature graph will be shown by the line
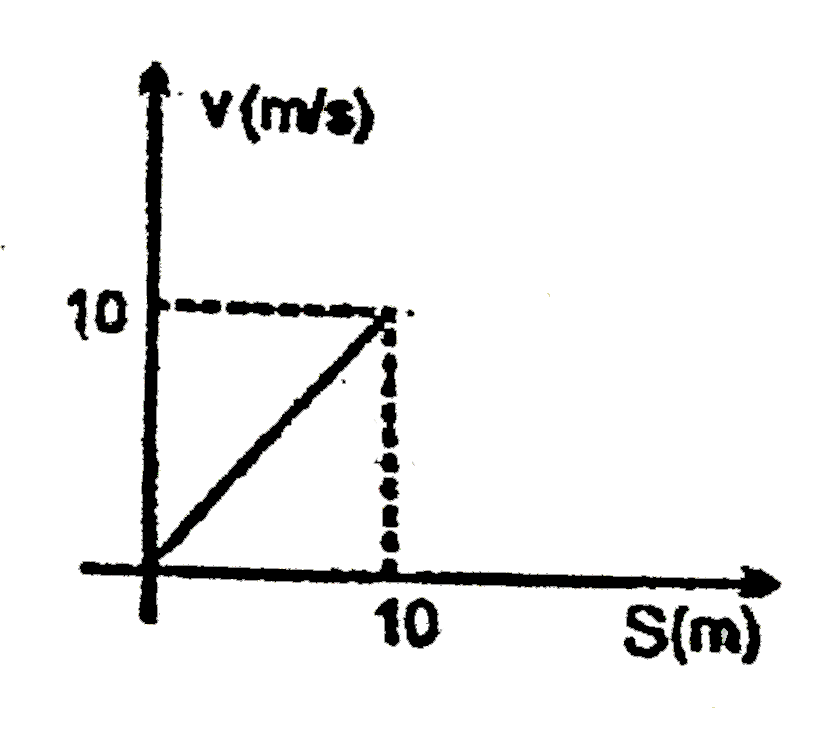
View SolutionVelocity (v) versus displacement (s) graph of a particle moving in a straight line is shown in figure. Corresponding acceleration (a) versus velocity (v) graph will be
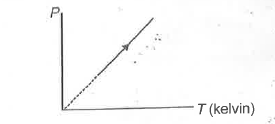
View SolutionThe graph of pressure and temperature for an ideal gas is as shown in figure. The given process is
View Solution
