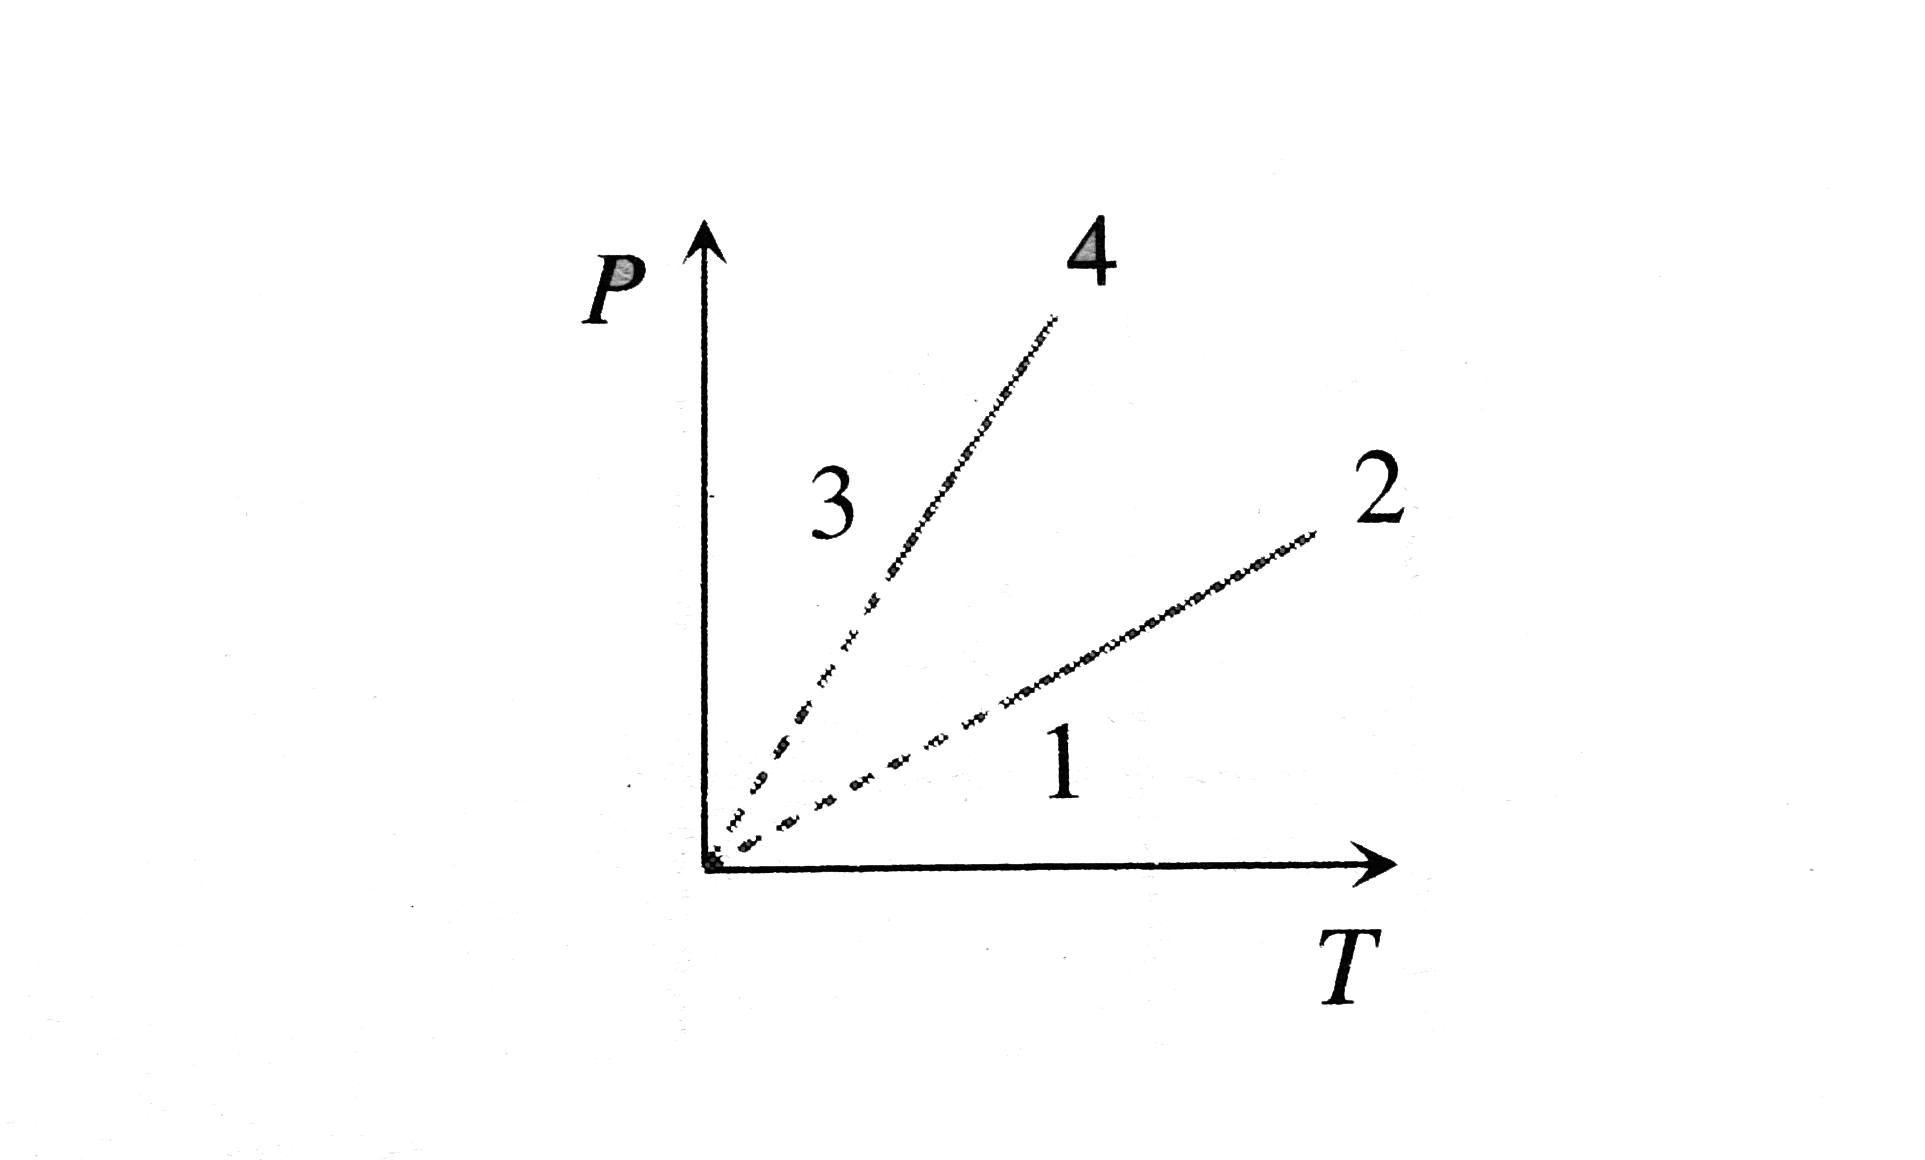
Pressure versus temperature graph of an ideal gas of equal number of moles of different volumes is plotted as shown in Fig. Choose the correct alternative.
V1=V2=V3=V4
V4>V3>V2>V1
V1=V2,V3=V4andV2>V3
V1=V2,V3=V4andV2<V3
The correct Answer is:C
As P-T graphs are straight lines, passing through origin, therefore, P∝T. But as P=(μRV)T.
thererore, the slope of straight line ∝1V
As(Slope)12<(Slope)34 ∴V2>V3
As for a given slope, V is constant, therefore,
V1=V2andV3=V4.
Topper's Solved these Questions
- KINETIC THEORYBook:NCERT FINGERTPS ENGLISHChapter:KINETIC THEORYExercise:Kinetic Theory of An Ideal Gas
Explore 18 Videos
- KINETIC THEORYBook:NCERT FINGERTPS ENGLISHChapter:KINETIC THEORYExercise:LAW OF EQUIPARTITION OF ENERGY
Explore 5 Videos
- KINETIC THEORYBook:NCERT FINGERTPS ENGLISHChapter:KINETIC THEORYExercise:Assertion And Reason
Explore 10 Videos
- GRAVITATIONBook:NCERT FINGERTPS ENGLISHChapter:GRAVITATIONExercise:Assertion And Reason
Explore 15 Videos
- LAWS OF MOTIONBook:NCERT FINGERTPS ENGLISHChapter:LAWS OF MOTIONExercise:Assertion And Reason
Explore 15 Videos
Similar Questions
Volume versus temperature (V-T) graph of an ideal gas of equal number of moles is plotted as shown in the figure. Choose the correct alternative.
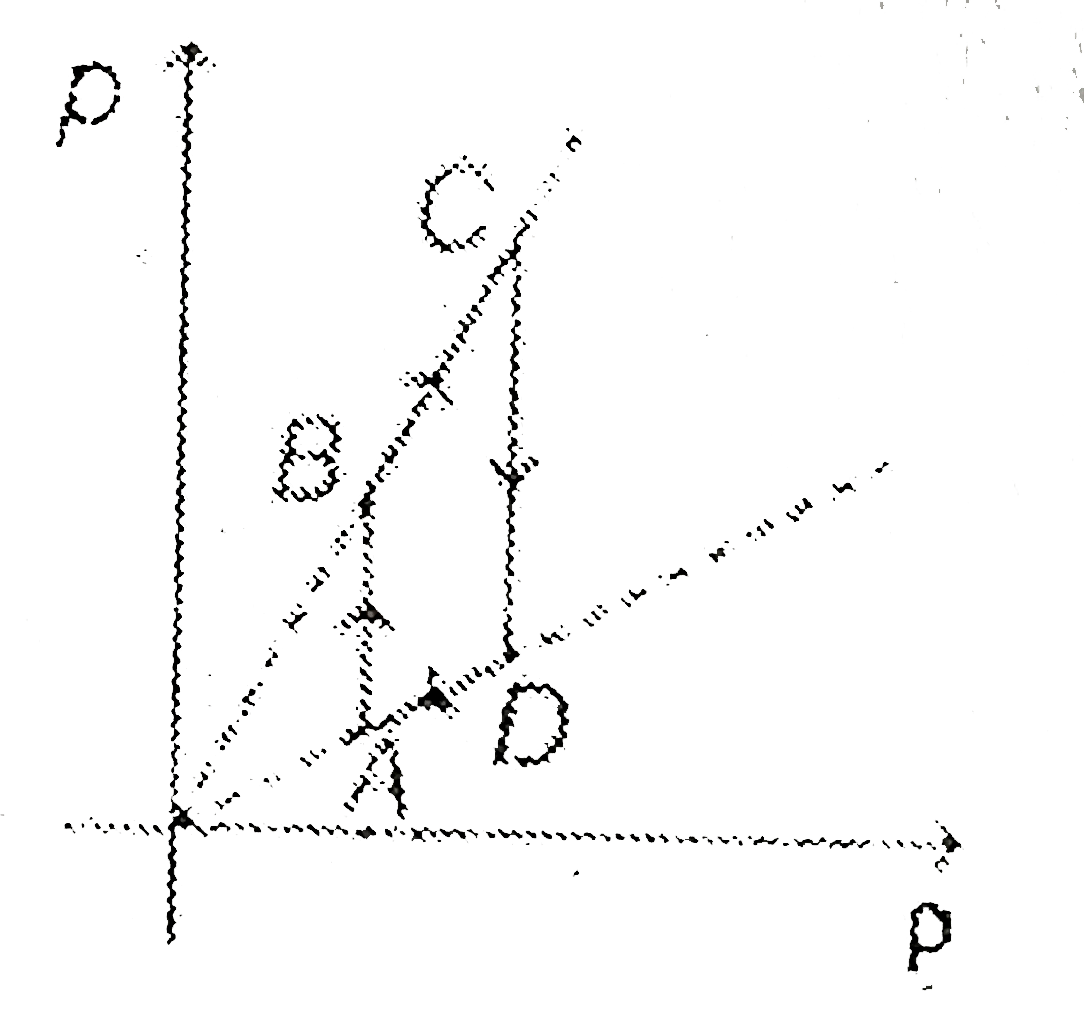
View SolutionPressure versus density graph of an ideal gas is shown in figure
View Solution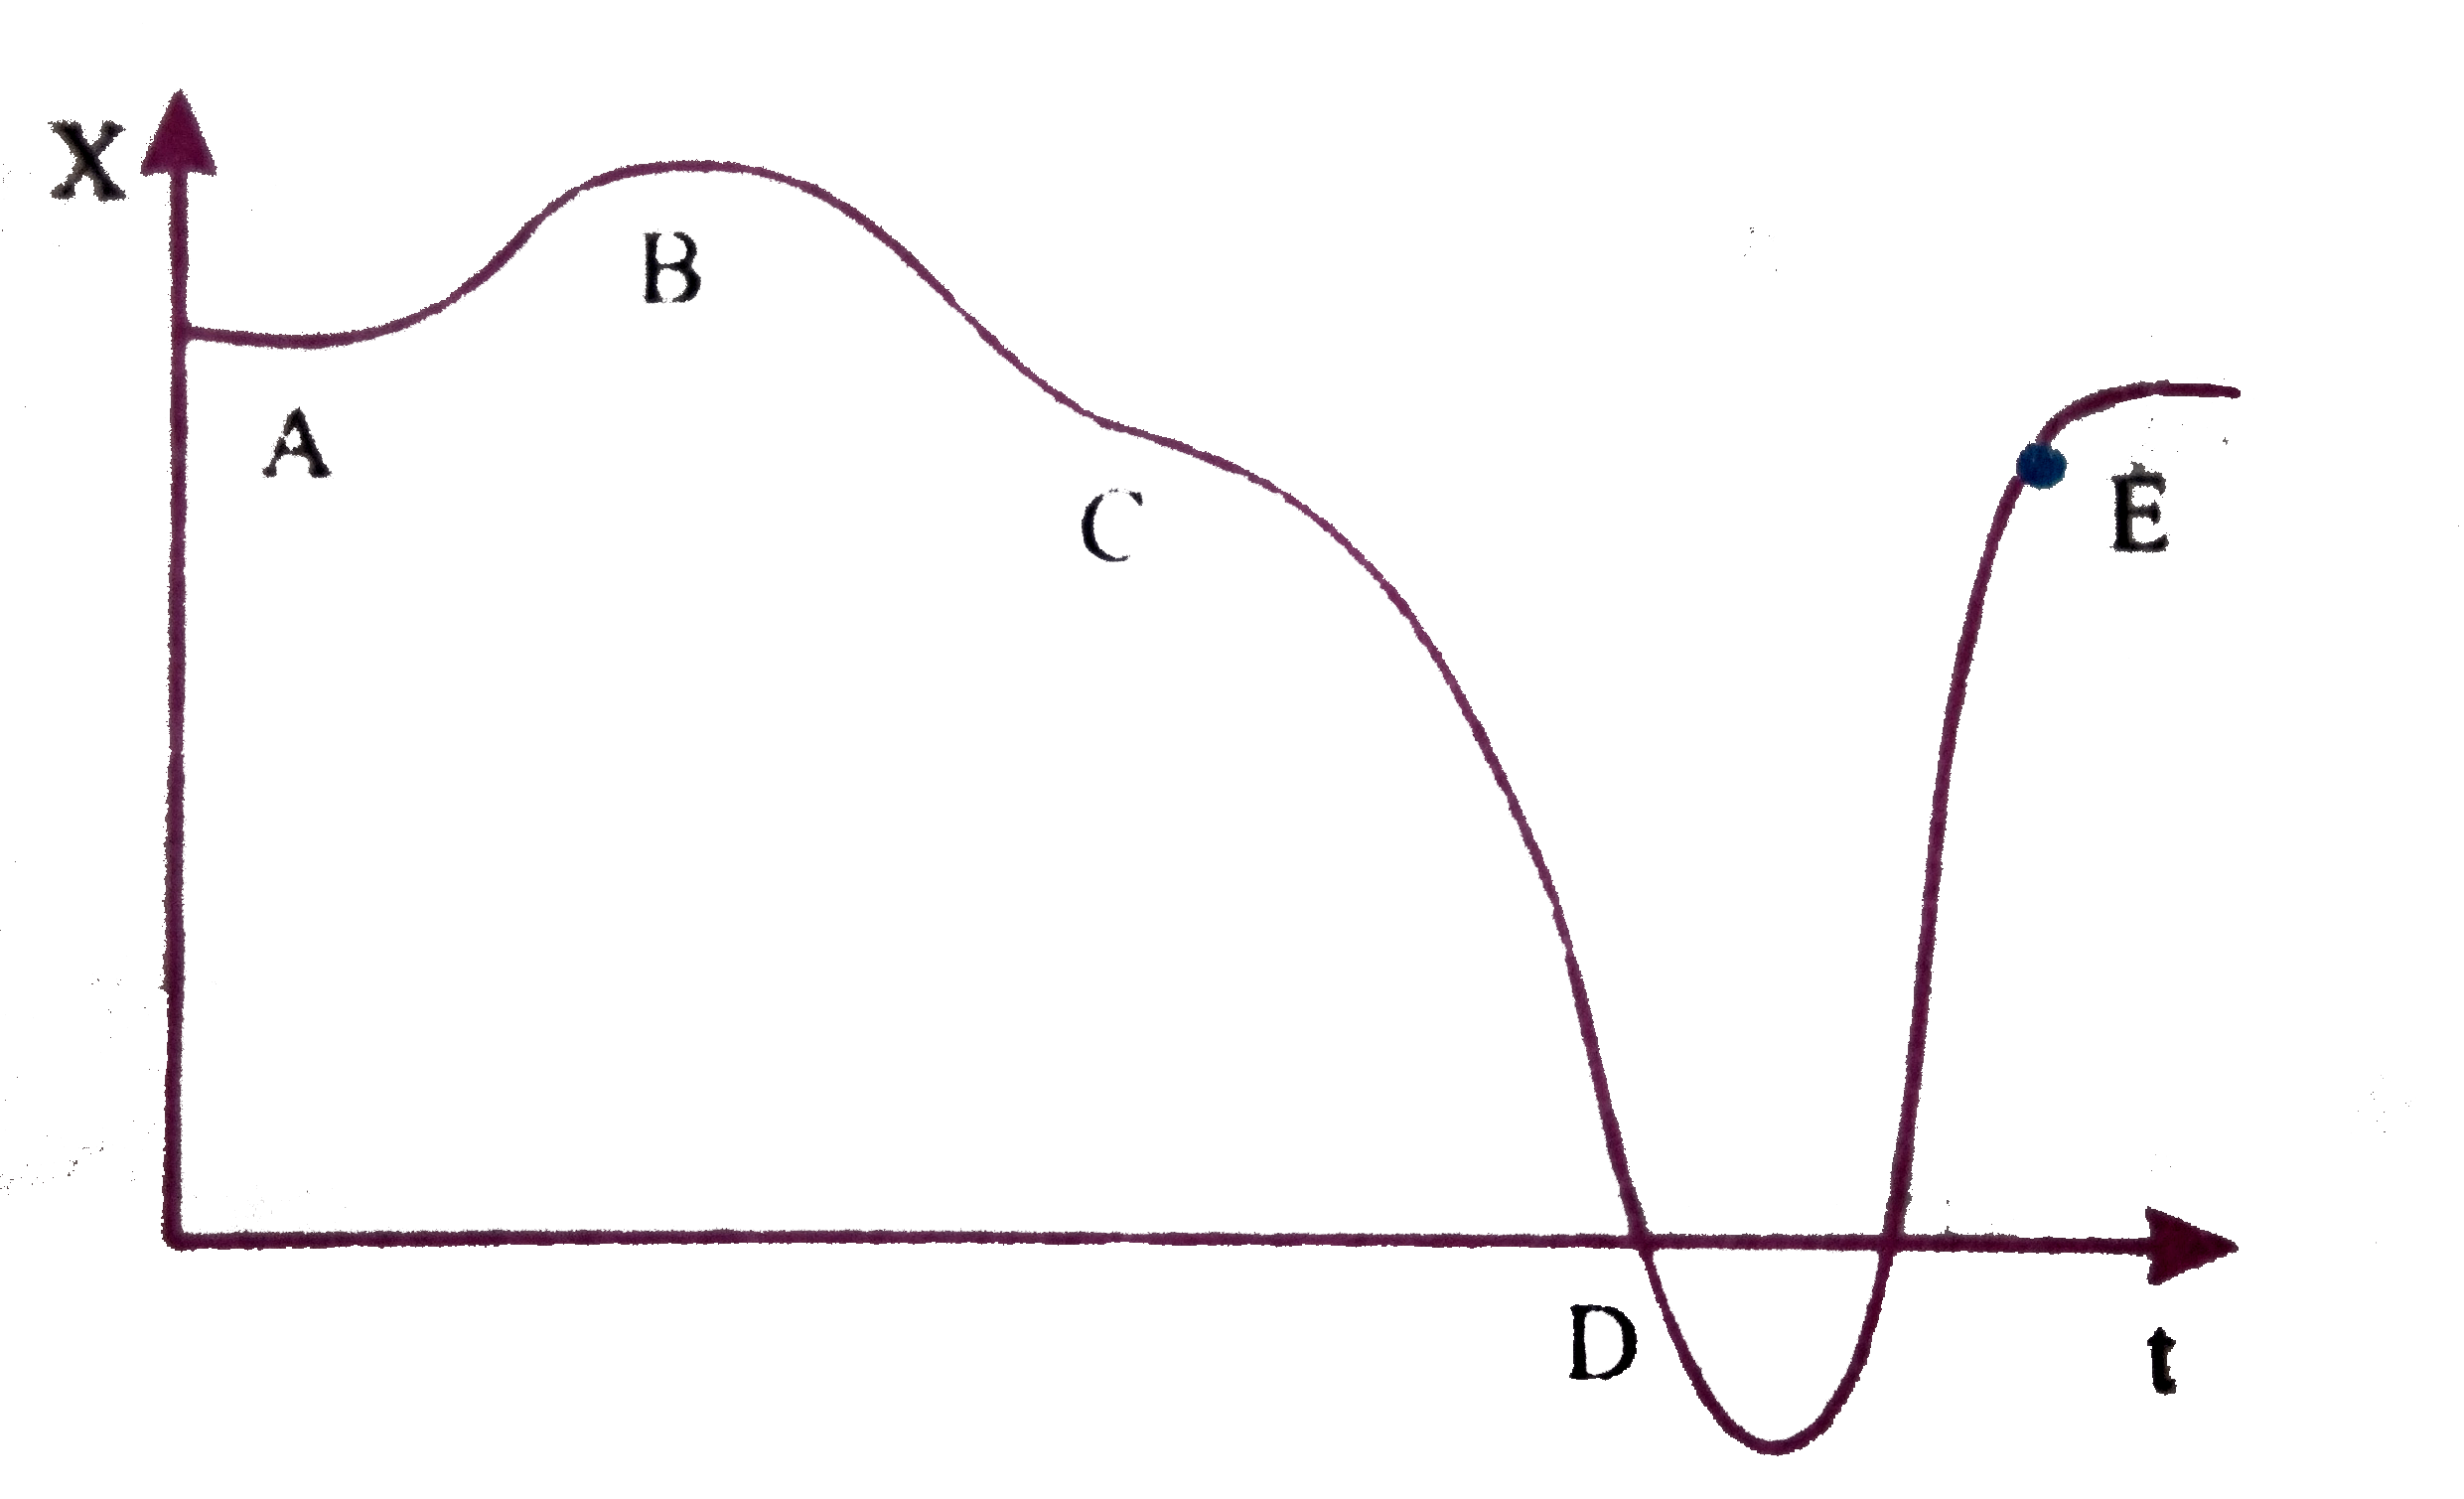
A graph of x versus t is shown in figure. Choose correct alternative from below.
View SolutionPressure versus temperature graphs of an ideal gas are as shown in figure. Choose the wrong statement
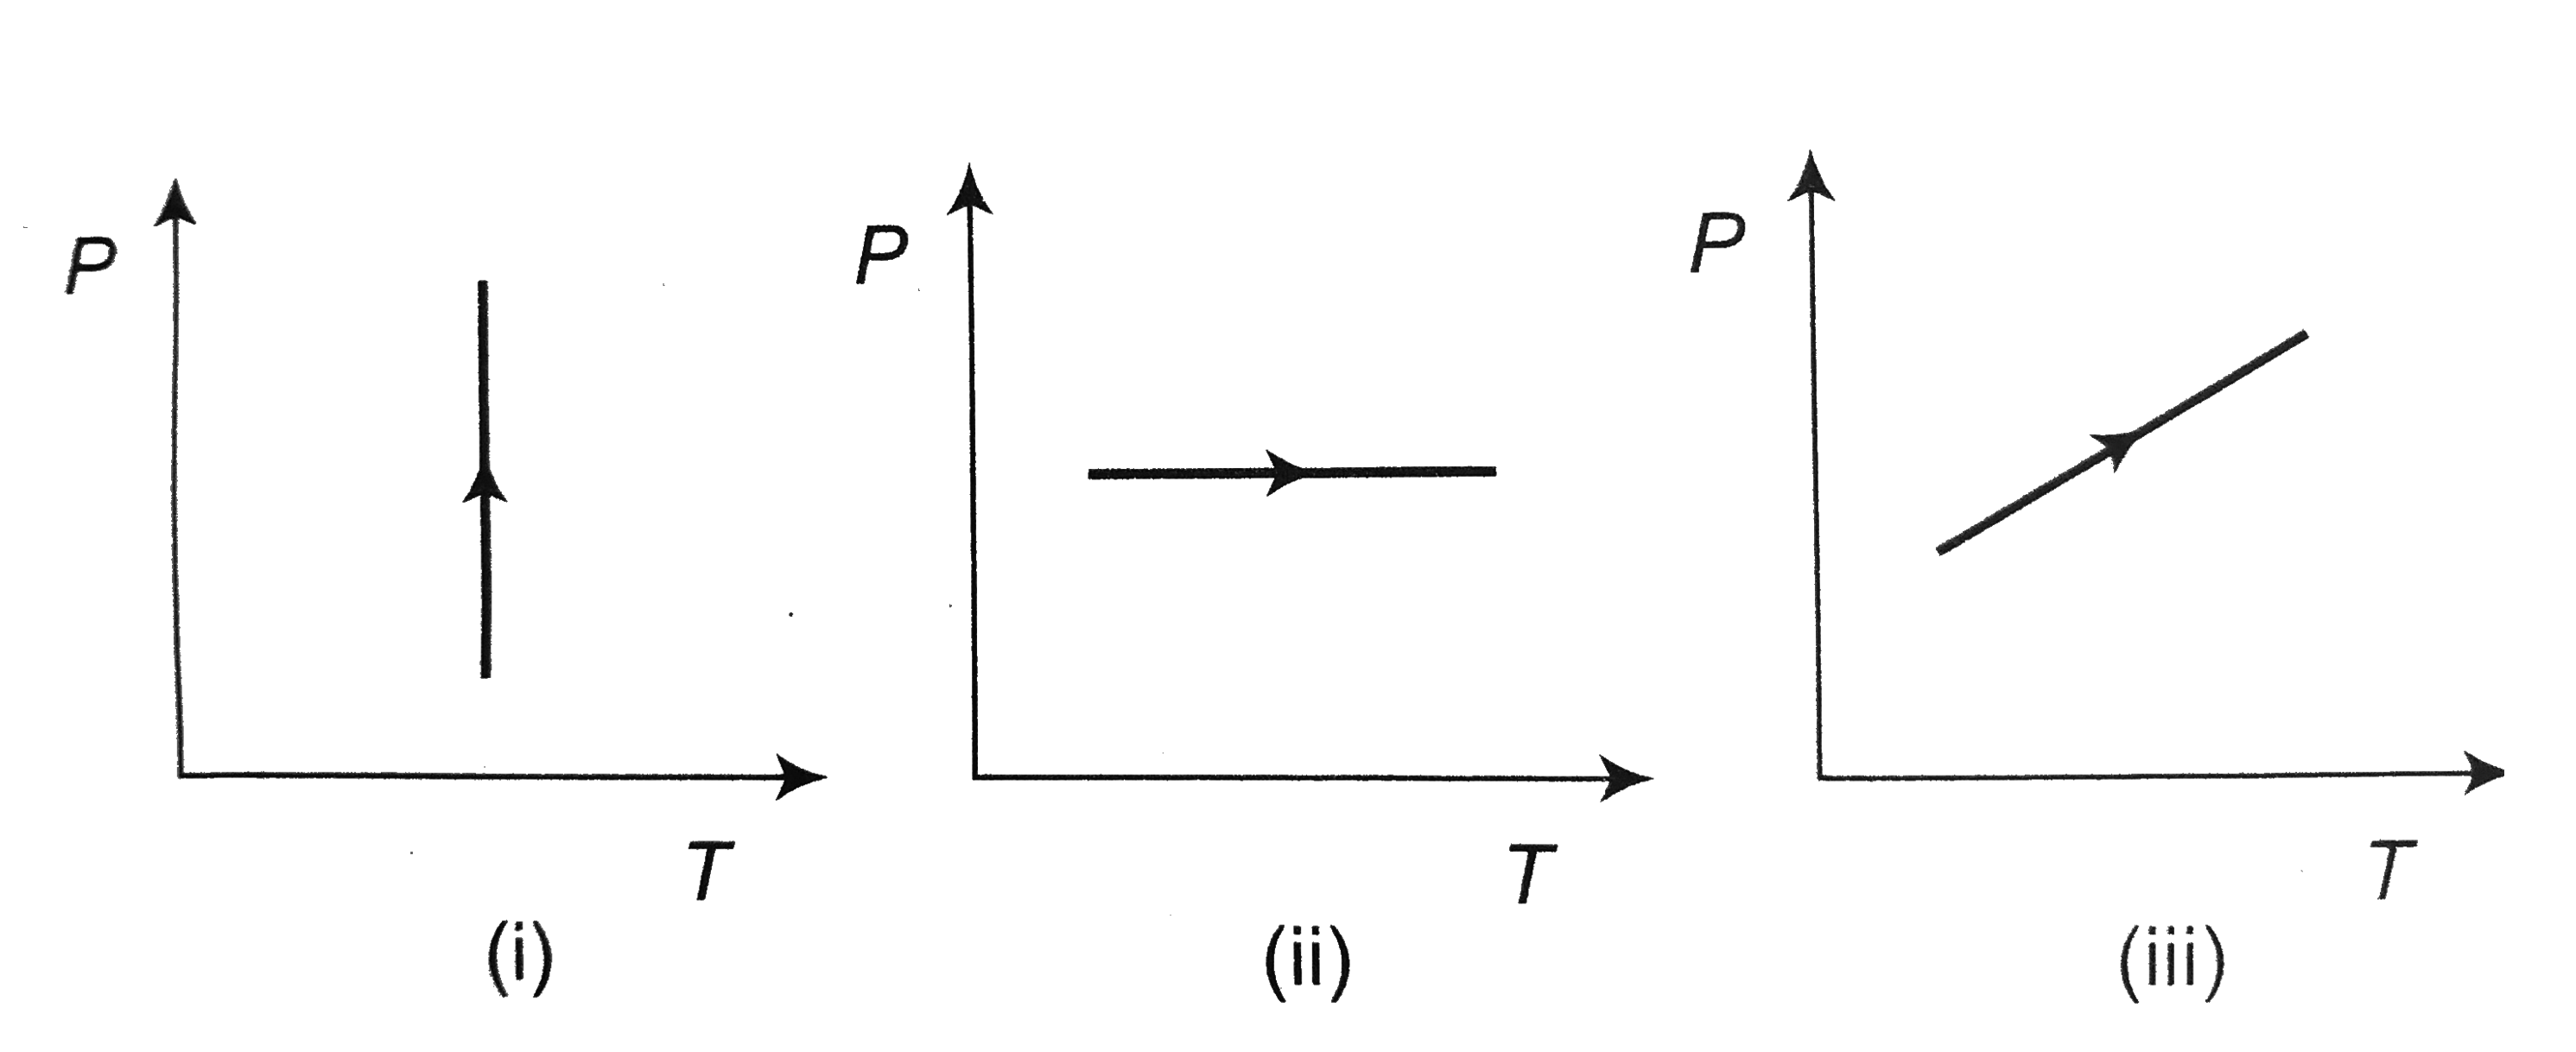
View SolutionPressure versus temperature graphs of an ideal gas are as shown in figure. Choose the wrong statement

View SolutionPressure versus temperature graph of an ideal gas as shown in Fig.
Corresponding density (ρ) versus volume (V) graph will be
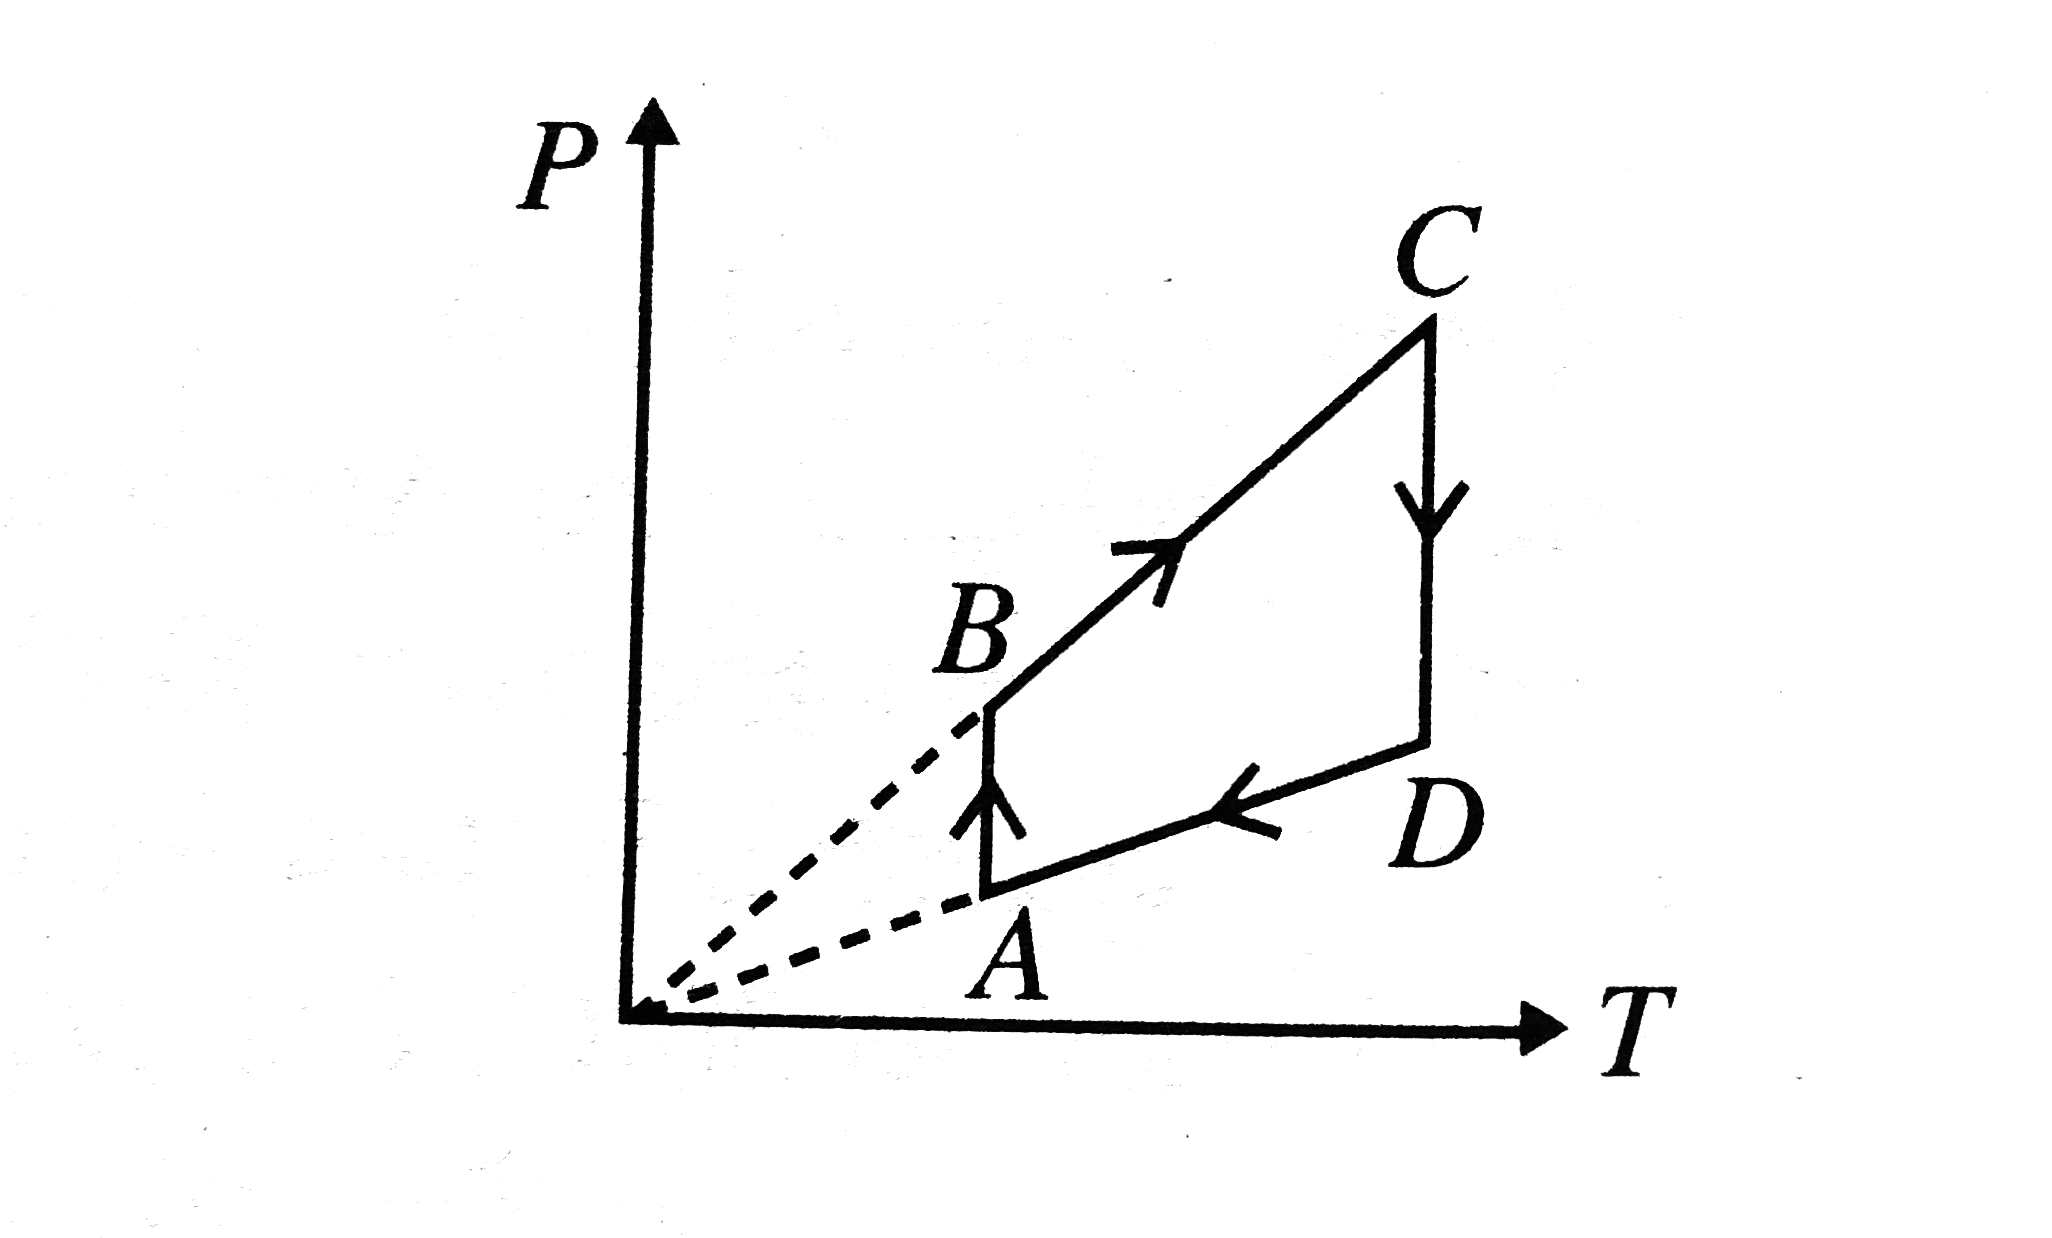
View SolutionPressure versus temperature graph of an ideal gas as shown in Fig.
Corresponding density (ρ) versus volume (V) graph will be

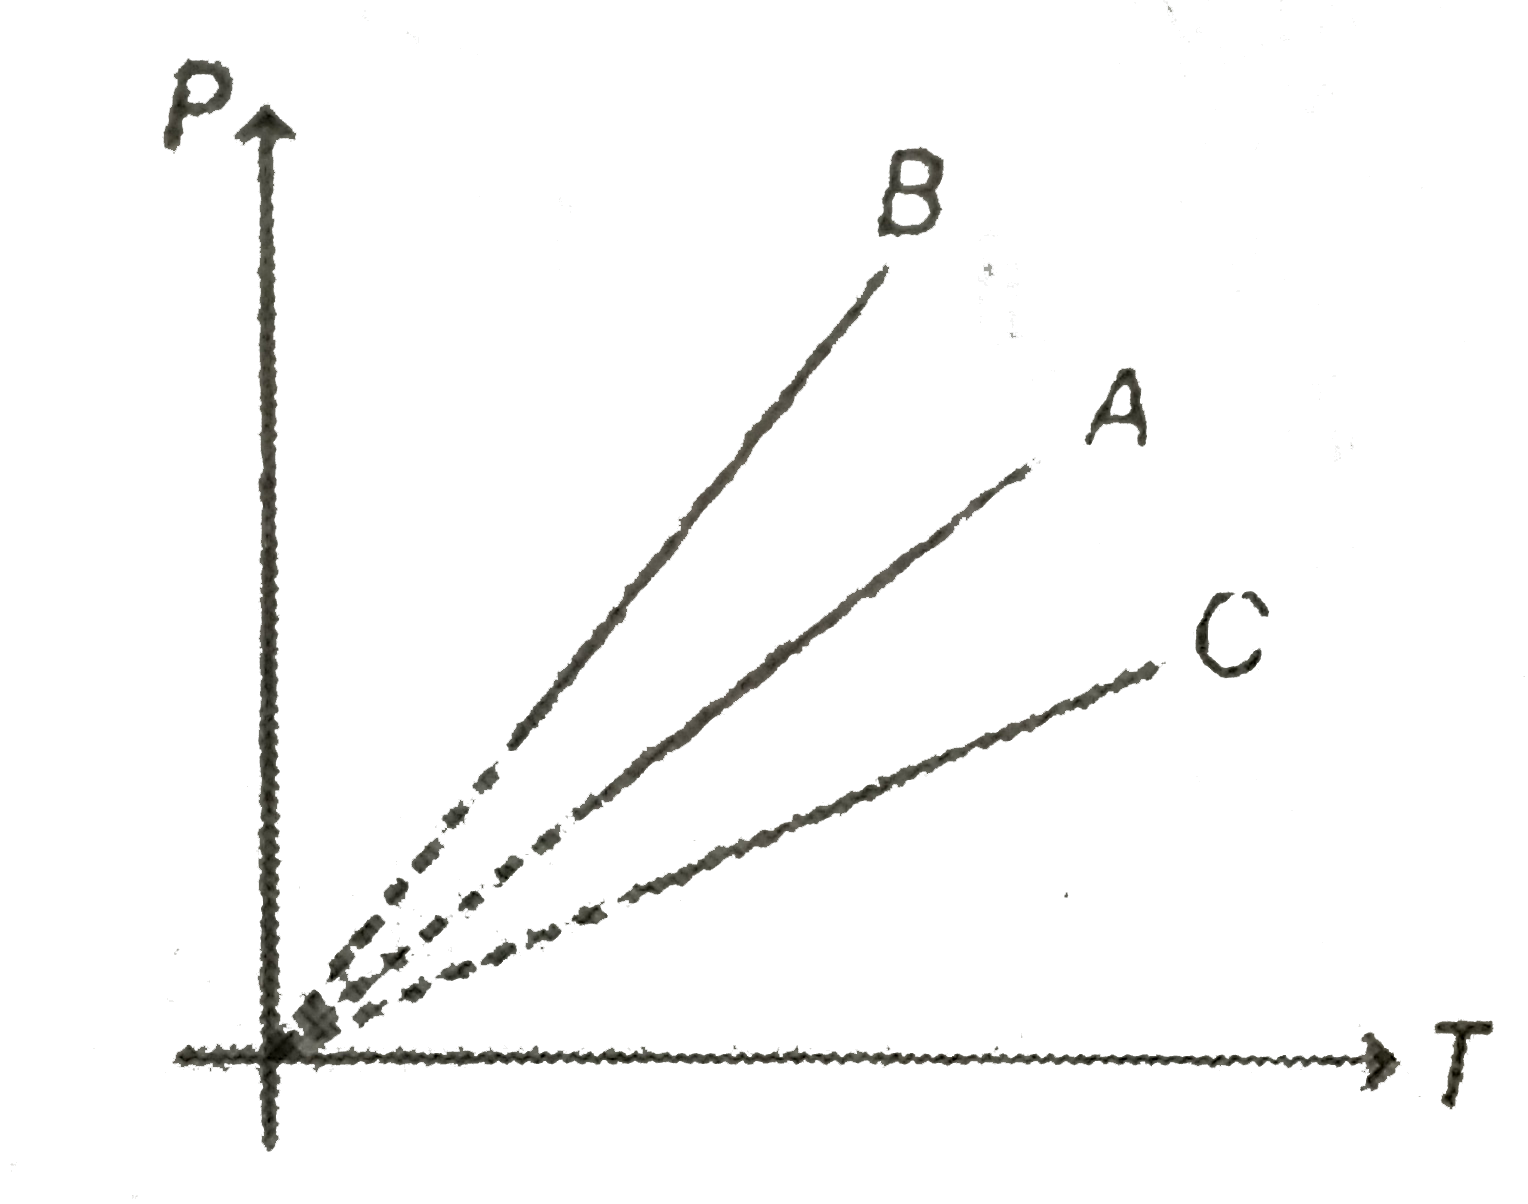
View SolutionPressure versus temperature graph of an ideal gas at constant volume V is shown by the straight line A. Now mass of the gas is doubled and the volume is halved, then the corresponding pressure versus temperature graph will be shown by the line
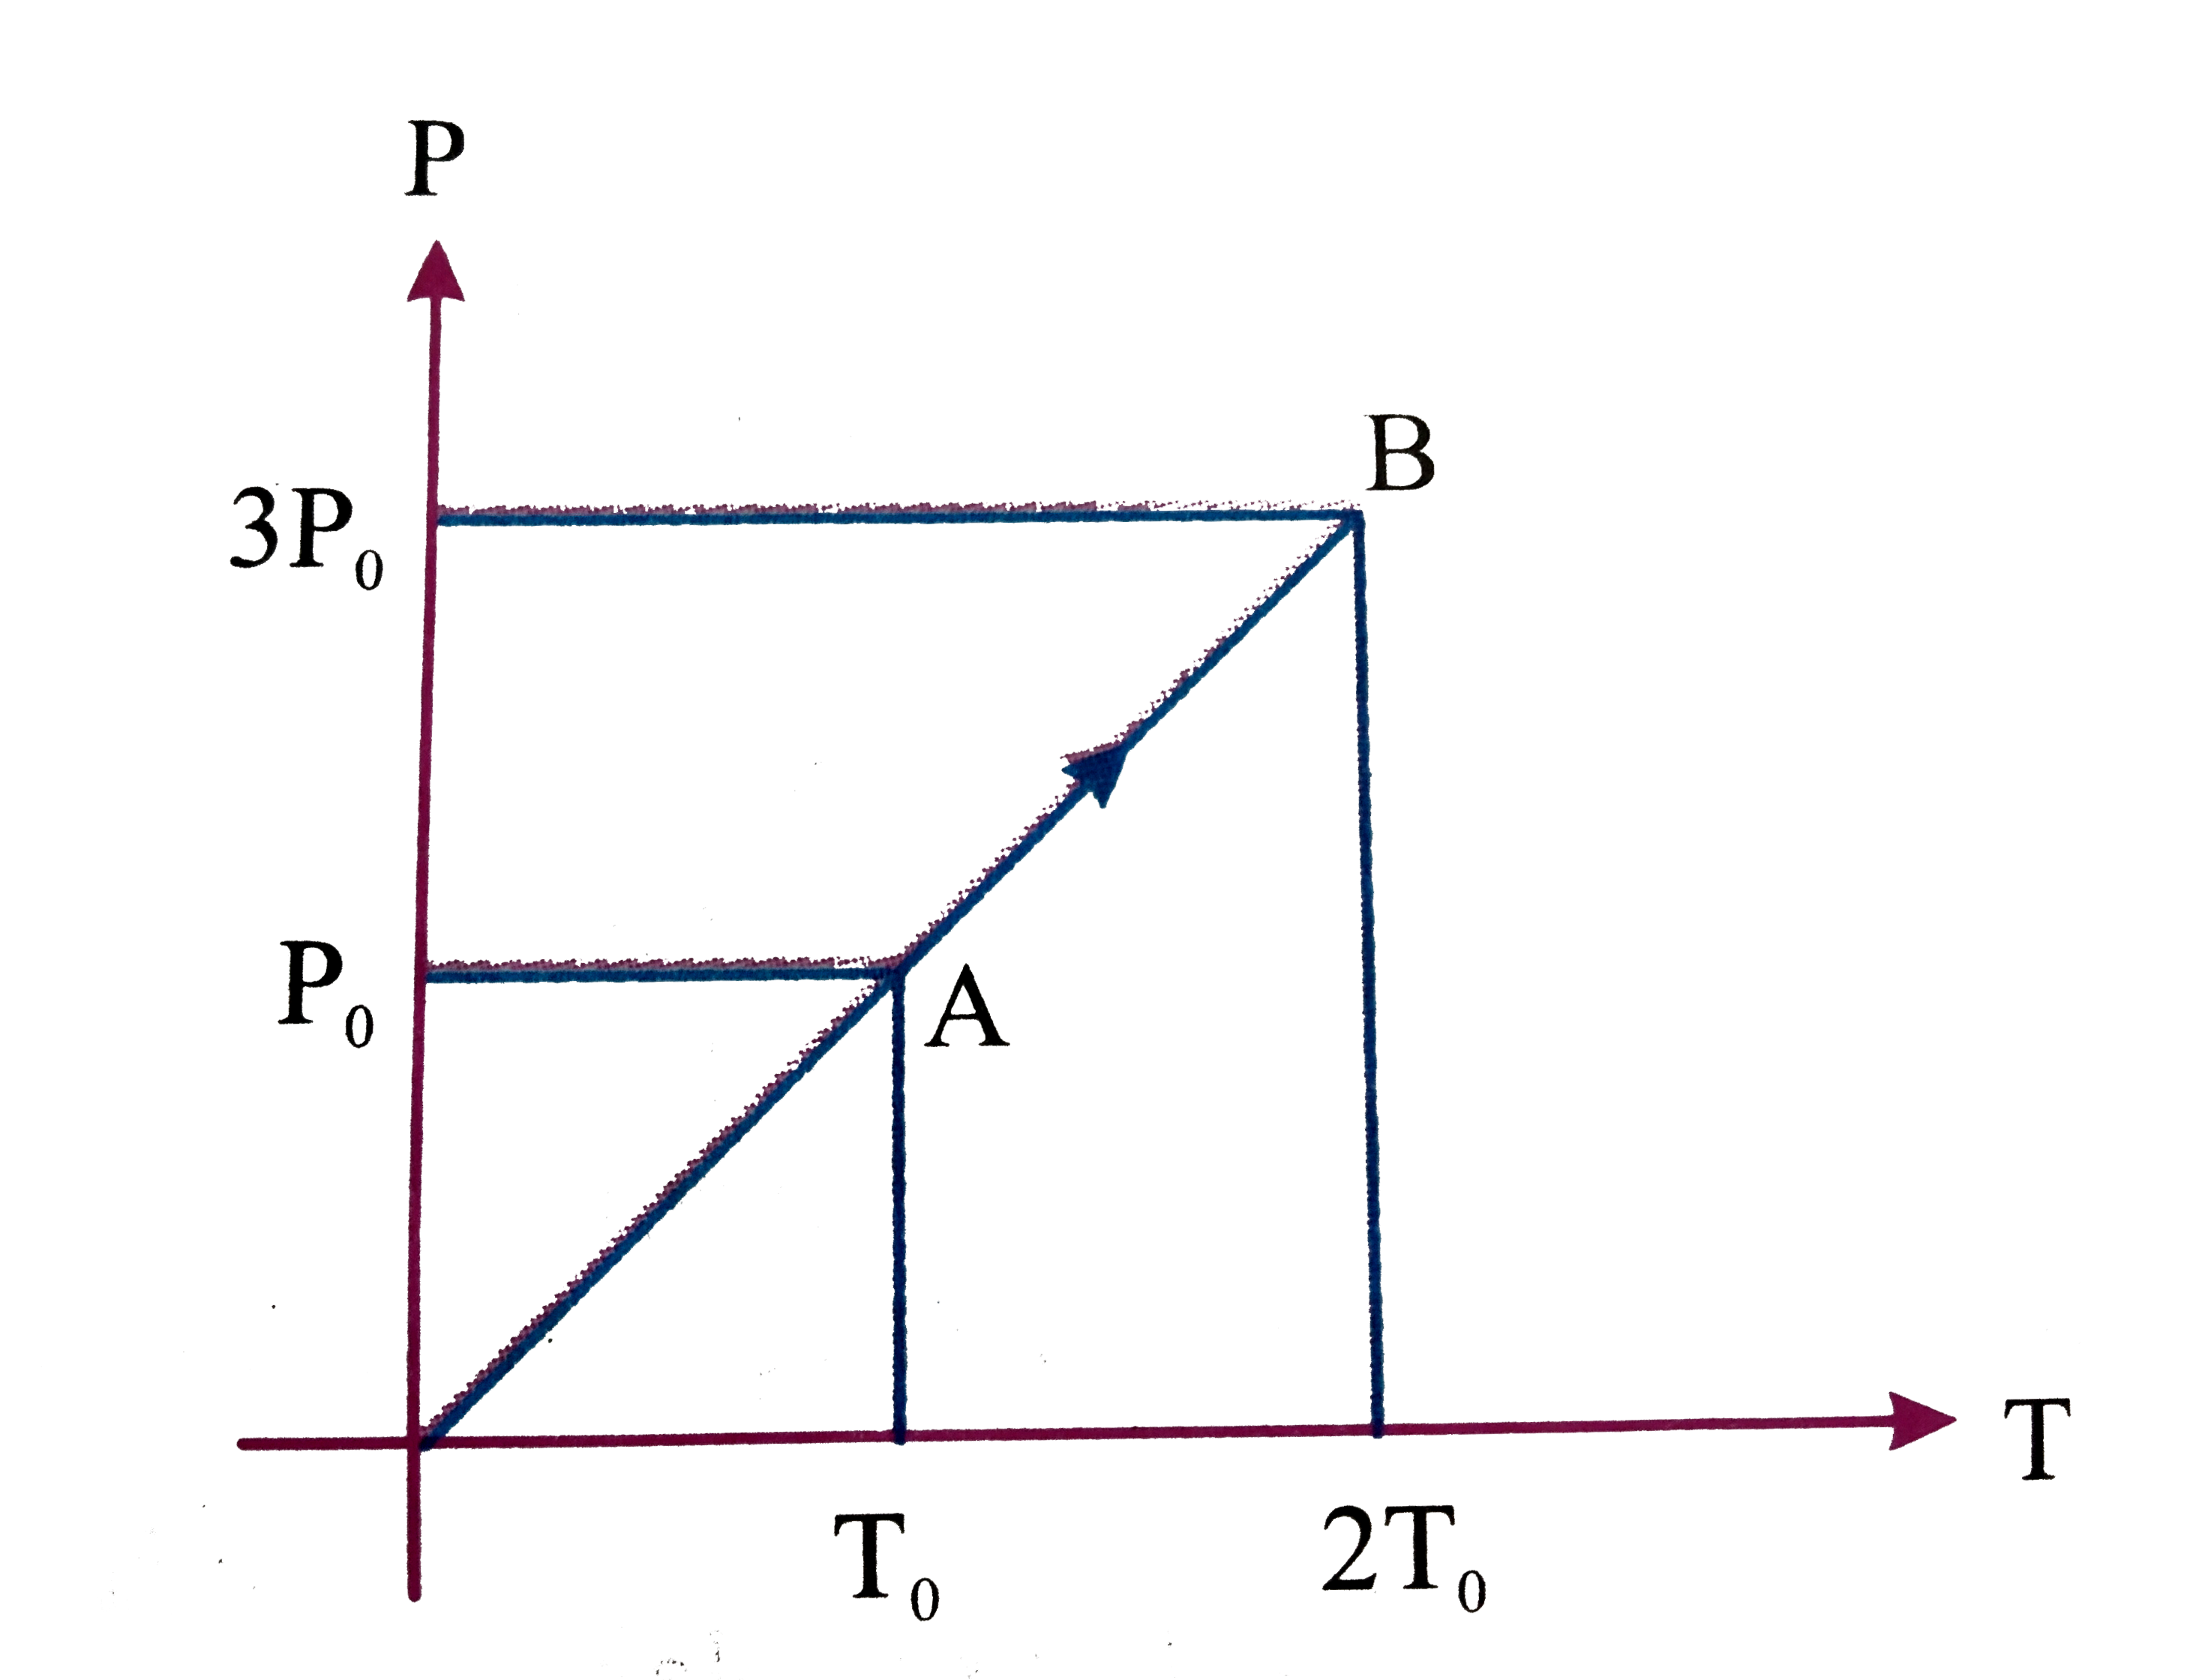
View SolutionPressure versus temperature graph of an ideal gas is shown in figure. Density of the gas at point A is ρ0. Density at B will be
View SolutionIf pressure and temperature of an ideal gas are doubled and volume is halved, the number of molecules of the gas
View Solution