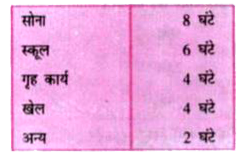
Draw a pie chart of the data given below:
The time spent by a child during a day.
School = 6 hoursSolution in Punjabi
Step by step video & image solution for Draw a pie chart of the data given below:The time spent by a child during a day.School = 6 hours by Maths experts to help you in doubts & scoring excellent marks in Class 8 exams.
Updated on:21/07/2023Topper's Solved these Questions
Similar Questions
Draw an appropriate graph to represent the given information.

View SolutionWhich of the following numbers are not perfect cubes?
392.
View SolutionThe cost of 5 metres of a particular quality of cloth is Rs 210. Tabulate the cost of 2, 4, 10 and 13 metres of cloth of the same type.
View SolutionThe number of hours spent by a school boy in different activities in a day is given below :

Represent the above information using a pie diagram.
View SolutionA pie diagram represents the number of hours spent by a school boy in different activites in a day. If 7 hours are spent in school, then what is the measure of the central angle?
View SolutionThe number of hours spent by a school boy in different activities in a day is given below:

Represent the above information using pie diagram.
View SolutionDraw a pie chart of the data given below. The times spent by a child during a day.

View Solutionनीचे दिए आँकड़ों के लिए एक पाई चार्ट खींचिए :
एक बच्चे द्वारा एक दिन में व्यतीत किया गया समय इस प्रकार है:

View SolutionThe time spent by a school student in a day is as follows Draw a circle graph for these data.
View Solutionस्कूल के एक छात्र द्वारा एक दिन में व्यतीत किया गया समय निम्न रूप हैं

इन आँकड़ों के लिए एक वृत्त आलेख खींचिए।
View SolutionDraw a pie chart for the following data.

View SolutionDraw a pie chart for the following data. Time spent by a child during a day-

View SolutionDraw a pie chart for the following data
View SolutionIn the time table of a school, the periods allotted for different subjects per week are given below? Draw a pie chart for these data.
View SolutionIn the time table of a school, periods allotted per week to different teaching subjects are given below:

Draw a pie chart for this data.
View Solution
