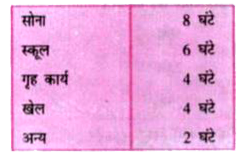
Draw a pie chart of the data given below:
The time spent by a child during a day.
Home work = 4 hours.Solution in Punjabi
Step by step video & image solution for Draw a pie chart of the data given below:The time spent by a child during a day.Home work = 4 hours. by Maths experts to help you in doubts & scoring excellent marks in Class 8 exams.
Topper's Solved these Questions
Similar Questions
Draw an appropriate graph to represent the given information.
 03:39View Solution
Which of the following numbers are not perfect cubes?
392.06:38View SolutionThe cost of 5 metres of a particular quality of cloth is Rs 210. Tabulate the cost of 2, 4, 10 and 13 metres of cloth of the same type.
04:19View SolutionThe number of hours, spent by a school boy on different activities in a working day, is given below: Activities, Sleep, School, Home, Play, others, Total No. Of hours, 8, 7, 4, 2, 3, 24 Present the information in the form of a pie-chart.
05:03View Solutionएक बच्चे द्वारा एक दिन में व्यतीत किया गया समय इस प्रकार है :
सोना -8 घंटे
स्कूल -6 घंटे
गृह कार्य -6 घंटे
खेल -2 घंटे
अन्य -2 घंटे
पाईचार्ट दर्शाइए |05:41View SolutionThe number of hours, spent by a school boy on different activities in a working day, is given below: Activities : Sleep, School, Home, Play, others, Total No. Of hours : 8,7,4,2,3,24 Present the information in the form of a pie-chart.
09:42View SolutionDraw a pie chart of the data given below. The times spent by a child during a day.
 03:10View Solution
नीचे दिए आँकड़ों के लिए एक पाई चार्ट खींचिए :
एक बच्चे द्वारा एक दिन में व्यतीत किया गया समय इस प्रकार है:
 03:52View Solution
Draw a pie chart for the following data.
 04:37View Solution
Draw a pie chart for the following data. Time spent by a child during a day-
 10:29View Solution
Draw a pie chart for the following data
03:12View SolutionIn the time table of a school, the periods allotted for different subjects per week are given below? Draw a pie chart for these data.
03:10View SolutionIn the time table of a school, periods allotted per week to different teaching subjects are given below:

Draw a pie chart for this data.03:14View SolutionDraw a pie chart of the data given below:
The time spent by a child during a day.
Sleep = 8 hours03:30View SolutionDraw a pie chart of the data given below:
The time spent by a child during a day.
School = 6 hours03:31View Solution

