A pie diagram represents the number of hours spent by a school boy in different activites in a day. If 7 hours are spent in school, then what is the measure of the central angle?
210∘
105∘
52.5∘
90∘
The correct Answer is:B
Step by step video, text & image solution for A pie diagram represents the number of hours spent by a school boy in different activites in a day. If 7 hours are spent in school, then what is the measure of the central angle? by Maths experts to help you in doubts & scoring excellent marks in Class 10 exams.
Updated on:21/07/2023Topper's Solved these Questions
- STATISTICSBook:TARGET PUBLICATIONChapter:STATISTICSExercise:Additional Problems for Practice
Explore 44 Videos
- STATISTICSBook:TARGET PUBLICATIONChapter:STATISTICSExercise:Apply your knowledge
Explore 5 Videos
- STATISTICSBook:TARGET PUBLICATIONChapter:STATISTICSExercise:Try this
Explore 2 Videos
- SIMILARITY Book:TARGET PUBLICATIONChapter:SIMILARITY Exercise:Chapter Assessment
Explore 19 Videos
- TRIGONOMETRY Book:TARGET PUBLICATIONChapter:TRIGONOMETRY Exercise:Chapter Assessment
Explore 18 Videos
Similar Questions
The number of hours spent by a school boy in different activities in a day is given below:

Represent the above information using pie diagram.
View SolutionThe number of hours spent by a school boy in different activities in a day is given below :

Represent the above information using a pie diagram.
View Solution
Knowledge Check
The pie chart shows the number of tigers in all the tiger wild life santuaries in the country. Study the diagram and answer the following questions.
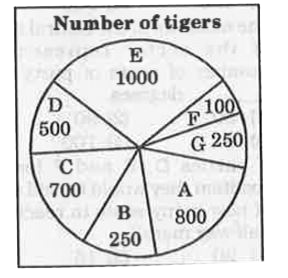
The measure of central angle of the sector representing the number of tigers in santuary E is ____ degrees.A80B120C90D100What is the difference between the funds acquired by school from NGO's and internal sources?
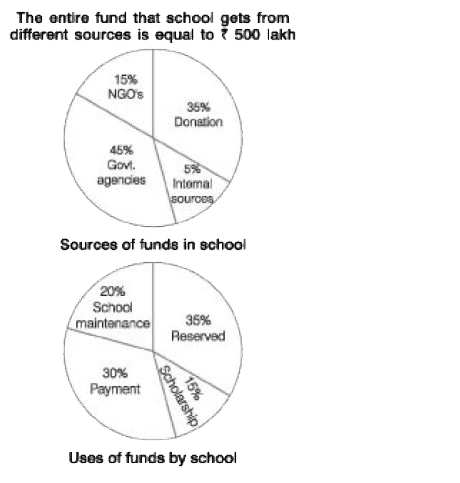 A2B3C4D8
In a pie diagram, the measure of central angle of the amount spent on education is 30∘. If Rs900 was spent on education, then what is the total expenditure?
ARs10800BRs108000CRs5400DRs54000
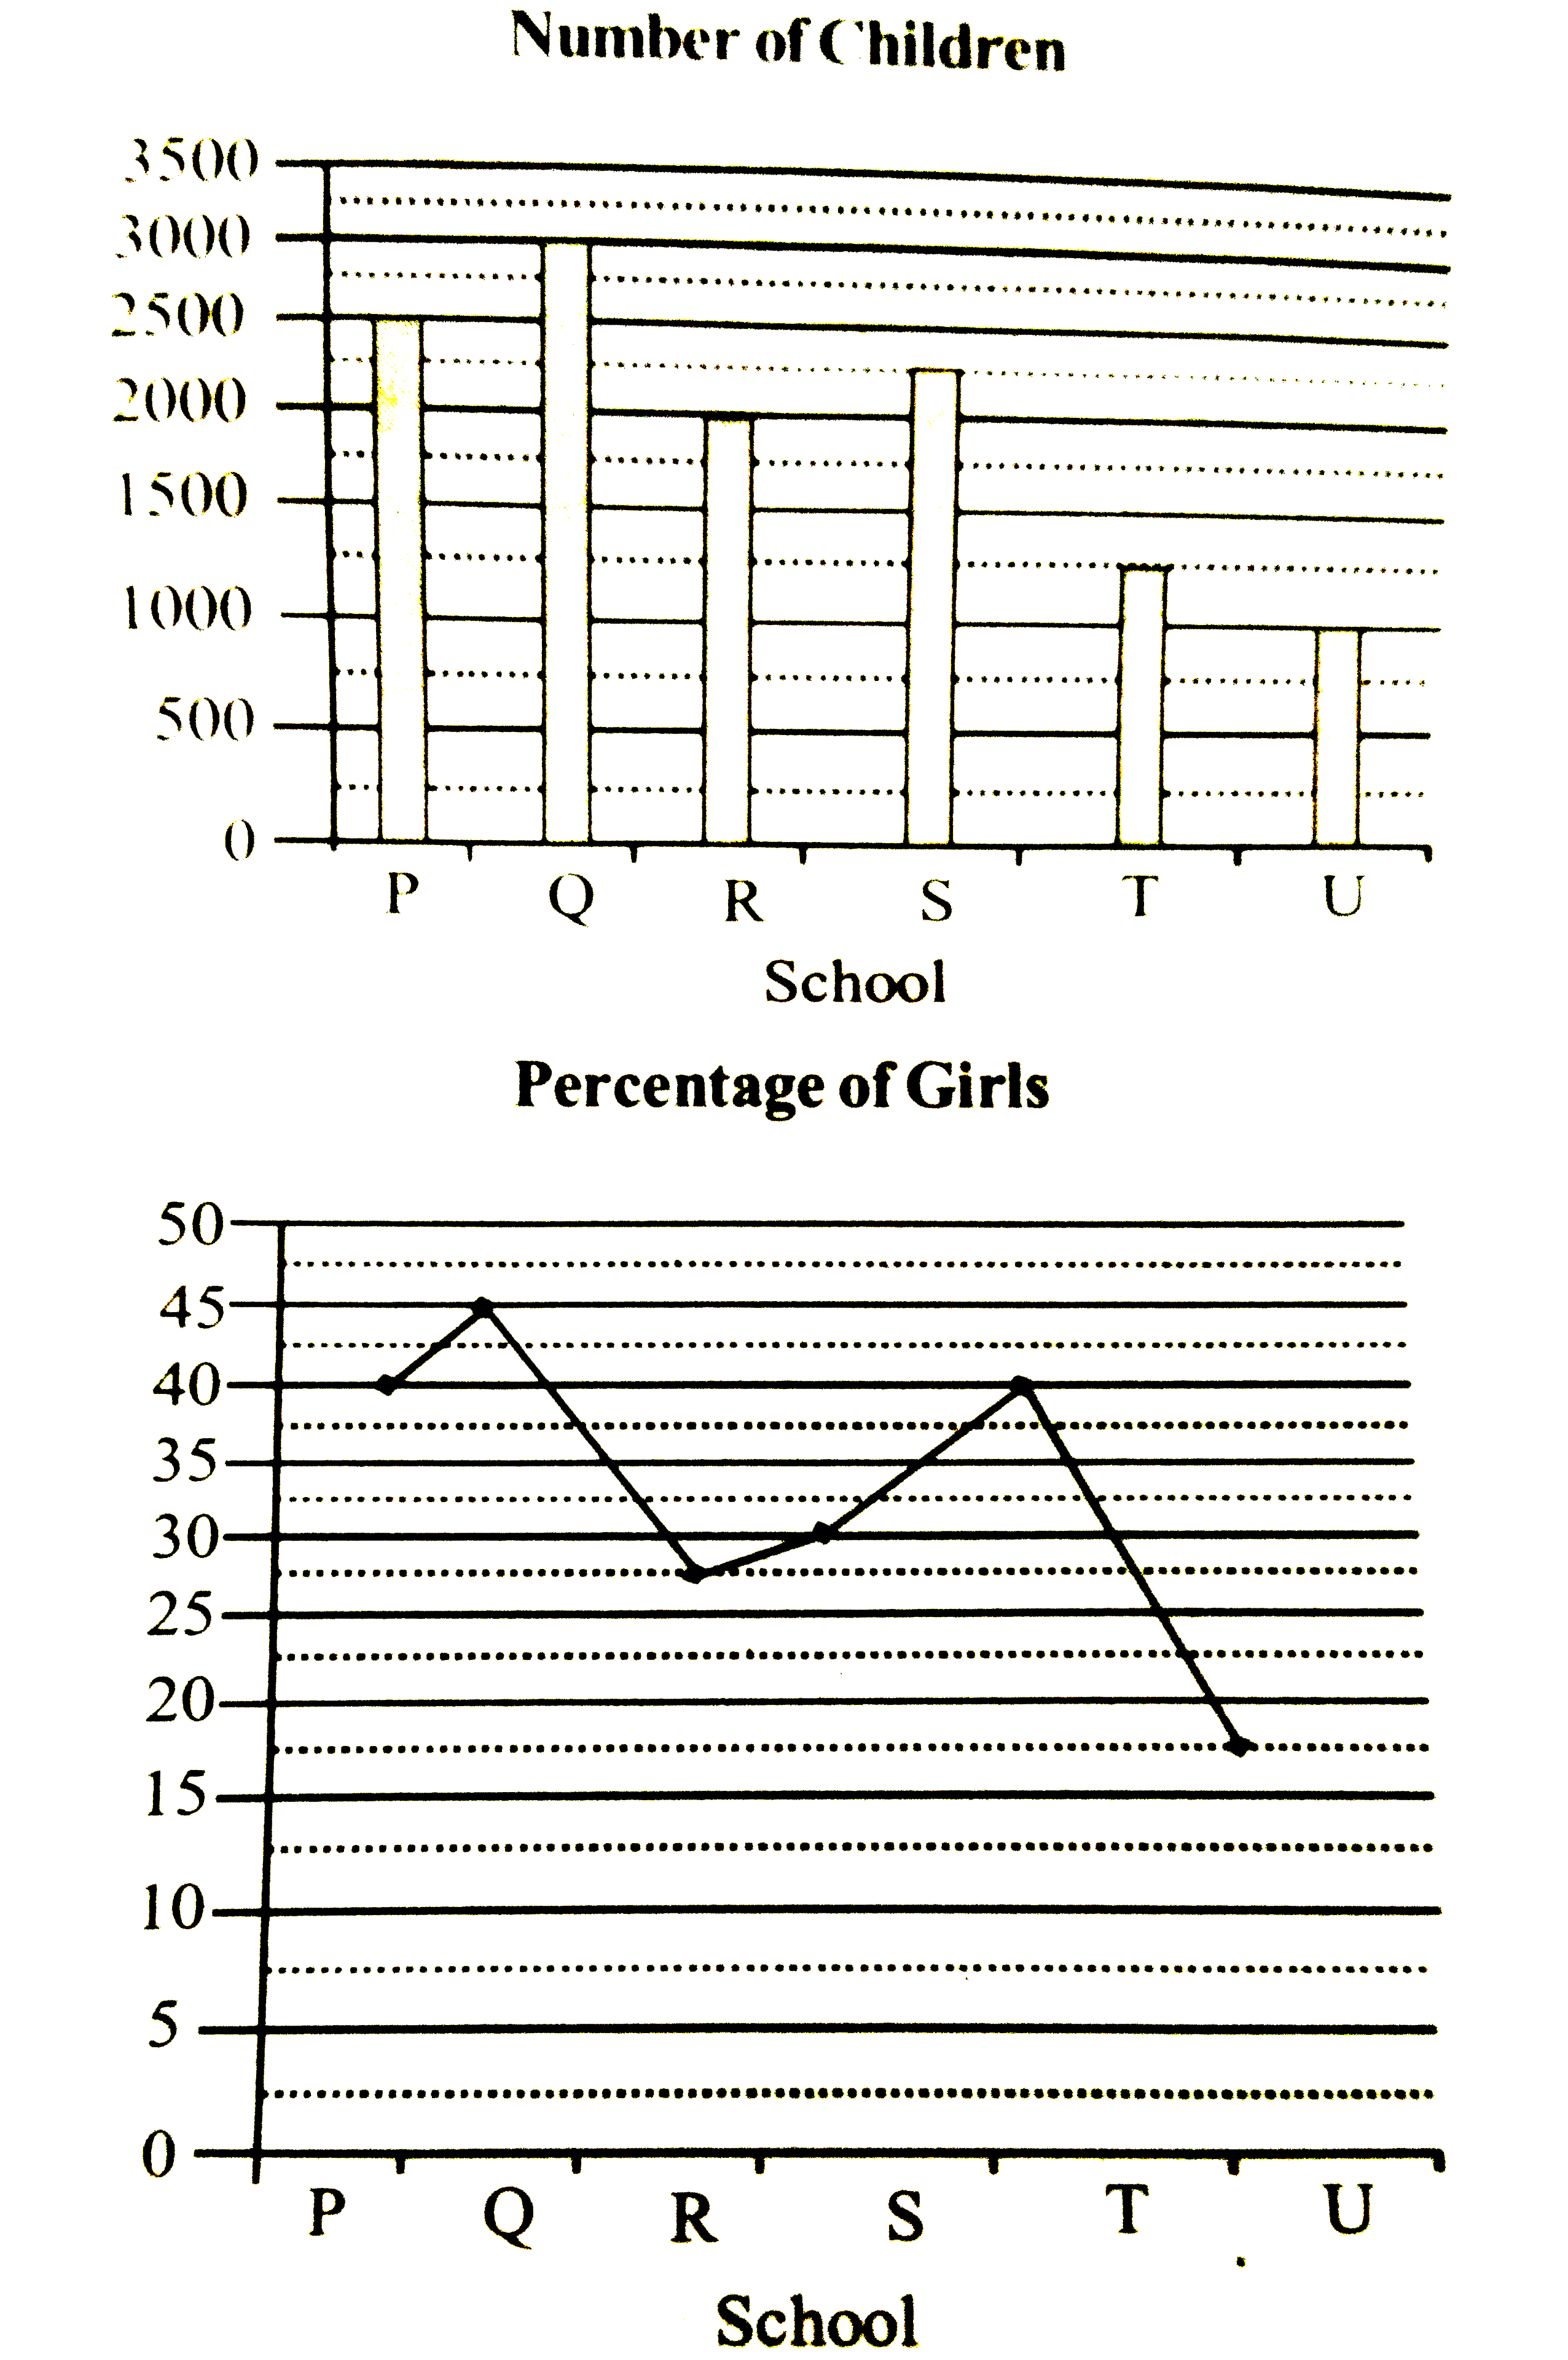
What is the number of boys in school P and Q together ?
View SolutionThe pie chart shows the number of leopards in all the leopard wild life sanctuaries in the country. Study the diagram and answer the following question.
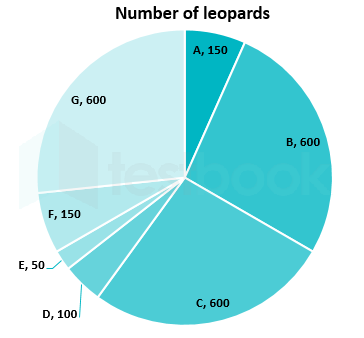
The measure of the central angle of the sector representing the number of leopards in Sanctuary B is ________ degrees.
View SolutionThe number of hours, spent by a school boy on different activities in a working day, is given below: Activities, Sleep, School, Home, Play, others, Total No. Of hours, 8, 7, 4, 2, 3, 24 Present the information in the form of a pie-chart.
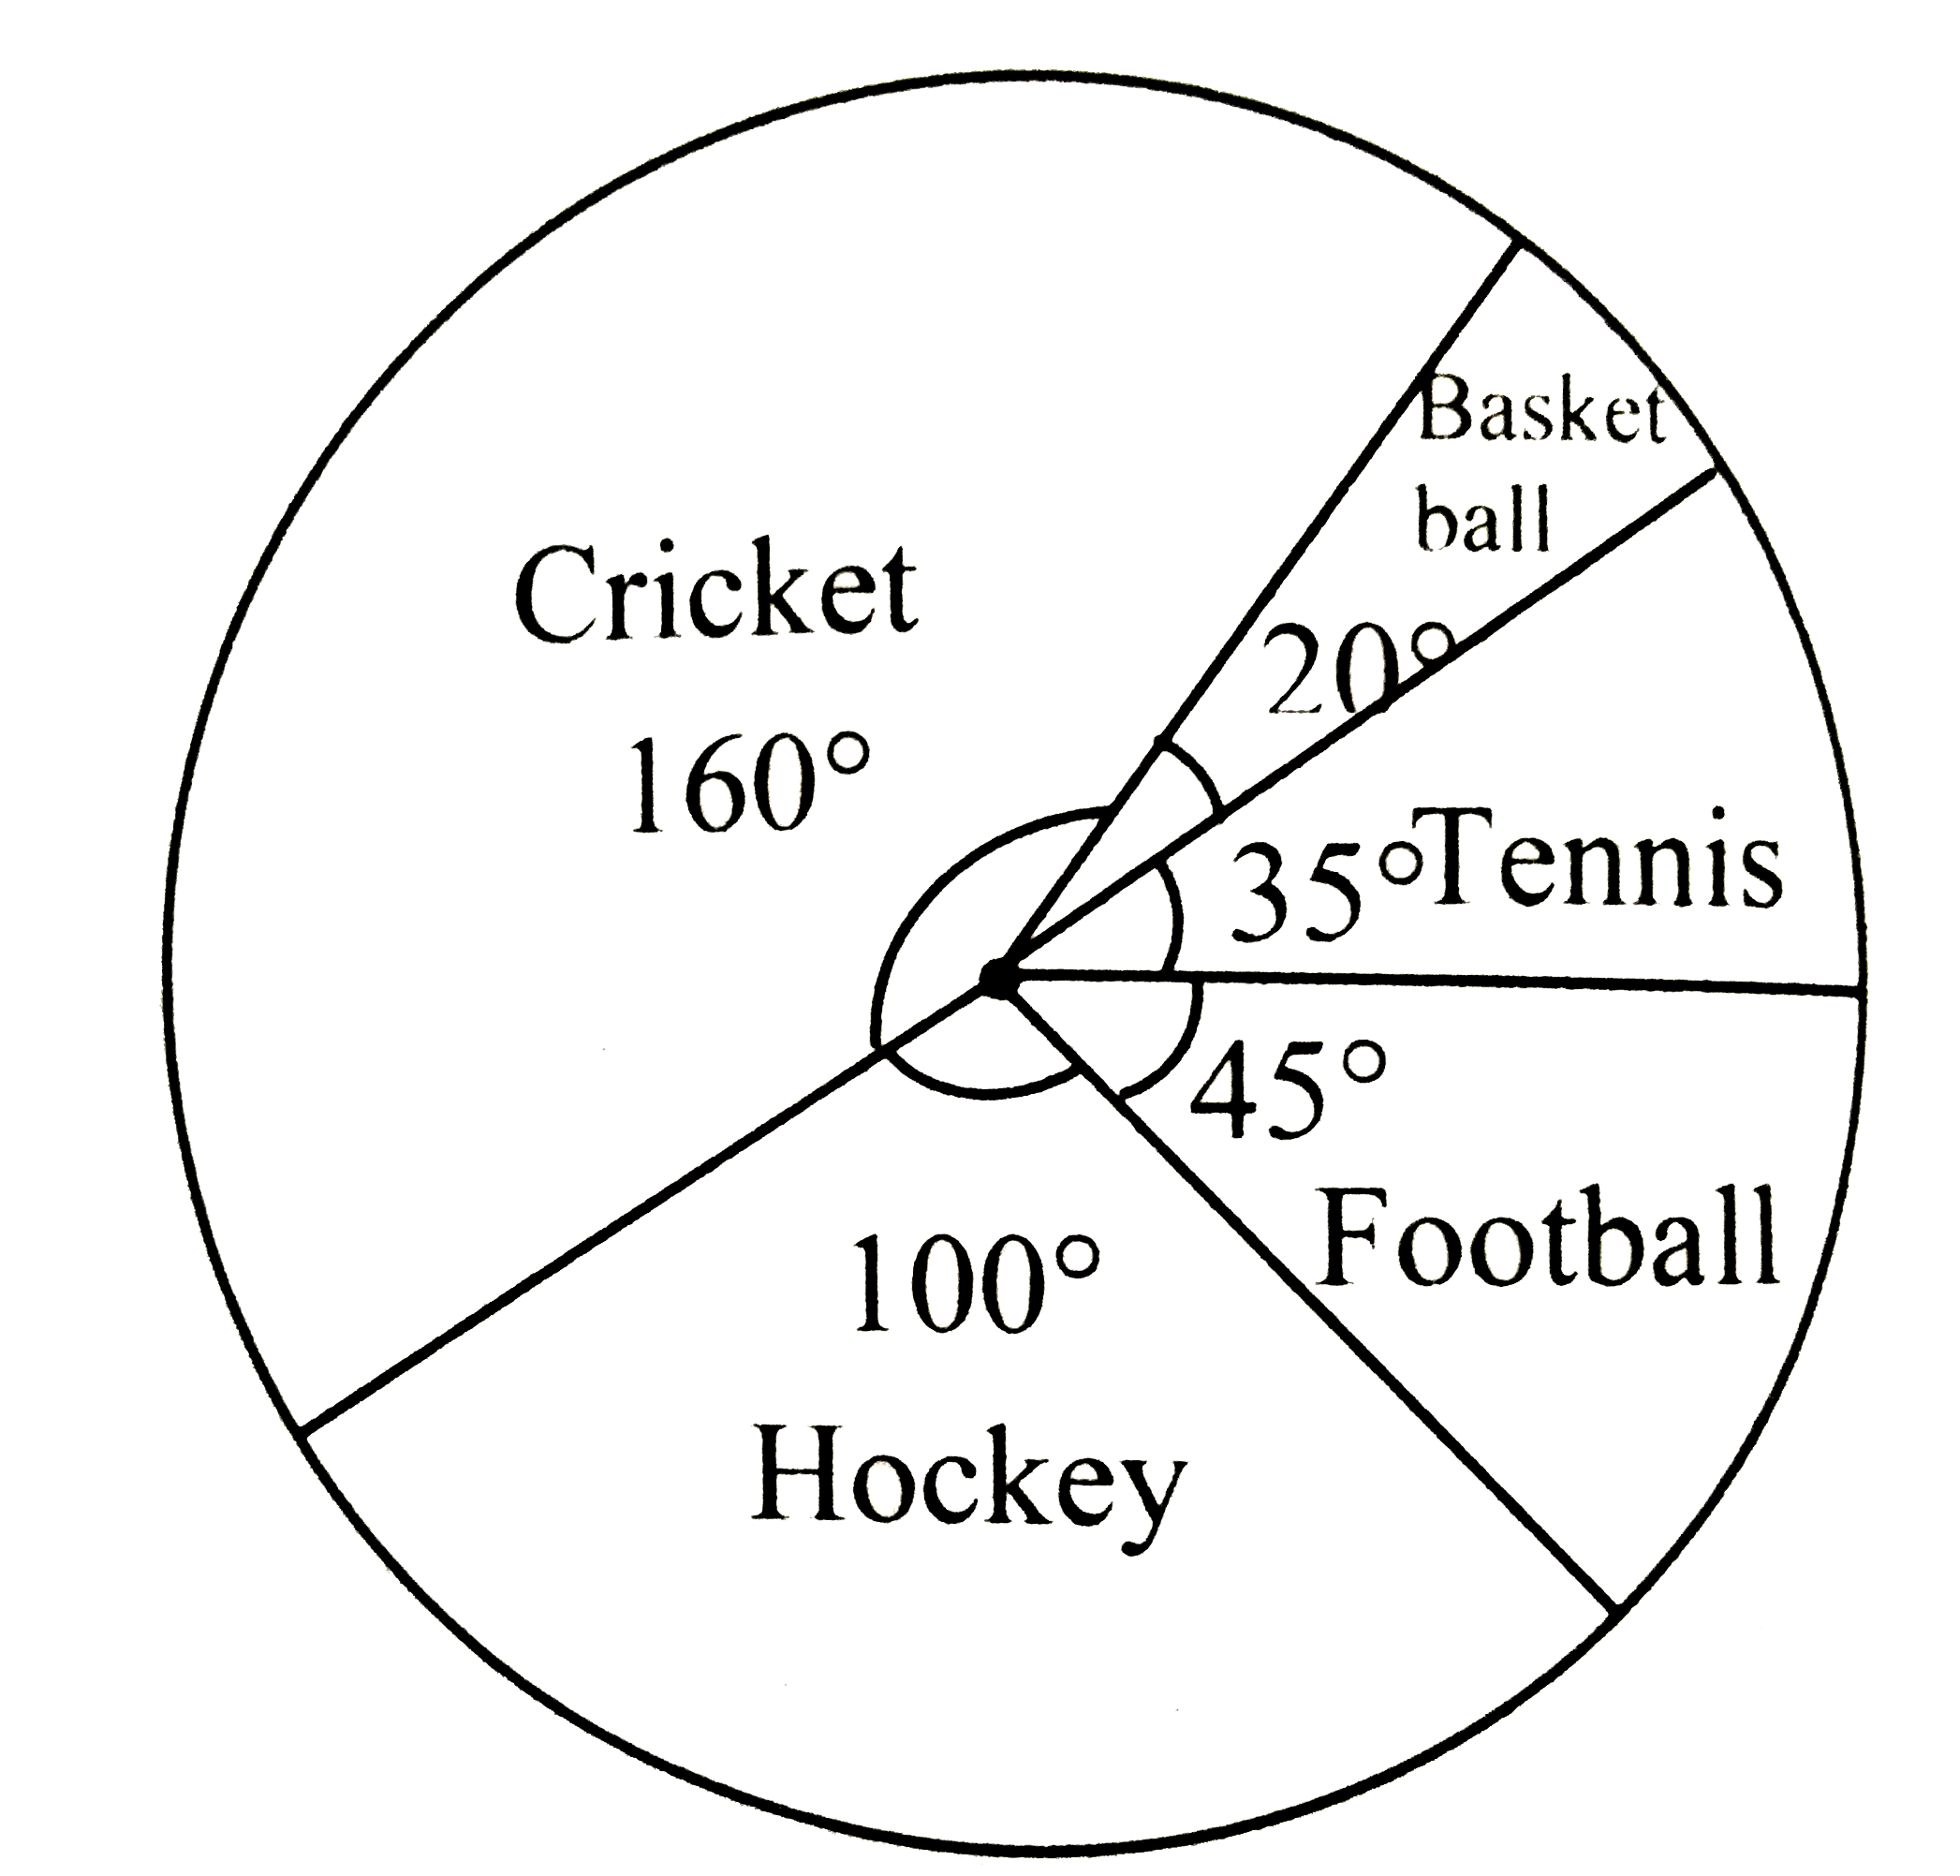
View SolutionThe pie diagram represents the amount spent on different sports by a school administration in a year. If the money spent on football is Rs9000, answer the following questions :
i. What is the total amount spent on sports?
ii. What is the amount spent on hockey?
iii. How much more amount is spent on tennis than on basket ball?
View SolutionThe given bar graph represents the number of boys and girls in five different schools. Read the graph and answer the question that follows.
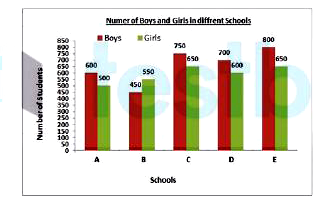
What is the average number of students (girls and boys) in schools A, B, C, D and E ?
View Solution

