What is the type of graph that would result between log(V) and log(T) at constant pressure?
To determine the type of graph that results between log(V) and log(T) at constant pressure, we can follow these steps:
1. Understand the Ideal Gas Law:
The ideal gas equation is given by:
PV=nRT
where P is the pressure, V is the volume, n is the number of moles, R is the universal gas constant, and T is the absolute temperature.
2. Set Pressure Constant:
Since we are looking for the relationship at constant pressure, we can rearrange the ideal gas equation to express volume in terms of temperature:
V=nRTP
Here, n, R, and P are constants.
3. Apply Charles' Law:
Charles' Law states that at constant pressure, the volume of a gas is directly proportional to its absolute temperature:
V∝T
This can be expressed as:
V=kT
where k is a constant.
4. Take the Logarithm of Both Sides:
To find the relationship between log(V) and log(T), we take the logarithm of both sides:
log(V)=log(kT)
This can be expanded using logarithmic properties:
log(V)=log(k)+log(T)
5. Rearrange the Equation:
Rearranging gives:
log(V)=log(T)+log(k)
This equation is in the form of a straight line y=mx+c, where:
- y=log(V)
- m=1 (the slope)
- x=log(T)
- c=log(k) (the y-intercept)
6. Conclusion:
The graph of log(V) versus log(T) at constant pressure will be a straight line with a slope of 1 and a y-intercept of log(k).
Final Answer:
The type of graph that results between log(V) and log(T) at constant pressure is a straight line.
The ideal gas equation is given by:
PV=nRT
where P is the pressure, V is the volume, n is the number of moles, R is the universal gas constant, and T is the absolute temperature.
Since we are looking for the relationship at constant pressure, we can rearrange the ideal gas equation to express volume in terms of temperature:
V=nRTP
Here, n, R, and P are constants.
Charles' Law states that at constant pressure, the volume of a gas is directly proportional to its absolute temperature:
V∝T
This can be expressed as:
V=kT
where k is a constant.
To find the relationship between log(V) and log(T), we take the logarithm of both sides:
log(V)=log(kT)
This can be expanded using logarithmic properties:
log(V)=log(k)+log(T)
Rearranging gives:
log(V)=log(T)+log(k)
This equation is in the form of a straight line y=mx+c, where:
- y=log(V)
- m=1 (the slope)
- x=log(T)
- c=log(k) (the y-intercept)
The graph of log(V) versus log(T) at constant pressure will be a straight line with a slope of 1 and a y-intercept of log(k).
The type of graph that results between log(V) and log(T) at constant pressure is a straight line.
Topper's Solved these Questions
- STATES OF MATTERBOOK - VMC MODULES ENGLISHCHAPTER - STATES OF MATTEREXERCISE - PRACTICE EXERCISE-4
2 Videos
- STATES OF MATTERBOOK - VMC MODULES ENGLISHCHAPTER - STATES OF MATTEREXERCISE - PRACTICE EXERCISE-5
3 Videos
- STATES OF MATTERBOOK - VMC MODULES ENGLISHCHAPTER - STATES OF MATTEREXERCISE - PRACTICE EXERCISE-2
3 Videos
- STATES OF MATTERBOOK - VMC MODULES ENGLISHCHAPTER - STATES OF MATTEREXERCISE - IMPECCABLE
50 Videos
- STOICHIOMETRY - IBOOK - VMC MODULES ENGLISHCHAPTER - STOICHIOMETRY - IEXERCISE - JEE Advanced (Archive)
31 Videos
Similar Questions
What is the type of graph between log P and log V at constant temperature?
View SolutionWhat is the type of graph between log P and log(1V) at constant temperature for a given amount of gas ?
View SolutionThe slope of the graph between log P and log V at constant temperature for a given mass of gas is
View SolutionA graph is plotted between logV and logT for 2mol of gas at constant pressure of 0.0821atm. V and T are in litre and K. Which of the following statements are not correct?
(I) The curve is straight line with slope −1.
(II) The curve is straight line with slope +1.
(III) The intercepet on Y−axis is equal to 2.
(IV) The intercepet on Y−axis is equal to 0.3010.
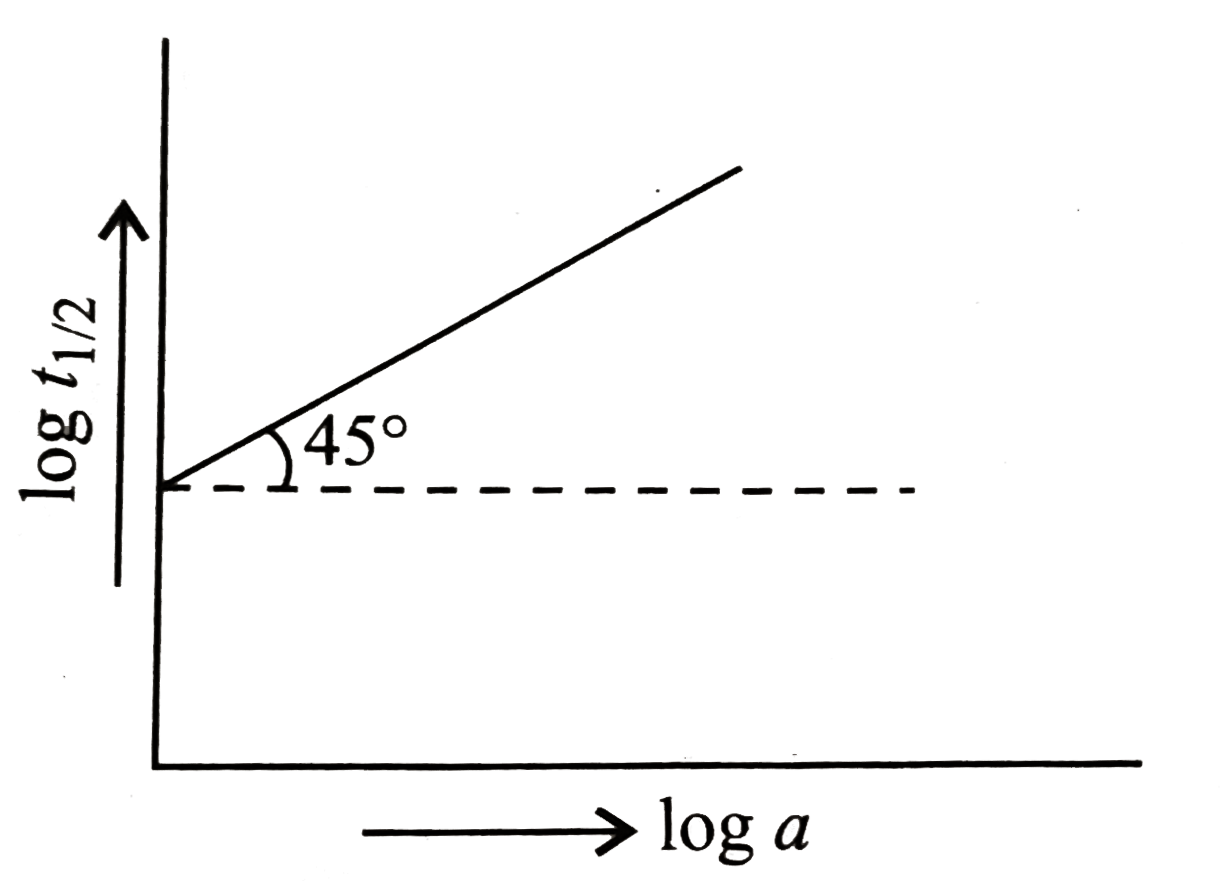
View SolutionFollowing is the graph between logT50 and loga (a= initial concentration) for a given reaction at 27∘C. Hence order is

View SolutionFollowing is the graph between logt1/2 and loga (a initial concentration) for a given reaction at 300K

Find the order of reaction.
View SolutionWhich one of the following relationships when graphed does not give a straight line for helium gas?
I. K.E. and T at constant pressure and volume
II. P v/s V at constant temperature for a constant mass
III. V v/s 1/T at constant pressure for a constant mass
View SolutionThe current curve between logejT2 and lT
View SolutionAt constant temperature if a graph plotted between logP and log(1V) has an intercept of unity then what will be the value of constant (k)
View SolutionDraw a graph of logP and log(1/V) for a fixed amount of gas at constant temperature.
View Solution
