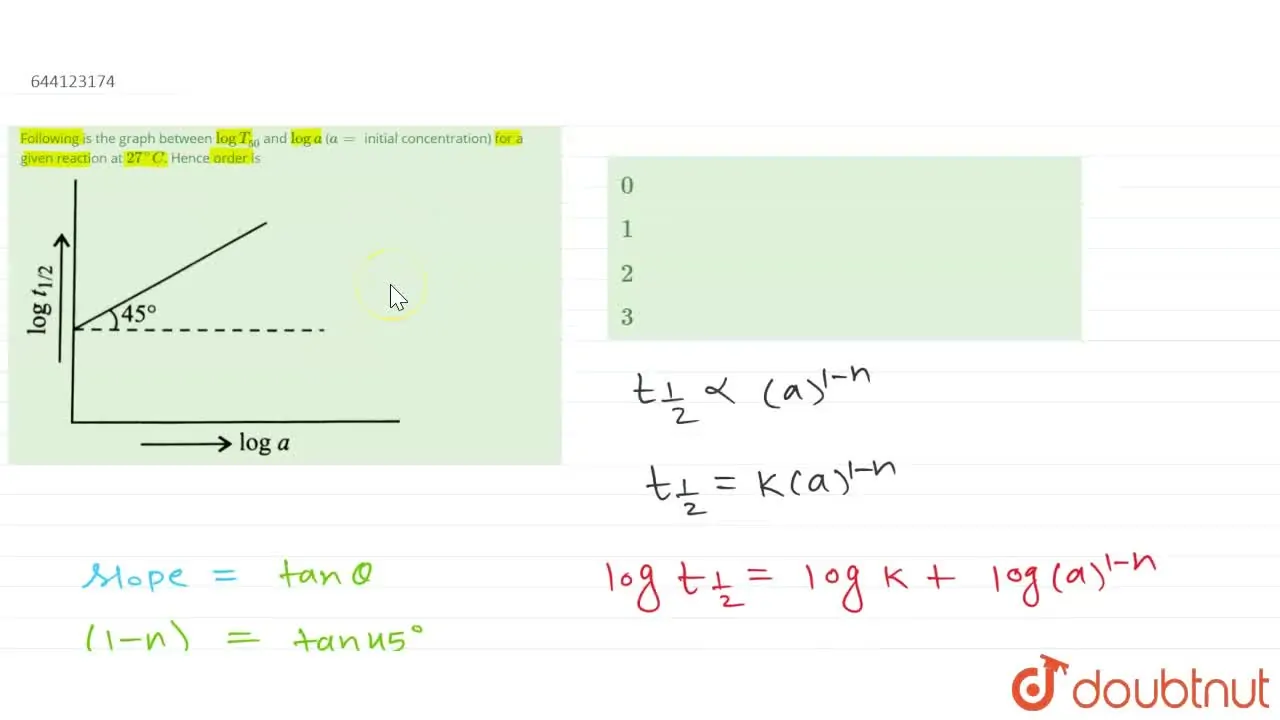
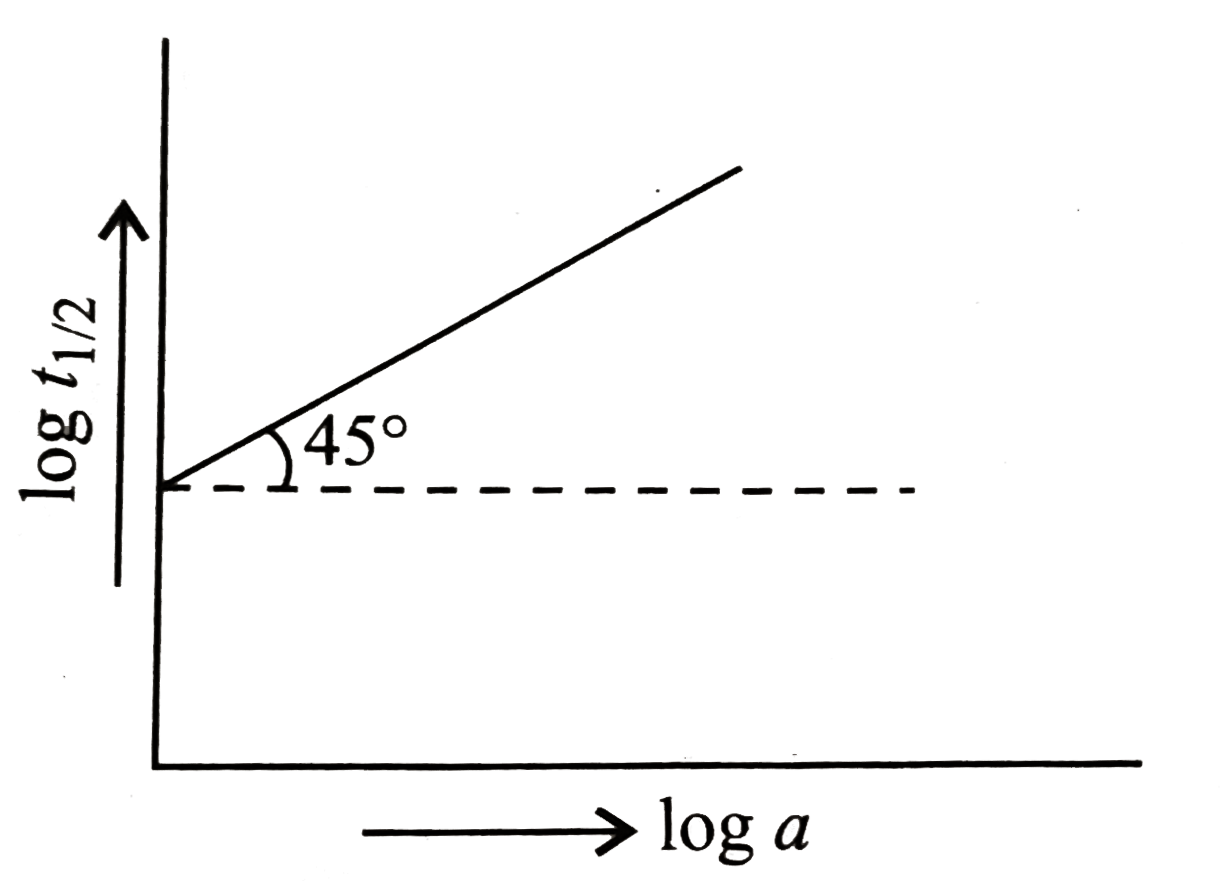
Following is the graph between logT50 and loga (a= initial concentration) for a given reaction at 27∘C. Hence order is
0
1
2
3
The correct Answer is:A
t1/2∝(1a)n−1ort1/2=k(a)1−n
log.t1/2=logk+(1−n)loga(y=c+mx)
Slope =(1−n)=tan45=1
∴(1−n)=1⇒n=0
Related Playlists
- BOOK - CENGAGE CHEMISTRY ENGLISHCHAPTER - CHEMICAL KINETICSEXERCISE - Exercises Assertion-Reasoning22videos
CHEMICAL KINETICS
- BOOK - CENGAGE CHEMISTRY ENGLISHCHAPTER - CHEMICAL KINETICSEXERCISE - Exercises Integer15videos
CHEMICAL KINETICS
- BOOK - CENGAGE CHEMISTRY ENGLISHCHAPTER - CHEMICAL KINETICSEXERCISE - Exercises Multiple Correct33videos
CHEMICAL KINETICS
- BOOK - CENGAGE CHEMISTRY ENGLISHCHAPTER - CARBOXYLIC ACIDS AND THEIR DERIVATIVESEXERCISE - Exercises Archives (Analytical And Descriptive)34videos
CARBOXYLIC ACIDS AND THEIR DERIVATIVES
- BOOK - CENGAGE CHEMISTRY ENGLISHCHAPTER - COORDINATION COMPOUNDSEXERCISE - Archives Subjective18videos
COORDINATION COMPOUNDS
Similar Questions
Following is the graph between logt1/2 and loga (a initial concentration) for a given reaction at 300K

Find the order of reaction.View SolutionThe slope of the graph between log P and log V at constant temperature for a given mass of gas is
View SolutionWhat is the type of graph between log P and log V at constant temperature?
View SolutionWhat is the type of graph between log P and log(1V) at constant temperature for a given amount of gas ?
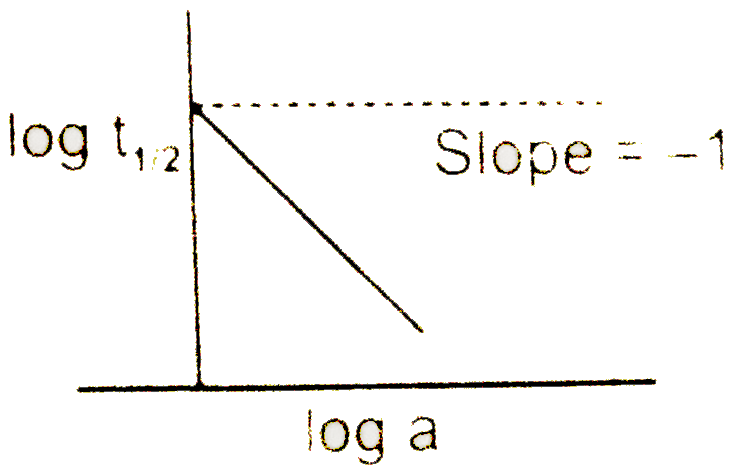
View SolutionA graph between logt12 and log a (abscissa), a being the initial concentration of A in the reaction For reaction A→Product, the rate law is :
 View Solution
A graph between logt12 and log a (abscissa), a being the initial concentration of A in the reaction For reaction A→Product, the rate law is :
 View Solution
The graph between log t1/2 and log a at a given temperature is
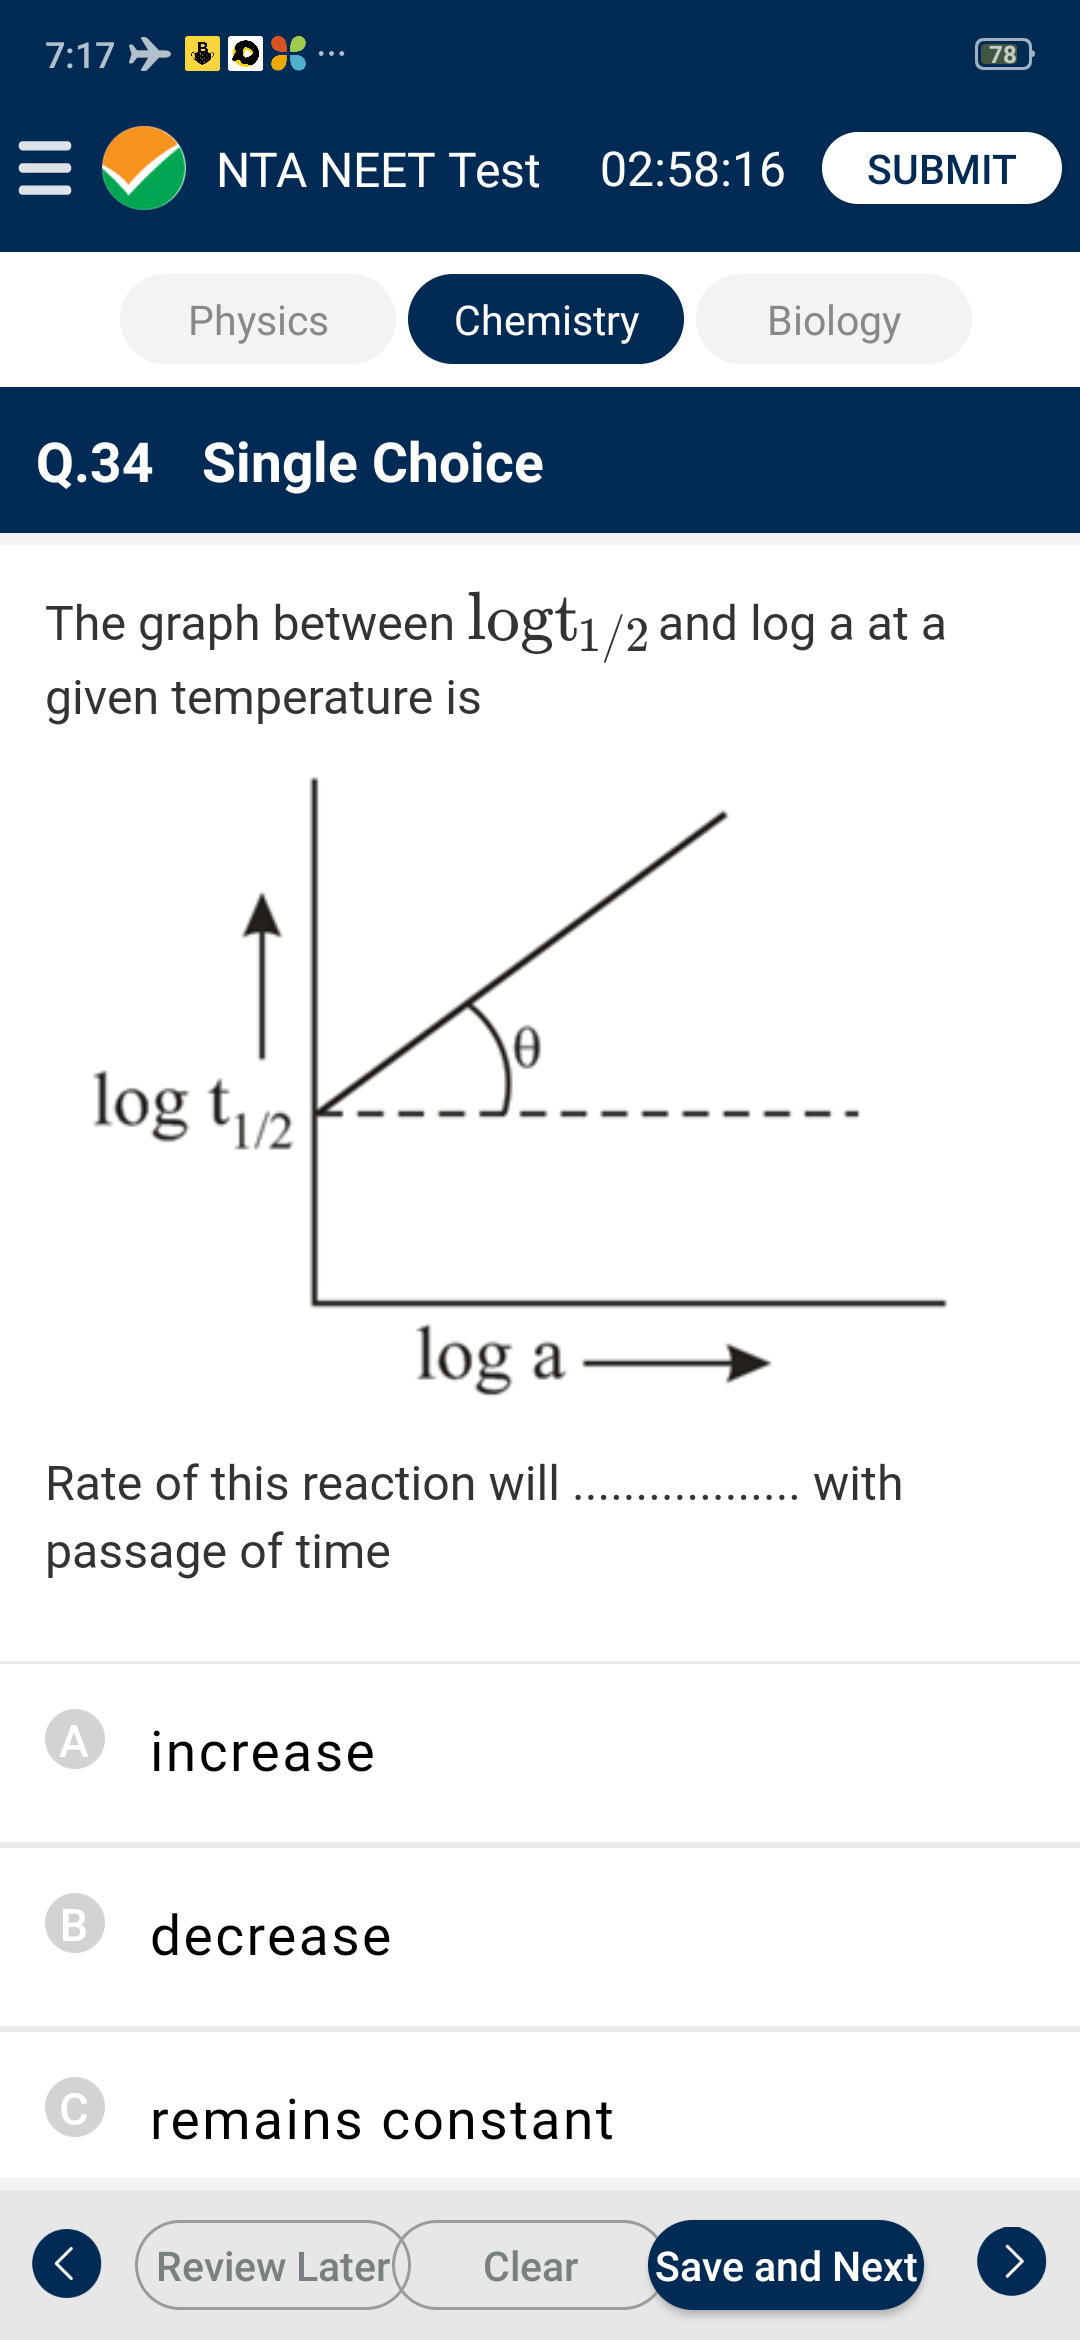
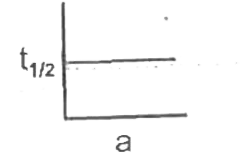
Rate of this reaction will …….with passage of timeView SolutionThe graph of t1/2 versus initial concentration 'a' is for
 View Solution
log KpKc+log RT=0 is a relationship for the reaction :
View SolutionWhat is the type of graph that would result between log(V) and log(T) at constant pressure?
View Solution

