What will be the slope of a logP Vs logT graph plotted at constant volume?
To determine the slope of a logP vs logT graph plotted at constant volume, we can follow these steps:
1. Understand the Ideal Gas Law:
The ideal gas law is given by the equation:
\(
PV = nRT
\)
where:
- \( P \) = pressure of the gas
- \( V \) = volume of the gas
- \( n \) = number of moles of the gas
- \( R \) = universal gas constant
- \( T \) = absolute temperature of the gas
2. Identify the Conditions:
Since we are plotting the graph at constant volume, we will keep \( V \) constant. Additionally, we will assume the number of moles \( n \) is also constant.
3. Apply Gay-Lussac's Law:
According to Gay-Lussac's Law, the pressure of a gas is directly proportional to its absolute temperature when the volume is held constant:
\(
P \propto T
\)
This can be expressed as:
\(
P = kT
\)
where \( k \) is a constant.
4. Take the Logarithm of Both Sides:
To analyze the relationship between \( P \) and \( T \) in logarithmic terms, we take the logarithm of both sides:
\(
\log P = \log(kT)
\)
Using the properties of logarithms, we can expand this:
\(
\log P = \log k + \log T
\)
5. Rearrange the Equation:
Rearranging the equation gives us:
\(
\log P = \log T + \log k
\)
This is in the form of a linear equation \( y = mx + c \), where:
- \( y = \log P \)
- \( x = \log T \)
- \( m = 1 \) (the slope)
- \( c = \log k \) (the y-intercept)
6. Conclusion:
From the linear equation, we can see that the slope \( m \) of the graph of \( \log P \) vs \( \log T \) is:
\(
\text{slope} = 1
\)
Final Answer:
The slope of the logP vs logT graph plotted at constant volume is 1.
The ideal gas law is given by the equation:
\(
PV = nRT
\)
where:
- \( P \) = pressure of the gas
- \( V \) = volume of the gas
- \( n \) = number of moles of the gas
- \( R \) = universal gas constant
- \( T \) = absolute temperature of the gas
Since we are plotting the graph at constant volume, we will keep \( V \) constant. Additionally, we will assume the number of moles \( n \) is also constant.
According to Gay-Lussac's Law, the pressure of a gas is directly proportional to its absolute temperature when the volume is held constant:
\(
P \propto T
\)
This can be expressed as:
\(
P = kT
\)
where \( k \) is a constant.
To analyze the relationship between \( P \) and \( T \) in logarithmic terms, we take the logarithm of both sides:
\(
\log P = \log(kT)
\)
Using the properties of logarithms, we can expand this:
\(
\log P = \log k + \log T
\)
Rearranging the equation gives us:
\(
\log P = \log T + \log k
\)
This is in the form of a linear equation \( y = mx + c \), where:
- \( y = \log P \)
- \( x = \log T \)
- \( m = 1 \) (the slope)
- \( c = \log k \) (the y-intercept)
From the linear equation, we can see that the slope \( m \) of the graph of \( \log P \) vs \( \log T \) is:
\(
\text{slope} = 1
\)
The slope of the logP vs logT graph plotted at constant volume is 1.
Topper's Solved these Questions
- STATES OF MATTERBOOK - VMC MODULES ENGLISHCHAPTER - STATES OF MATTEREXERCISE - PRACTICE EXERCISE-4
2 Videos
- STATES OF MATTERBOOK - VMC MODULES ENGLISHCHAPTER - STATES OF MATTEREXERCISE - PRACTICE EXERCISE-5
3 Videos
- STATES OF MATTERBOOK - VMC MODULES ENGLISHCHAPTER - STATES OF MATTEREXERCISE - PRACTICE EXERCISE-2
3 Videos
- STATES OF MATTERBOOK - VMC MODULES ENGLISHCHAPTER - STATES OF MATTEREXERCISE - IMPECCABLE
50 Videos
- STOICHIOMETRY - IBOOK - VMC MODULES ENGLISHCHAPTER - STOICHIOMETRY - IEXERCISE - JEE Advanced (Archive)
31 Videos
Similar Questions
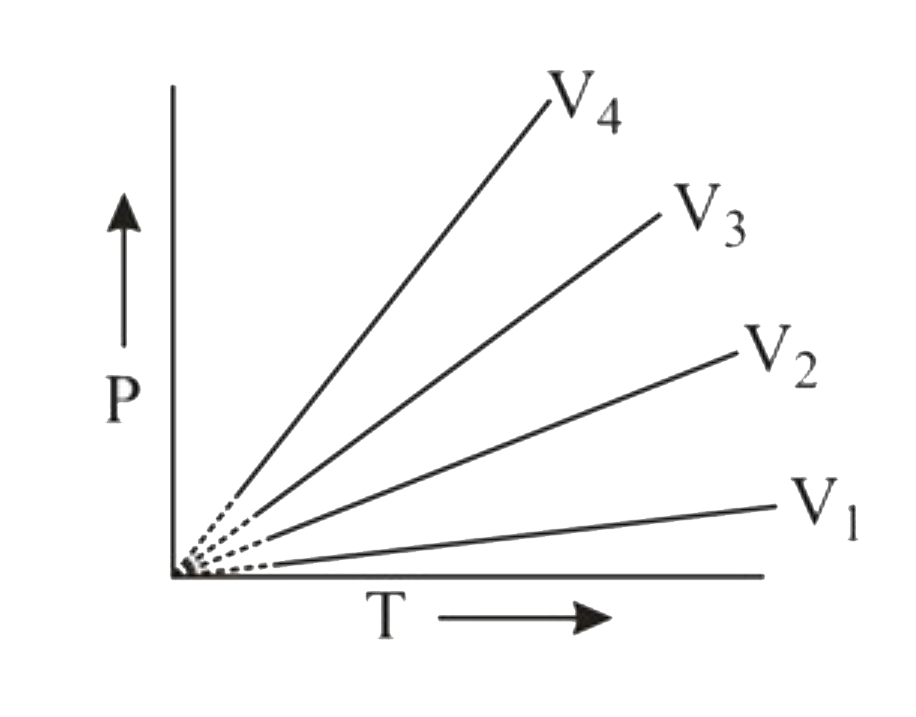
The ideal gas equation for 1 mol of ideal gas is PV = nRT
graph between P and T at constant volume, i.e. isochores are plotted as under

Which of the following order of volume is correct ?
View SolutionThe slope of the plot between pV and p at constant temperature is
View SolutionWhat does the slope of a work-time graph represent?
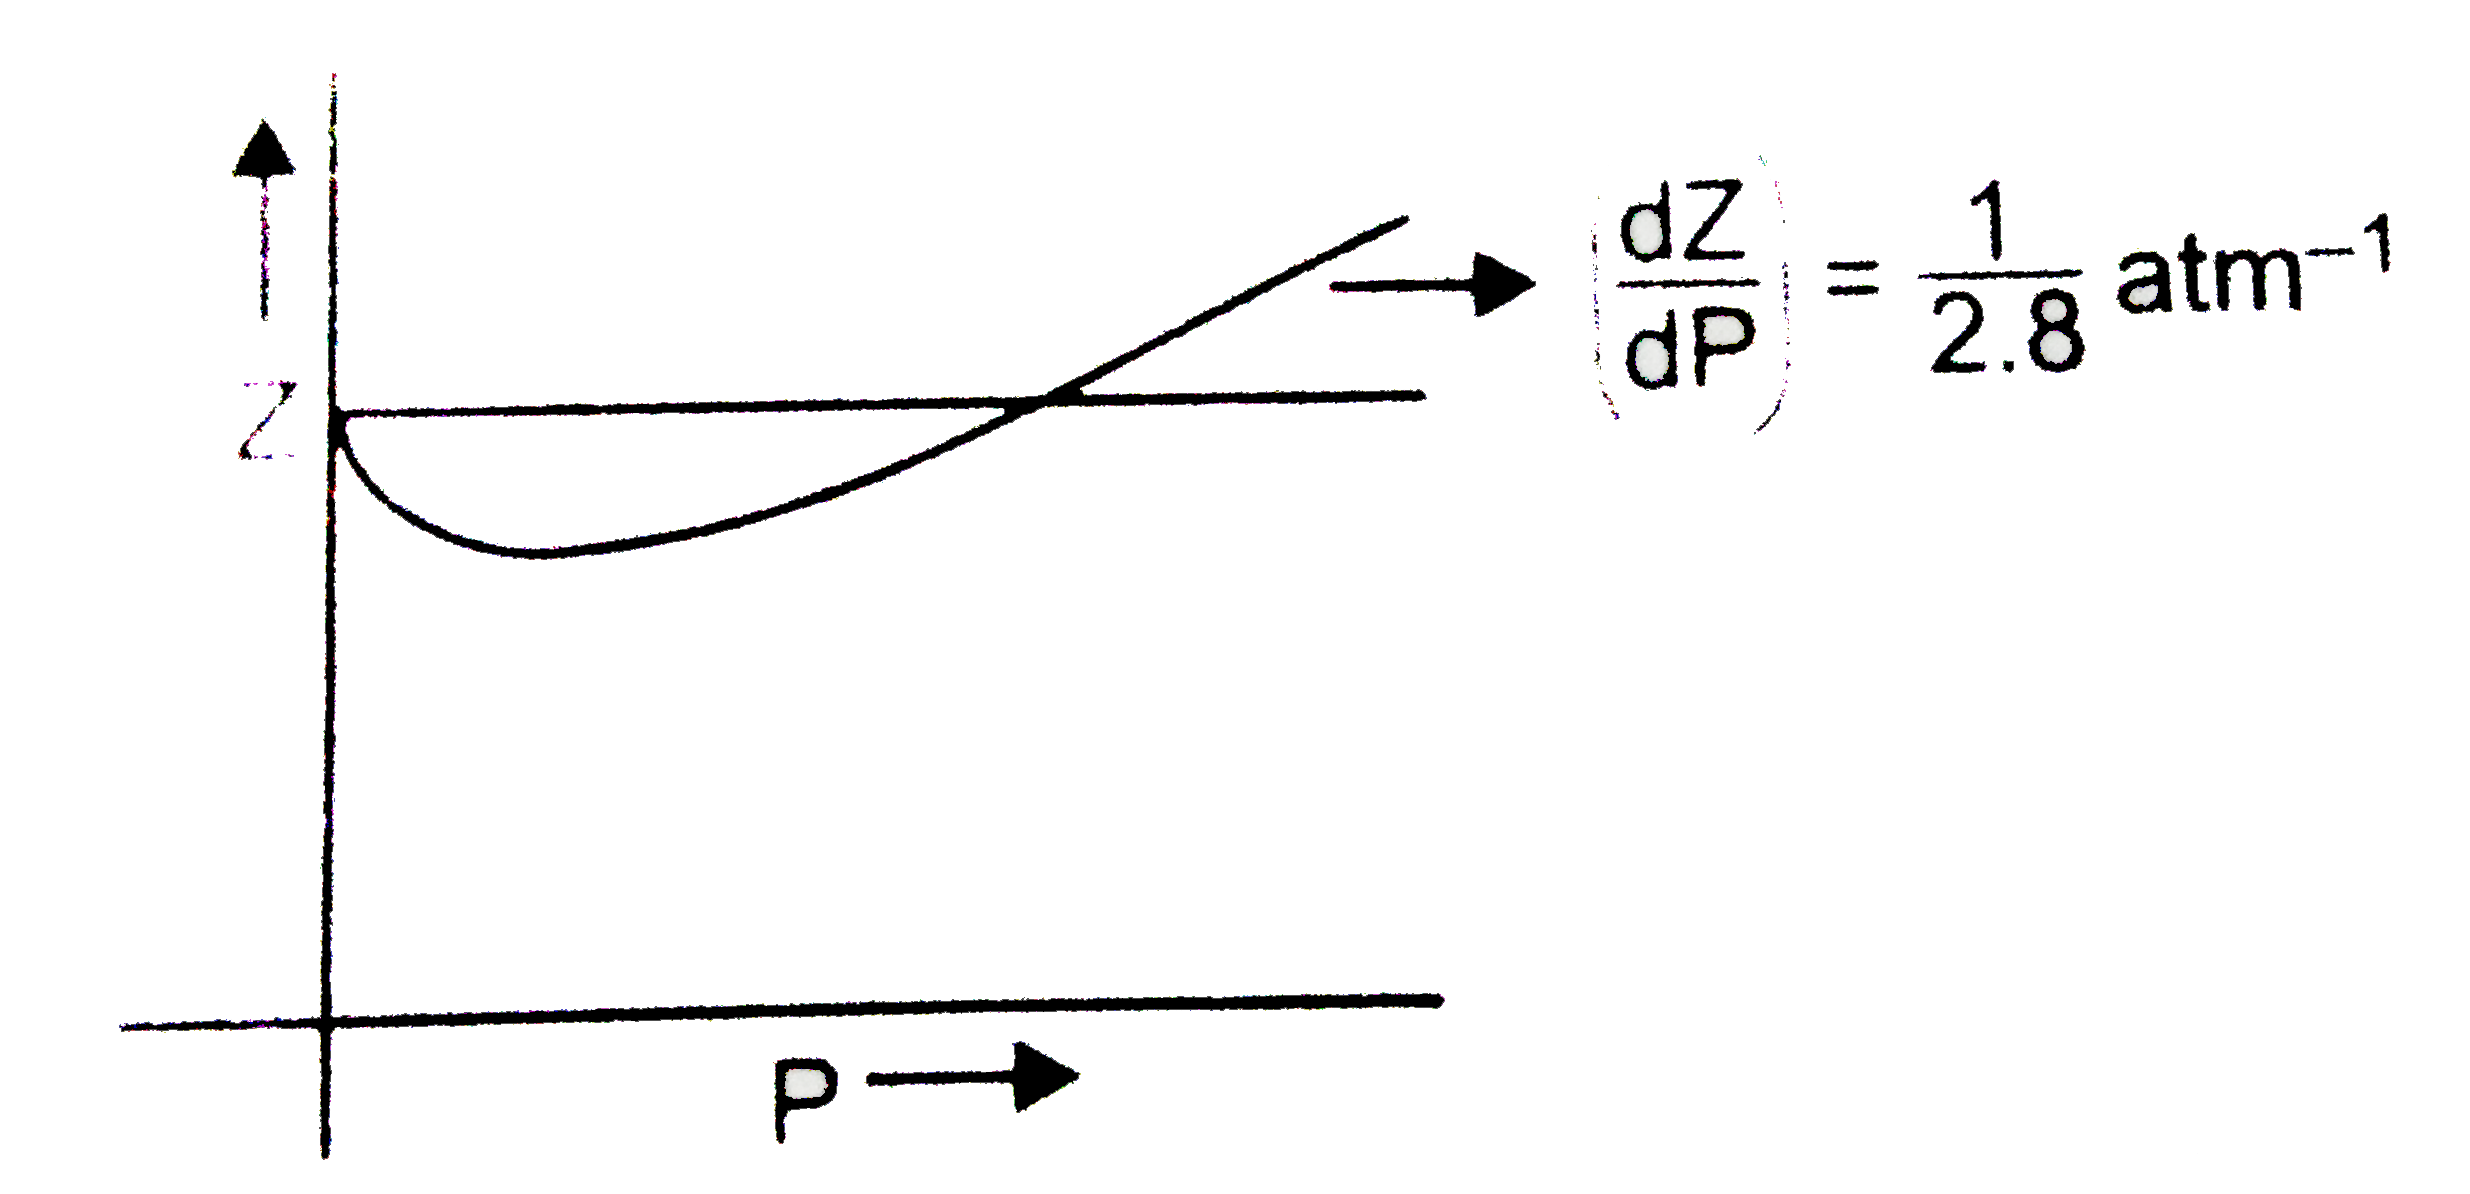
View SolutionThe graph of compressibility factor (Z) vs. P for one mole of a real gas is shown in following diagram. The graph is plotted at constant temperature 273K. If the slope of graph at very high pressure (dZdP) is (12.8)atm−1 , then calculate volume of one mole of real gas molecules (in L/mol)
Given : NA=6×10²³ and R=22.4273LatmK−1mol−1

View SolutionWhat does the slope of a displacement-time graph represent?
View SolutionDraw the plot log V vs log T.
View SolutionMagnitude of slope of the shown graph.

View SolutionMagnitude of slope of the shown graph.

View SolutionWhat is the slope of x-t graph of a stationary object?
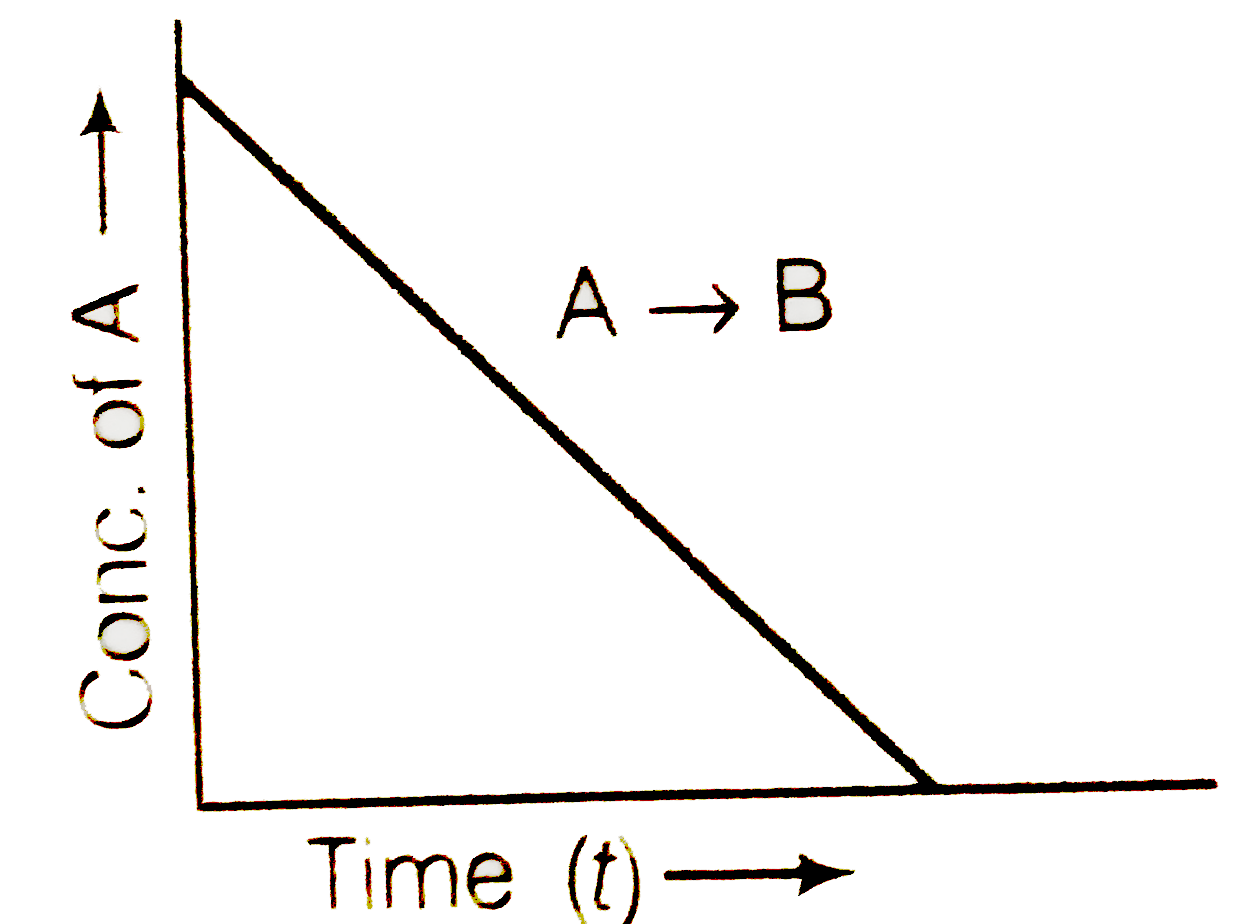
View SolutionFor a general reaction A→B, plot of concentration of A vs time is given in figure. Answer the following questions on the basis of this graph.
(i) what is the order of the reaction?
(ii) What is the slope of the curve ?
(iii) What are the units of rate constant?

View Solution
