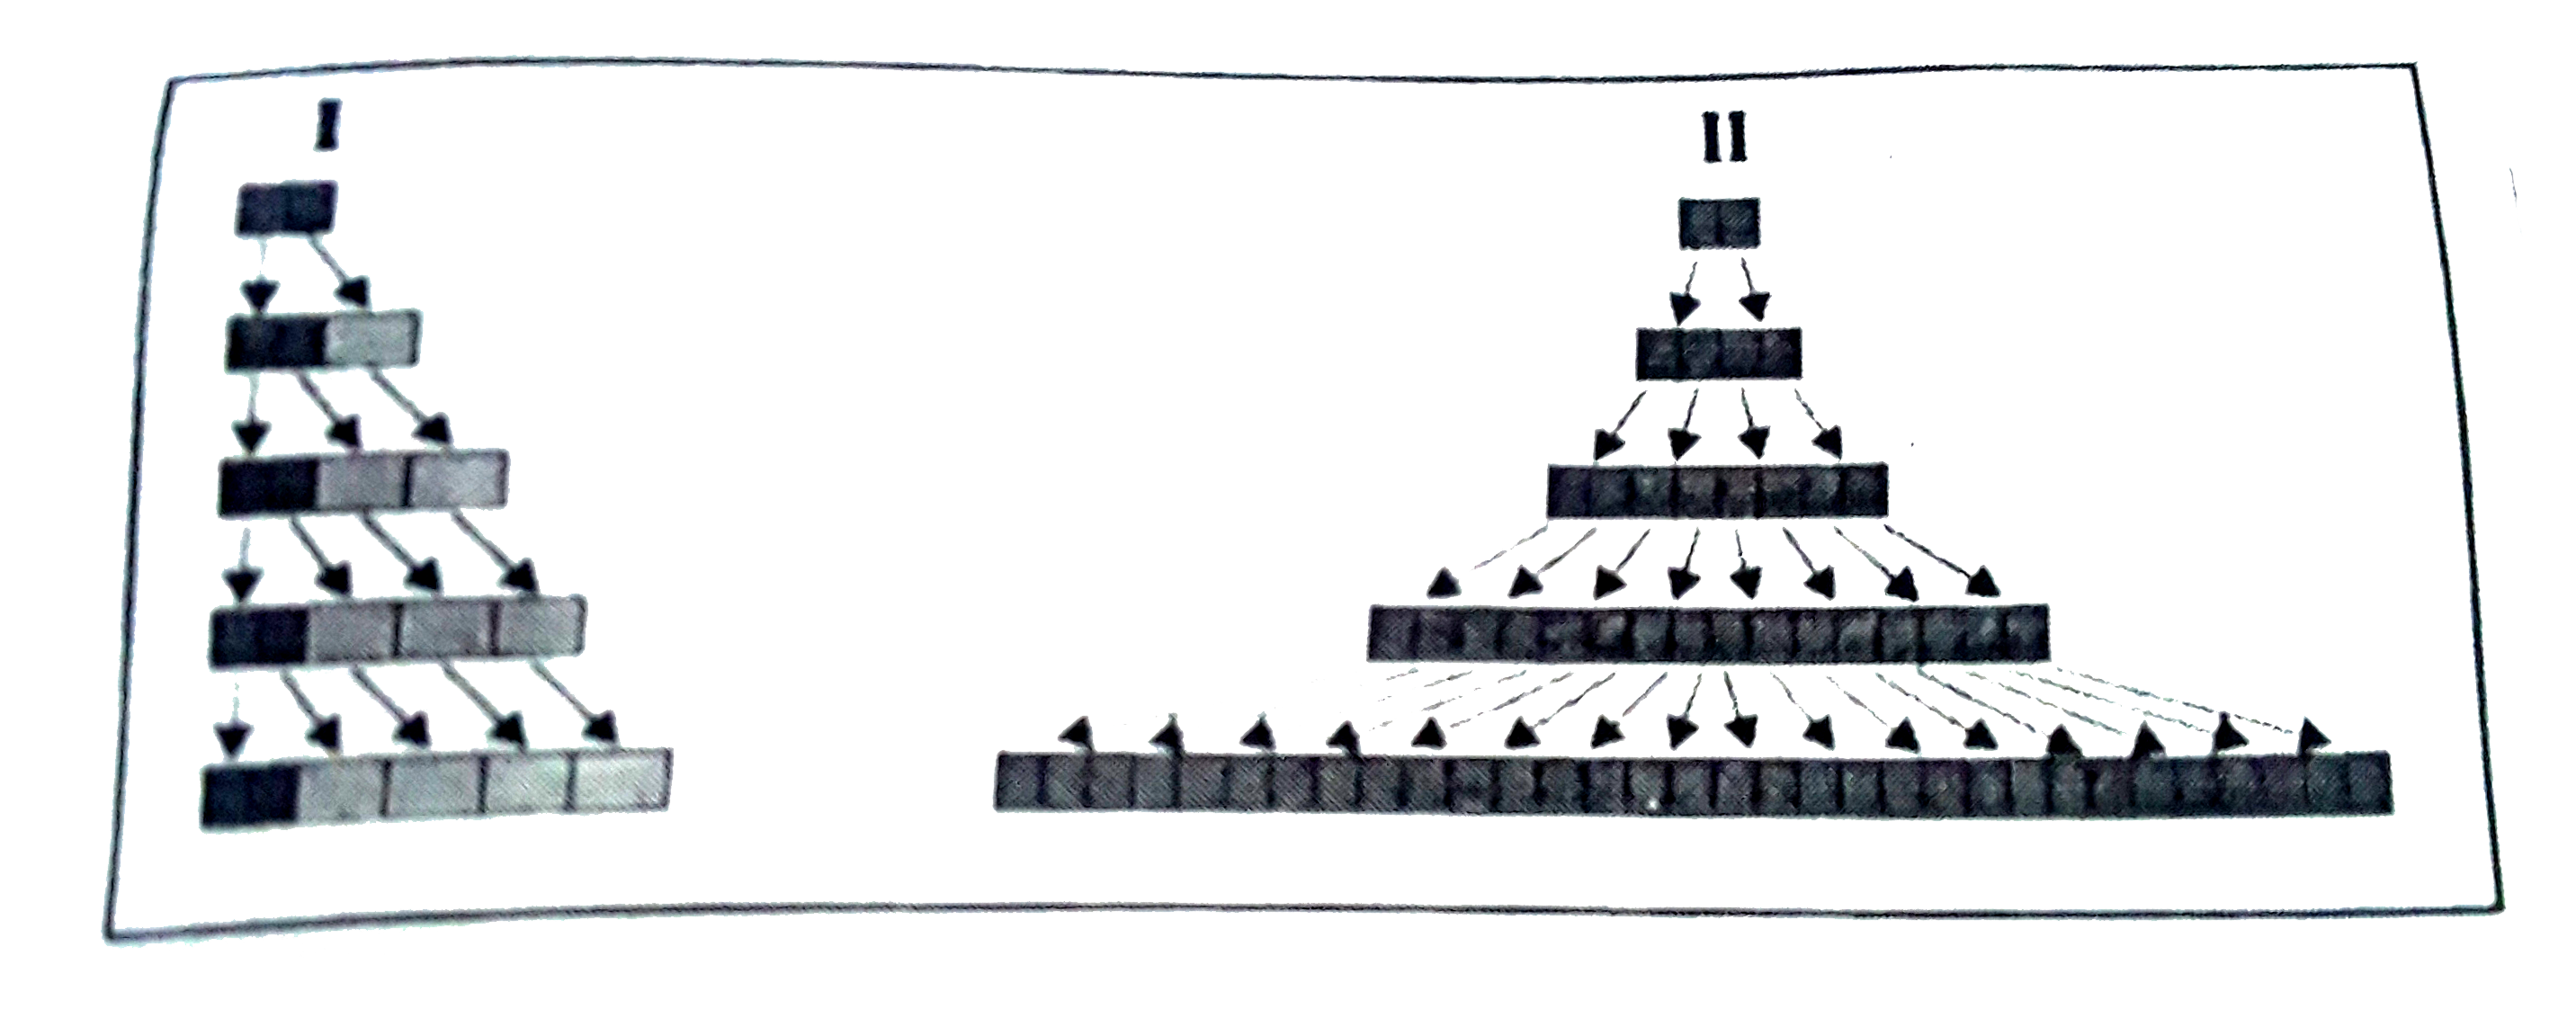
In the following graphical representation for the reaction A→B, there are two types of regions:
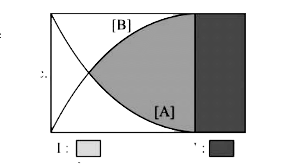
I and II both represent kinetic region at different time
I and II both represent equilibrium region at different
I represents kinetic while II represents equilibrium regi
I represents equilibrium while II represents kinetic regi
The correct Answer is:C
I represents kinetic while II represents equilibrium region.
Topper's Solved these Questions
- CHEMICAL KINETICS BOOK - VMC MODULES ENGLISHCHAPTER - CHEMICAL KINETICS EXERCISE - Level-2 ( Numerical Value Type for JEE Main )
15 Videos
- CHEMICAL KINETICS BOOK - VMC MODULES ENGLISHCHAPTER - CHEMICAL KINETICS EXERCISE - JEE Main (Archive)
56 Videos
- CHEMICAL KINETICS BOOK - VMC MODULES ENGLISHCHAPTER - CHEMICAL KINETICS EXERCISE - Level-1
75 Videos
- CHEMICAL EQUILIBRIUMBOOK - VMC MODULES ENGLISHCHAPTER - CHEMICAL EQUILIBRIUMEXERCISE - IN-CHAPTER EXERCISE - G
10 Videos
- CHEMICAL THERMODYNAMICS BOOK - VMC MODULES ENGLISHCHAPTER - CHEMICAL THERMODYNAMICS EXERCISE - IN - CHAPTER EXERCISE - L
10 Videos
Similar Questions
Knowledge Check
Which is the true graphical representation of V vs 1/P
A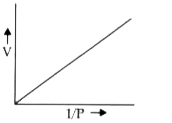 B
B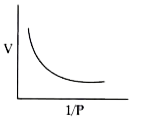 C
C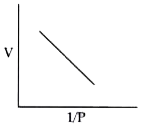 D
D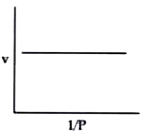
Radioactive nuclei are being generated at a constant rate by some kind of nuclear reaction. If the decay constant for the radioactive nuclei is λ, which of the following graphical representation is correct ? (initially, there are no radioactive nuclei present )
View SolutionWhich is not the graphical representation for the zeroth order reaction ?
View SolutionSymbolic representation of a chemical reaction.
View SolutionLook at the following diagram:
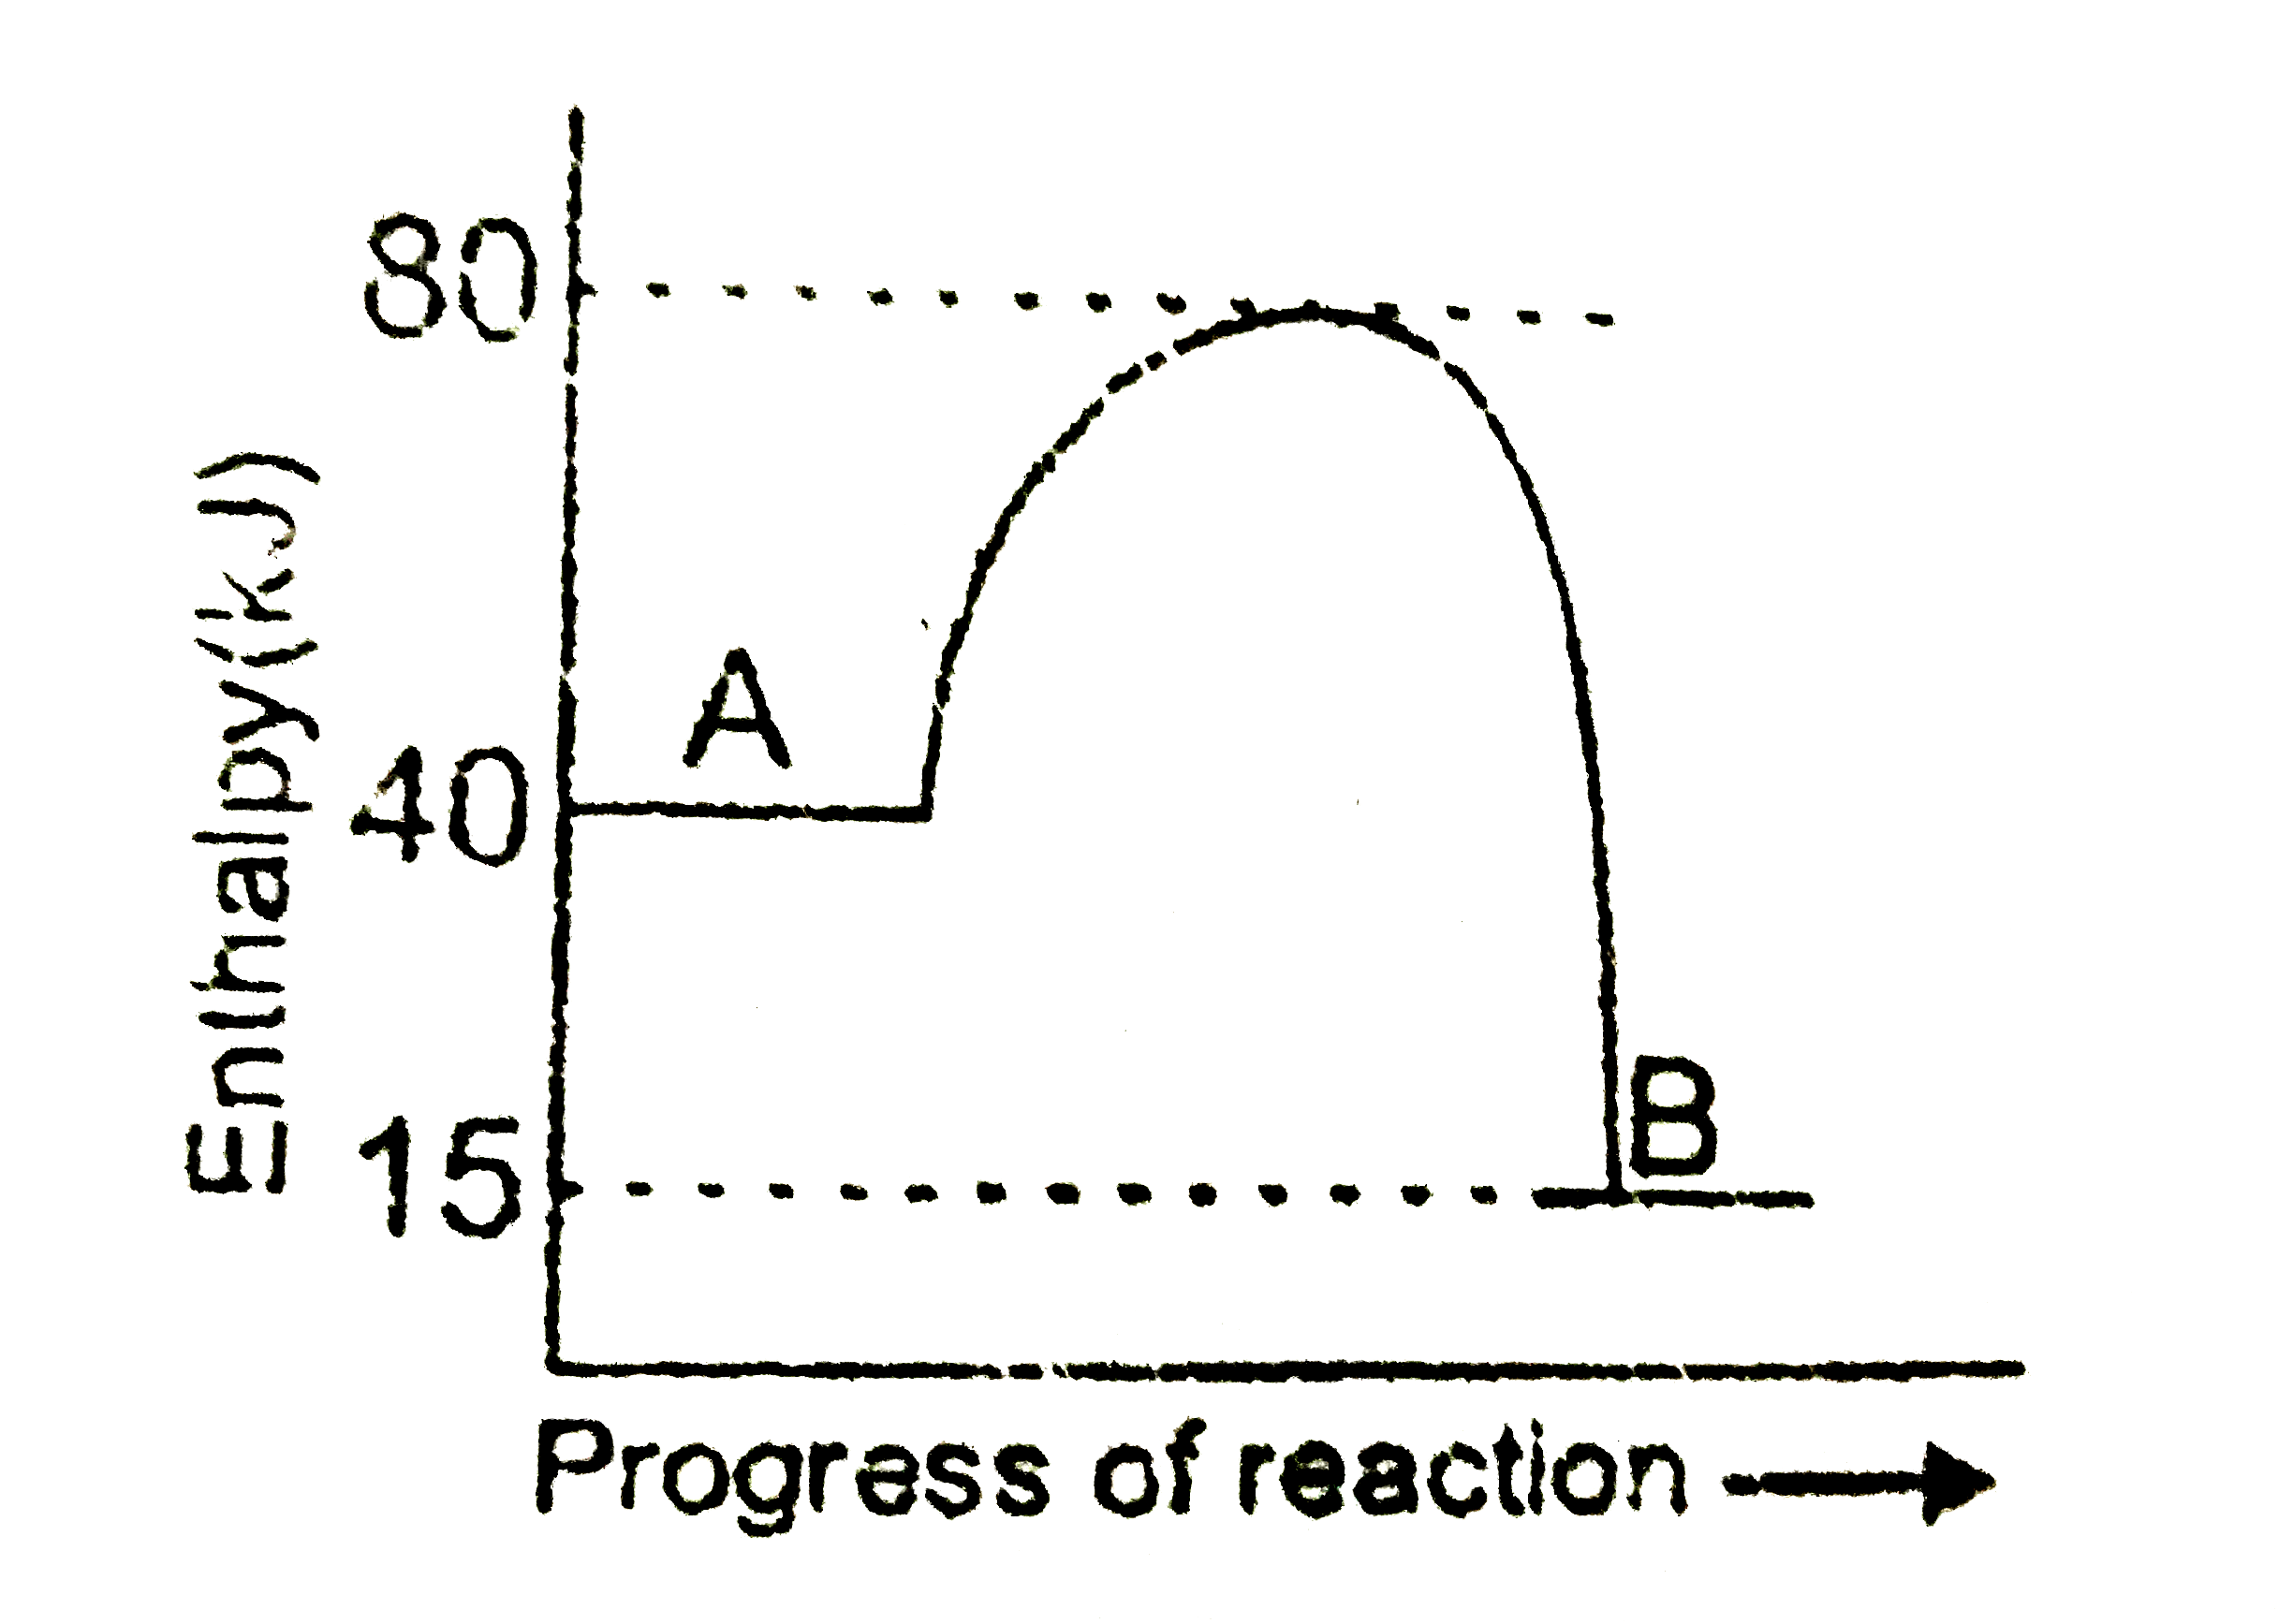
The enthalpy change for the reaction A→B will be
View SolutionGive a graphic representation of carbon cycle in nature.
View SolutionWhich of the following reaction representes incorrect product
View SolutionIdentify the following diagrammatic representation of types of growth and their mathematical expression.
View Solution
