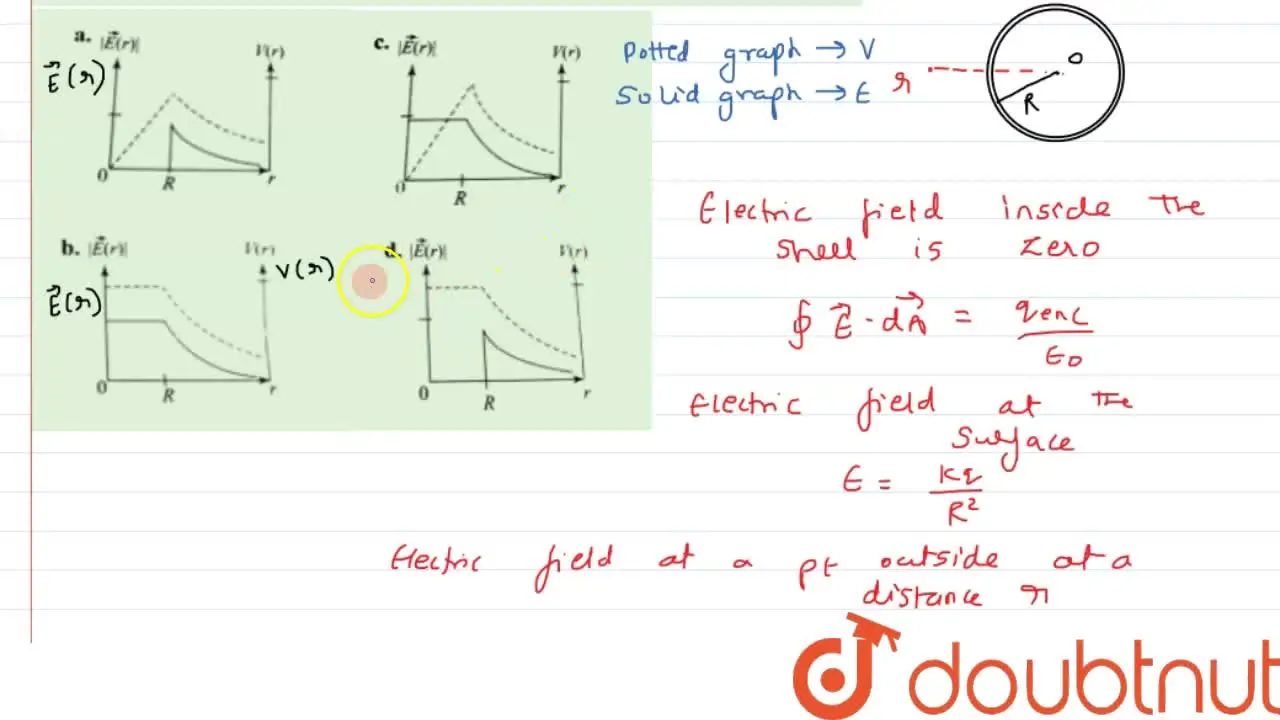
Consider a thin spherical shell of radius R with its centre at the origin, carrying uniform positive surface charge density. The variation of the magnitude of the electric field ∣∣→E(r)∣∣ and the electric potential V (r) with the distance r from the center, is best represented by which graph?


The correct Answer is:D
For inside points, (r≤R), E=0 V = constnat = 14πε0qR
For outside points (r≥R) E=14πε0.qr2orE∝1r2andV=14πε0qrorV∝1r
on the surface (r=R),V=14πε0qRrARrE=14πε0.qR2⇒E=14πε0.qR2=σε0
where σ=q4πR2 = surface charge density corresponding to above equation the correct graphs are shown in option (D).
Related Playlists
- BOOK - VMC MODULES ENGLISHCHAPTER - ELECTROSTATICSEXERCISE - JEE MAIN65videos
ELECTROSTATICS
- BOOK - VMC MODULES ENGLISHCHAPTER - ELECTROMAGNETIC INDUCTION & ALTERNATIVE CURRENT EXERCISE - IMPECCABLE52videos
ELECTROMAGNETIC INDUCTION & ALTERNATIVE CURRENT
- BOOK - VMC MODULES ENGLISHCHAPTER - ENERGY & MOMENTUMEXERCISE - JEE ADVANCE (ARCHIVE) - TRUE/FALSE TYPE1videos
ENERGY & MOMENTUM
Similar Questions
Conisder a thin spherical shell of radius R with centre at the origin, carrying uniform poistive surface charge denisty. The variation of the magnitude of the electric field ∣∣→E(r)∣∣ and the electric potential V(r) with the distance r from the centre, is best represented by which graph?
View SolutionConsider a thin spherical shell of radius R consisting of uniform surface charge density σ. The electric field at a point of distance x from its centre and outside the shell is
View SolutionA long thin flat sheet has a uniform surface charge density σ. The magnitude of the electric field at a distance .r. from it is given by
View SolutionA thin spherical shell of radius R has charge Q spread uniformly over its surface. Which of the following graphs most closely represents the electric field E(r) produced by the shell in the range 0≤r<∞, where r is the distance from the centre of the shell?
View SolutionA thin spherical shell of radius R has charge Q spread uniformly over its surface. Which of the following graphs most closely represents the electric field E(r) produced by the shell in the range 0≤r<∞, where r is the distance from the centre of the shell?
View SolutionA non-conducting solid sphere of radius R, has a uniform charge density. The graph representing variation of magnitude of electric field (E) as a function of distance (x) from the centre of the sphere is
 View Solution
Variation of electric potential due to npn-conducting (positively charged) solid sphere with distance from its centre is best represented as
View SolutionThe electric field inside a spherical shell of uniform surface charge density is
View SolutionAn isolated solid metal sphere of radius R is given an electric charge. The variation of the intensity of the electric field with the distance r from the centre of the sphere is best shown by
View SolutionThe electric field due to uniformly charged sphere of radius R as a function of the distance from its centre is represented graphically by
View Solution


