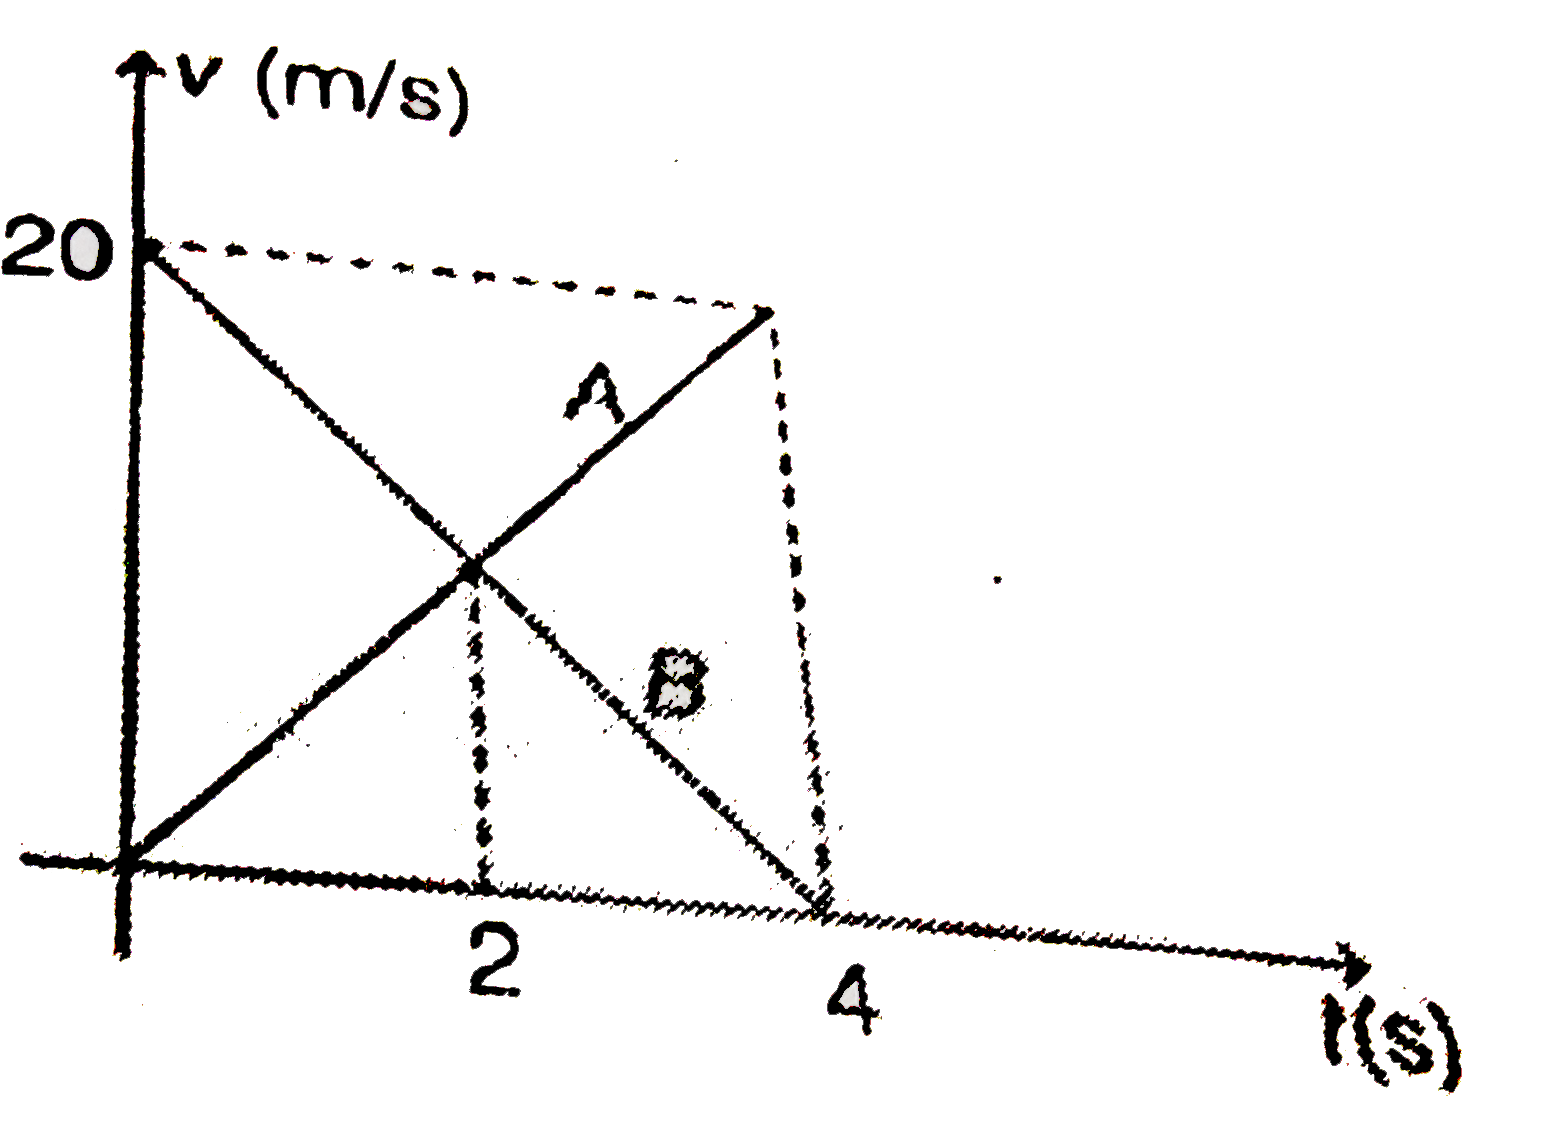
Speed time graph of two cars and approaching towards each other is shown in figure. Initial distance between them is . The two cars will cross each other after seconds. Find value of .
The correct Answer is:C
Slope of v-t graph gives acceleration /retardation
for both of them . A has acceleration while B has retardation
Topper's Solved these Questions
- KINEMATICS OF A PARTICLE BOOK - VMC MODULES ENGLISHCHAPTER - KINEMATICS OF A PARTICLE EXERCISE - JEE MAIN (archive)
19 Videos
- KINEMATICS OF A PARTICLE BOOK - VMC MODULES ENGLISHCHAPTER - KINEMATICS OF A PARTICLE EXERCISE - JEE Advanced (archive)
14 Videos
- KINEMATICS OF A PARTICLE BOOK - VMC MODULES ENGLISHCHAPTER - KINEMATICS OF A PARTICLE EXERCISE - LEVEL 1
75 Videos
- JEE MAIN REVISON TEST-23BOOK - VMC MODULES ENGLISHCHAPTER - JEE MAIN REVISON TEST-23EXERCISE - PHYSICS (SECTION 2)
1 Videos
- LAWS OF MOTION BOOK - VMC MODULES ENGLISHCHAPTER - LAWS OF MOTION EXERCISE - IMPECCABLE
53 Videos
Similar Questions
Speed time graph of two cars A and B approaching towards each other is shown in figure. Initial distance between them is 60m. The two cars will cross each other after t secons. Find value of it t.

View SolutionFour equal circles, each of radius 5cm, touch each other as shown in Figure. Find the area included between them.
View Solution
Knowledge Check
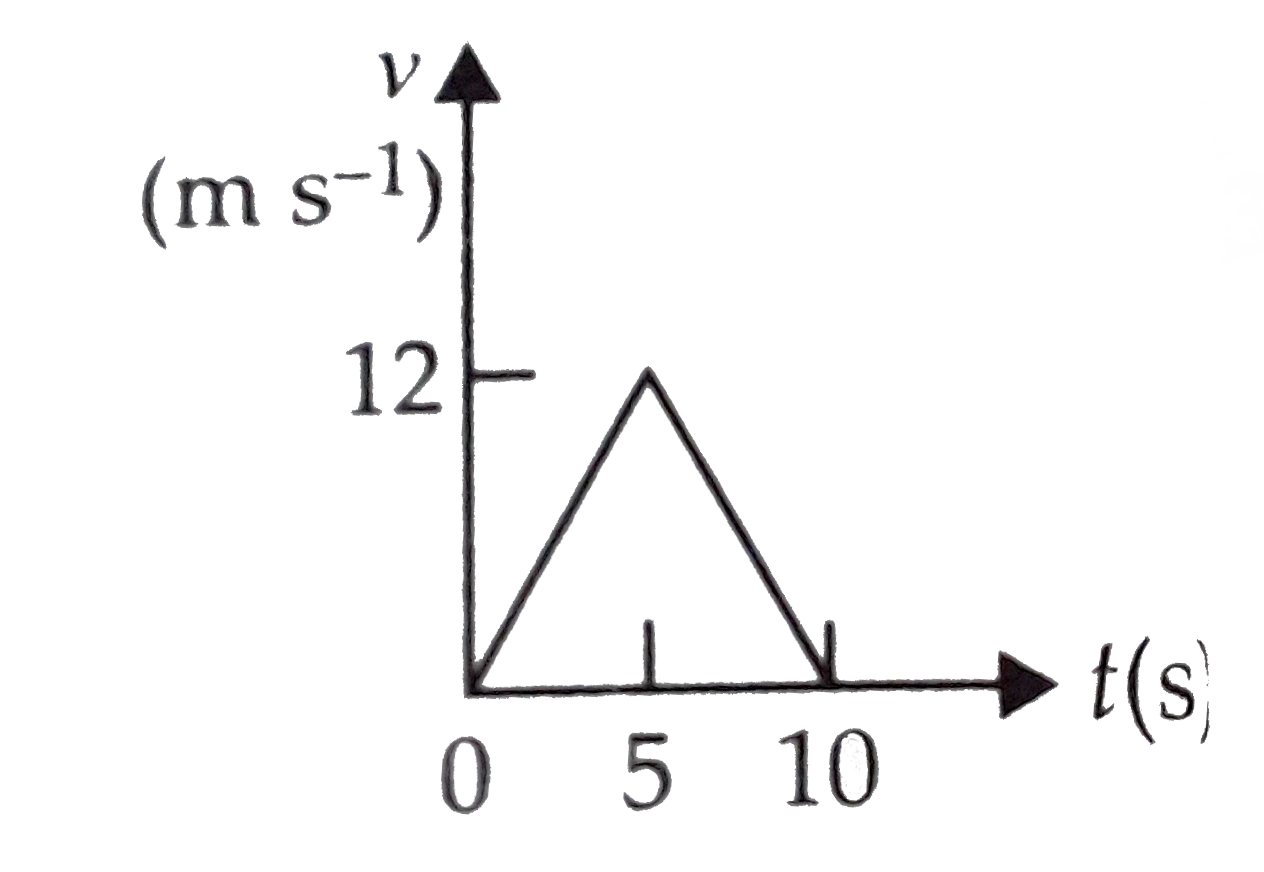
The speed-time graph of a particle moving along a fixed direction as shown in the figure. The distance traversed by the particle between t = 0 s to t = 10 s is
 A20 mB40 mC60 mD80 m
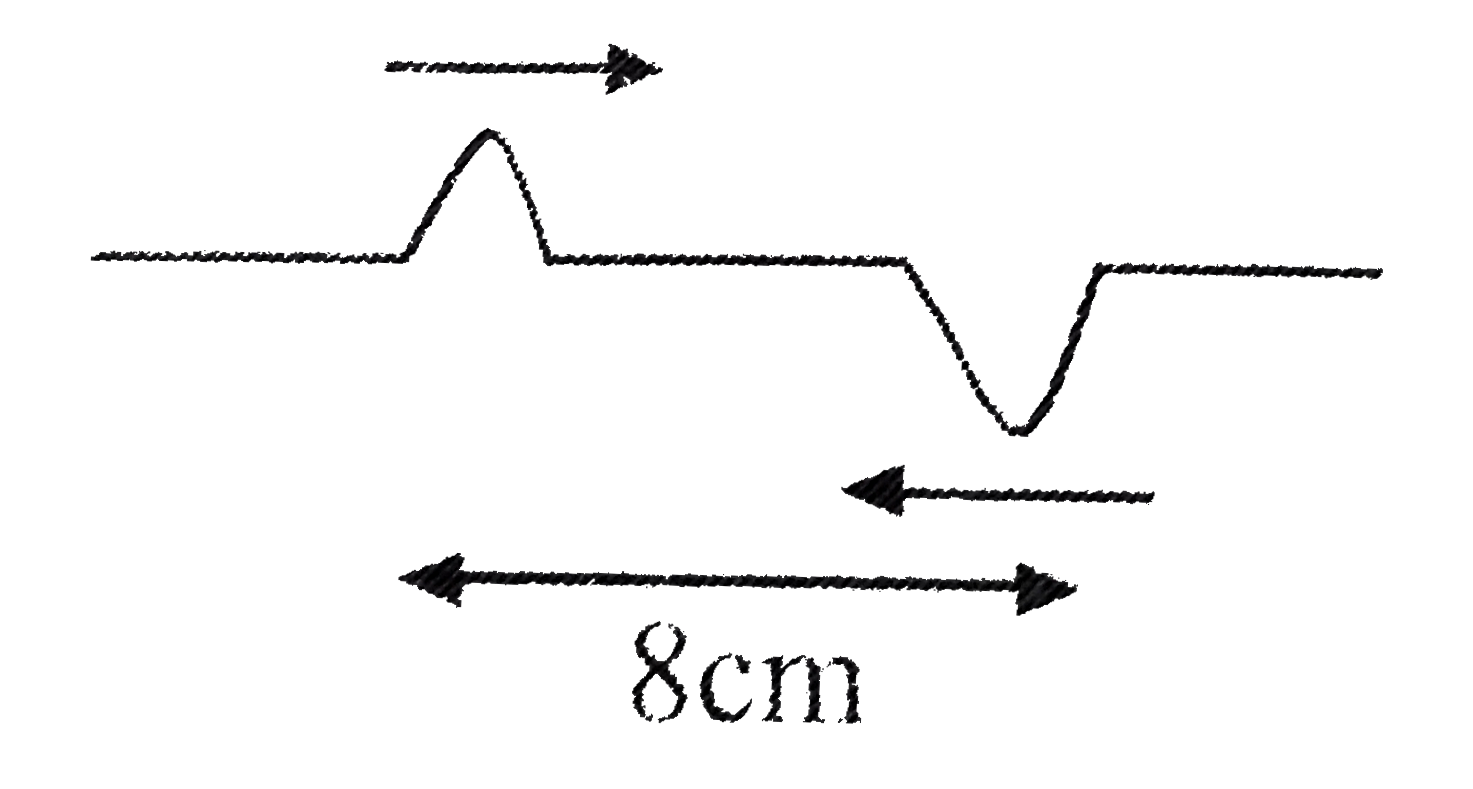
Two pulses in a stretched string whose centres are initially 8 cm apart are moving towards each other as shown in the figure. The speed of each pulse is 2 cm/s. After 2 second, the total energy of the pulses will be
 AzeroBpurely kineticCpurely potentialDpartly kinetic and partly potential
Four equal circles, each of radius 5 cm, touch each other as shown in Fig.20. Find the area included between them. (Takeπ=3.14).
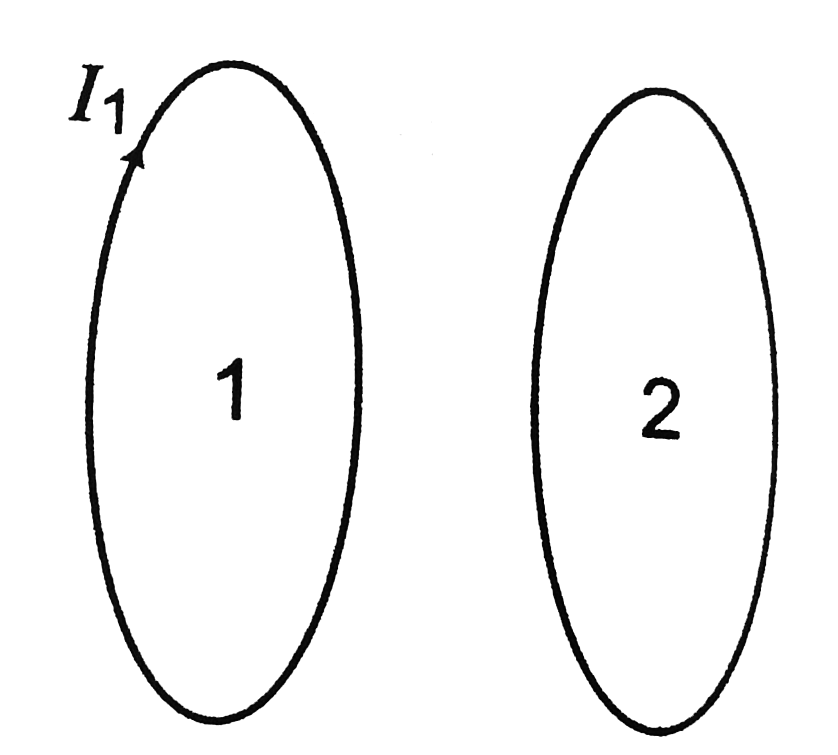
View SolutionTwo loops are facing each other as shown in Figure. State whether the loops will attract each other or repel each other if current I1 is increased
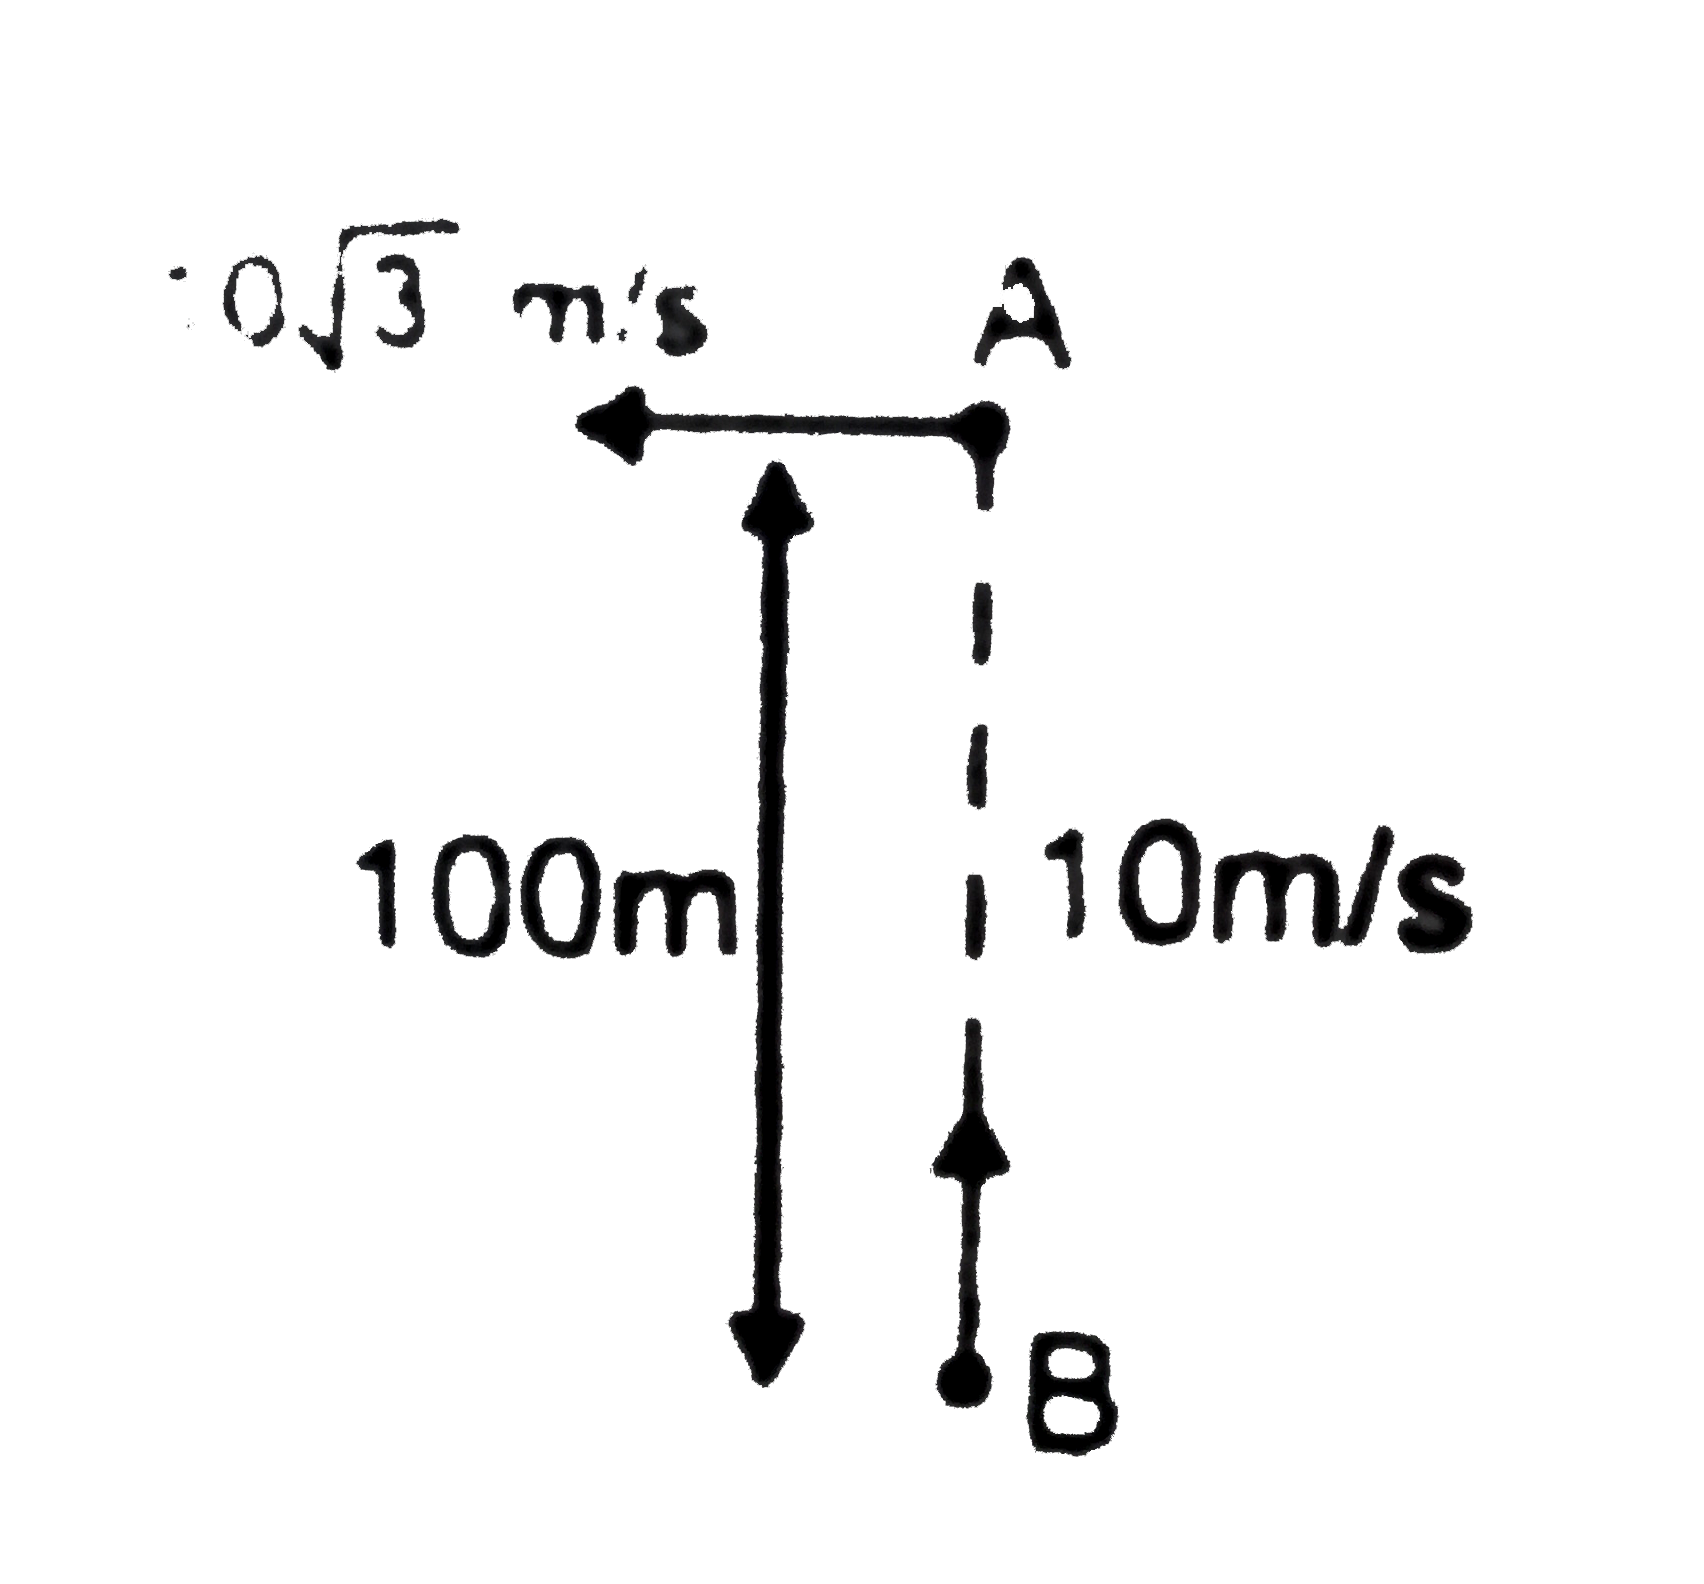
View SolutionConsider two cars moving perpendicular to each other as shown. Initially distance between 100m. Velocity of A is 10√3 m/s and velocity of B is 10m/s. Then
View SolutionThe speed of a car as a function of time is shown in figure.
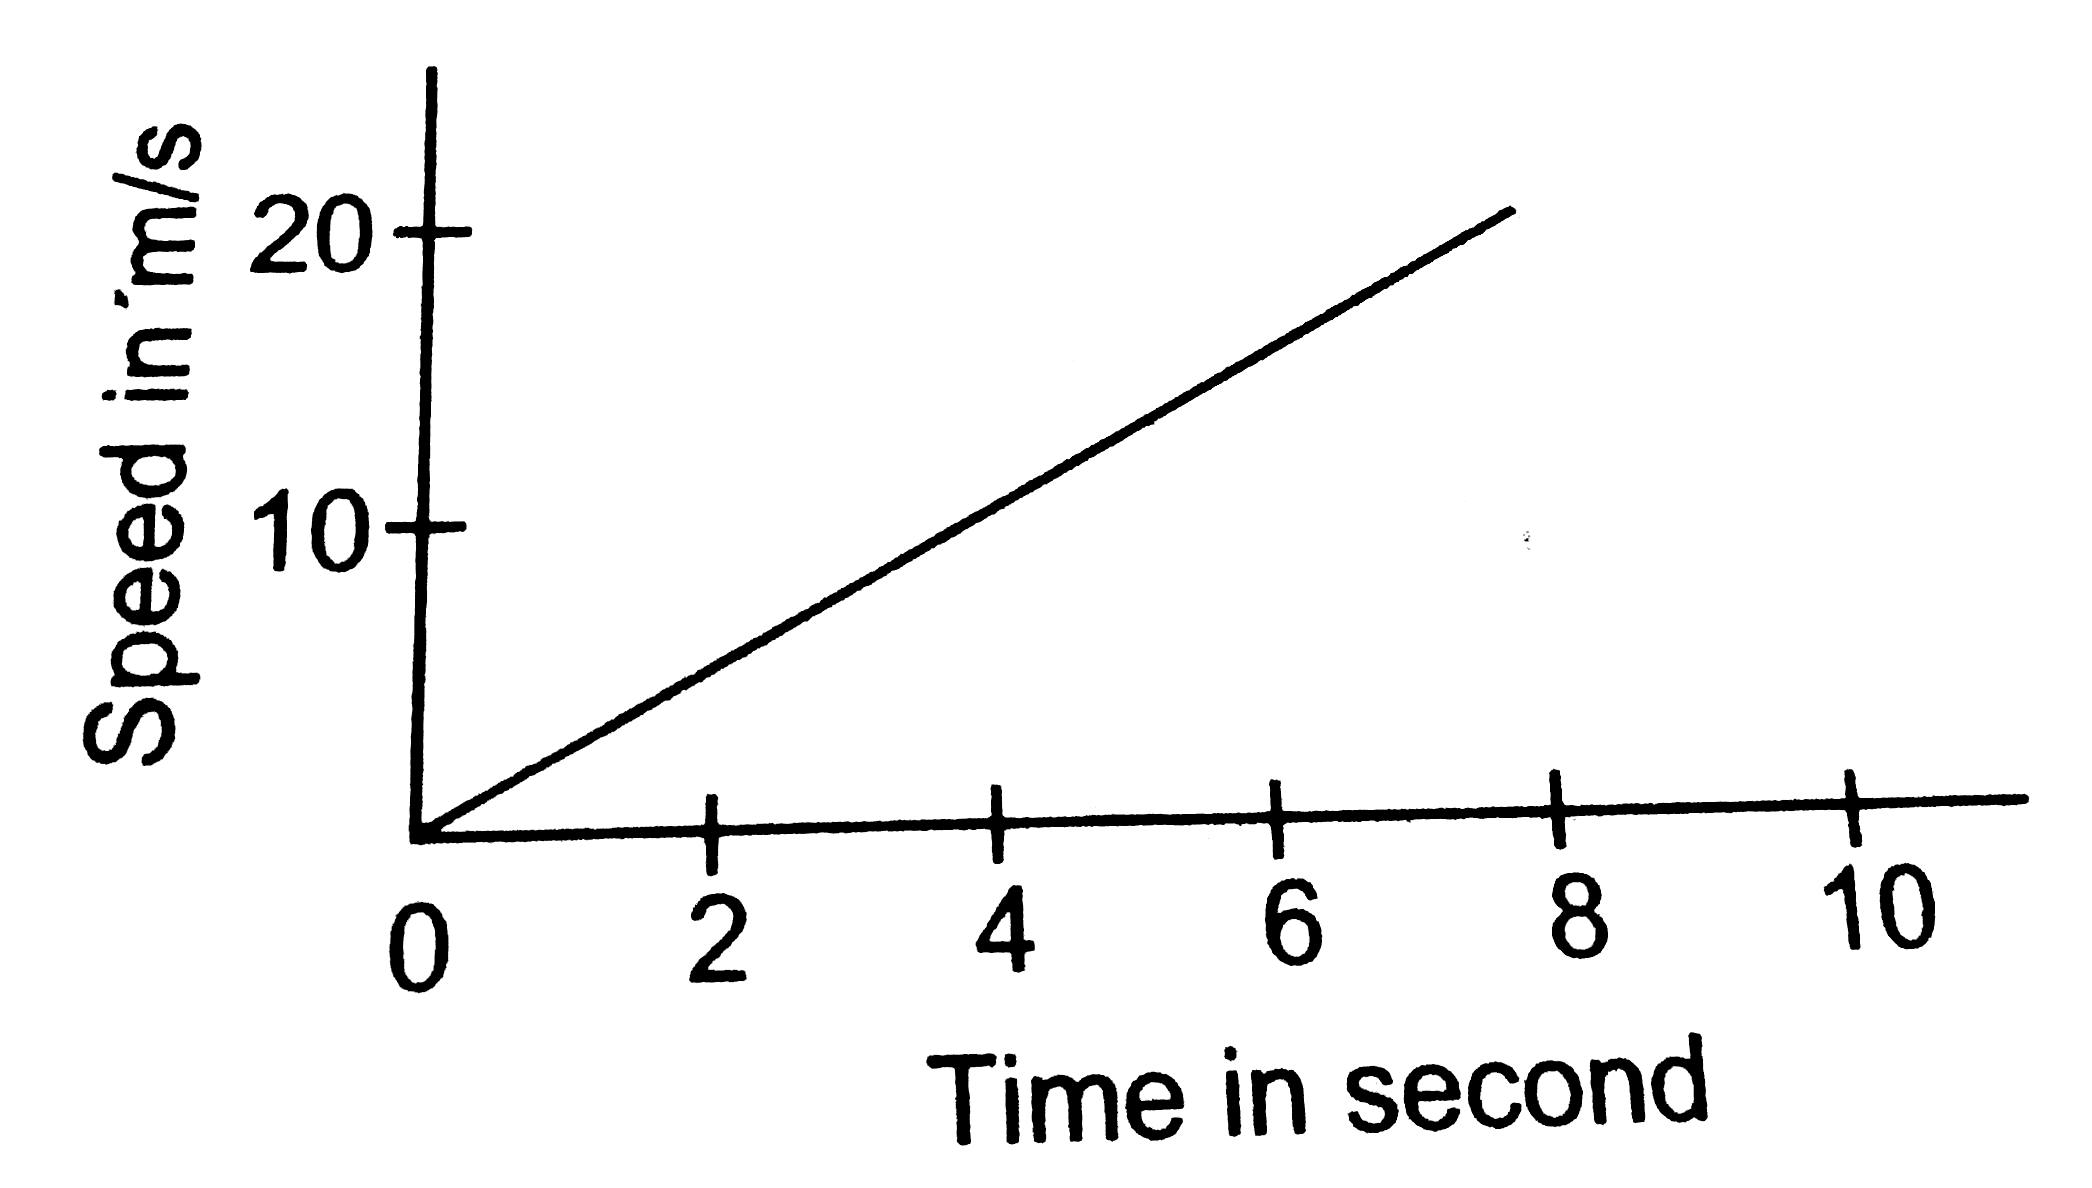
Find the distance travelled by the car in 8 seconds and its acceleration.
View SolutionTwo waves are approaching each other with a velocity of 20m/s and frequency n. The distance between two consecutive nodes is
View SolutionTwo cars are moving is one a same line dimension in opposite direction with the same speed v. The relative velocity of two cars w.r.t. each other is
View Solution
