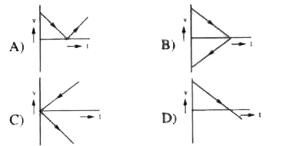
A body is thrown vertically upwards. Which one of the following graphs correctly represent the velocity vs time?
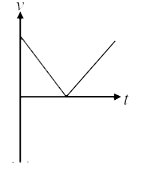
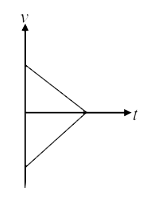
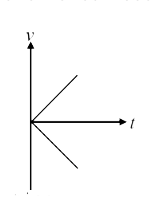
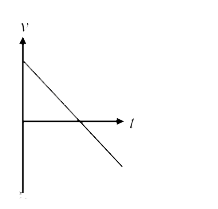
The correct Answer is:D
To solve the problem of determining the correct velocity vs. time graph for a body thrown vertically upwards, we can follow these steps:
1. Understanding the Motion:
- When a body is thrown vertically upwards, it starts with an initial velocity (u) greater than zero. As it moves upwards, it decelerates due to the force of gravity acting in the opposite direction.
2. Velocity at Maximum Height:
- As the body ascends, its velocity decreases until it reaches the maximum height. At this point, the velocity becomes zero (v = 0).
3. Velocity After Maximum Height:
- After reaching the maximum height, the body begins to fall back down. As it falls, its velocity increases in the downward direction, which is considered negative in the context of the velocity vs. time graph.
4. Graph Characteristics:
- The graph will start from a positive value (initial velocity), slope downwards to zero (at maximum height), and then continue downward into the negative region (as the body falls back down).
5. Identifying the Correct Graph:
- The correct graph will show a straight line that starts from a positive value, decreases linearly to zero, and then continues to decrease into the negative region. This is typically represented as a straight line sloping downwards and then continuing downwards.
Conclusion:
- The correct graph that represents the velocity vs. time for a body thrown vertically upwards is Graph B.
- When a body is thrown vertically upwards, it starts with an initial velocity (u) greater than zero. As it moves upwards, it decelerates due to the force of gravity acting in the opposite direction.
- As the body ascends, its velocity decreases until it reaches the maximum height. At this point, the velocity becomes zero (v = 0).
- After reaching the maximum height, the body begins to fall back down. As it falls, its velocity increases in the downward direction, which is considered negative in the context of the velocity vs. time graph.
- The graph will start from a positive value (initial velocity), slope downwards to zero (at maximum height), and then continue downward into the negative region (as the body falls back down).
- The correct graph will show a straight line that starts from a positive value, decreases linearly to zero, and then continues to decrease into the negative region. This is typically represented as a straight line sloping downwards and then continuing downwards.
- The correct graph that represents the velocity vs. time for a body thrown vertically upwards is Graph B.
Topper's Solved these Questions
- KINEMATICS OF A PARTICLE Book:VMC MODULES ENGLISHChapter:KINEMATICS OF A PARTICLE Exercise:LEVEL 2
Explore 65 Videos
- KINEMATICS OF A PARTICLE Book:VMC MODULES ENGLISHChapter:KINEMATICS OF A PARTICLE Exercise:JEE MAIN (archive)
Explore 19 Videos
- KINEMATICS OF A PARTICLE Book:VMC MODULES ENGLISHChapter:KINEMATICS OF A PARTICLE Exercise:JEE Advanced (archive)
Explore 14 Videos
- JEE MAIN REVISON TEST-23Book:VMC MODULES ENGLISHChapter:JEE MAIN REVISON TEST-23Exercise:PHYSICS (SECTION 2)
Explore 1 Video
- LAWS OF MOTION Book:VMC MODULES ENGLISHChapter:LAWS OF MOTION Exercise:IMPECCABLE
Explore 53 Videos
Similar Questions
Knowledge Check
The velocity -displacement graph of a particle is as shown in the figure. Which of the following graphs correctly represents the variation of acceleration with displacement?
 A
A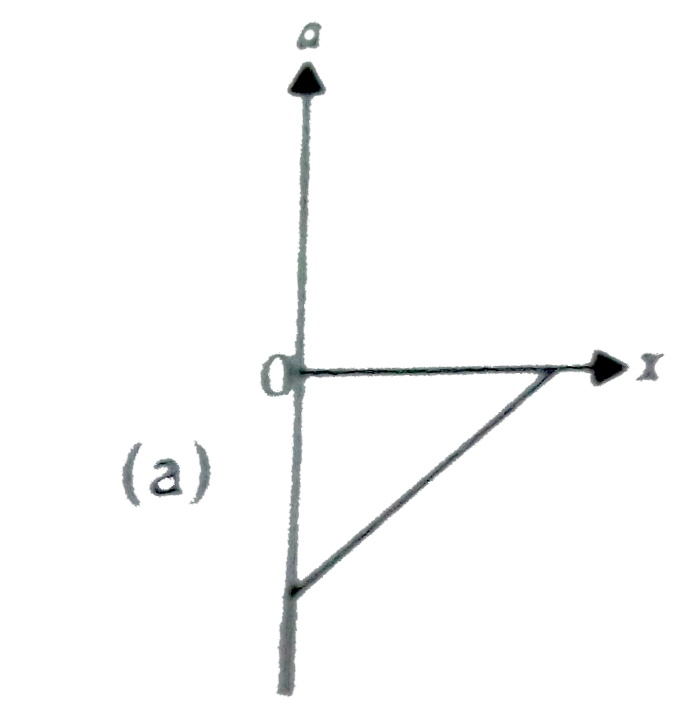 B
B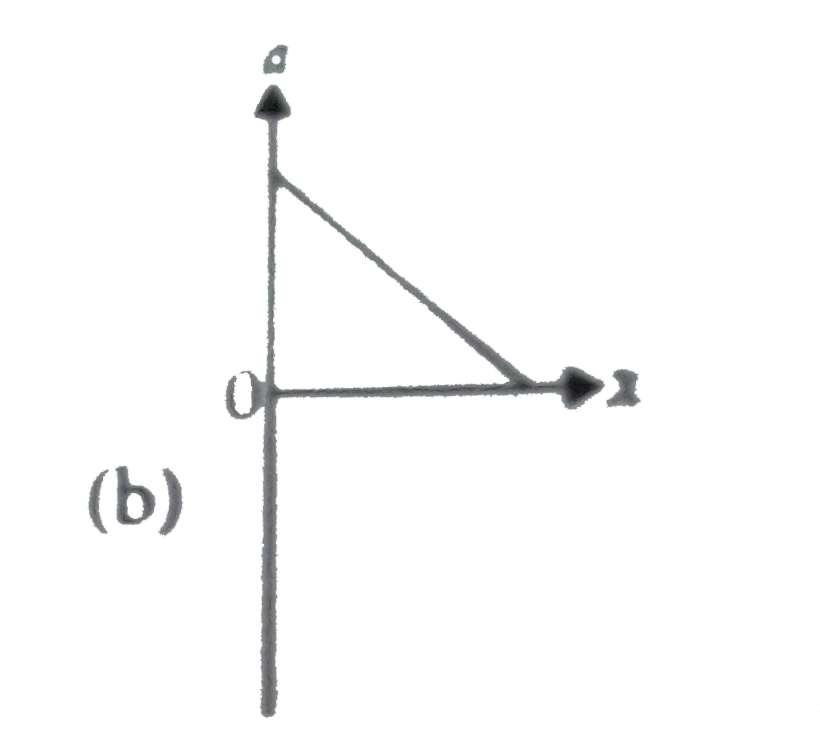 C
C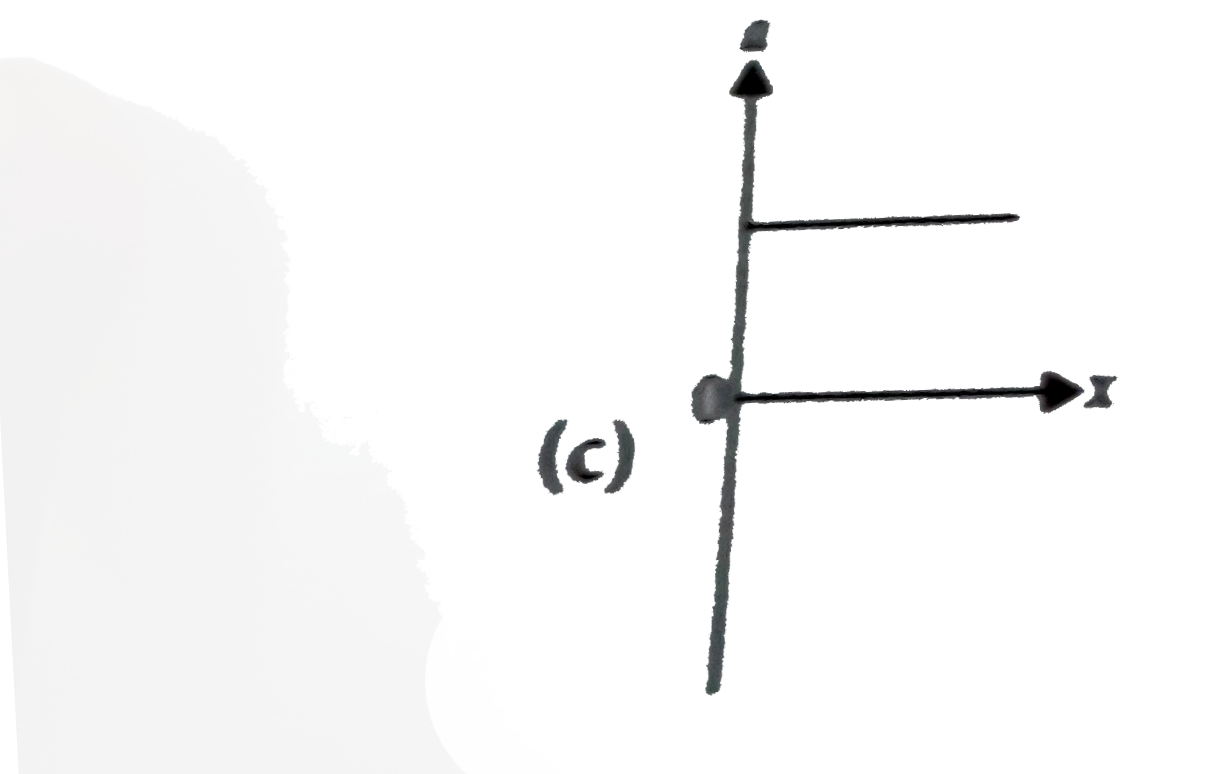 D
D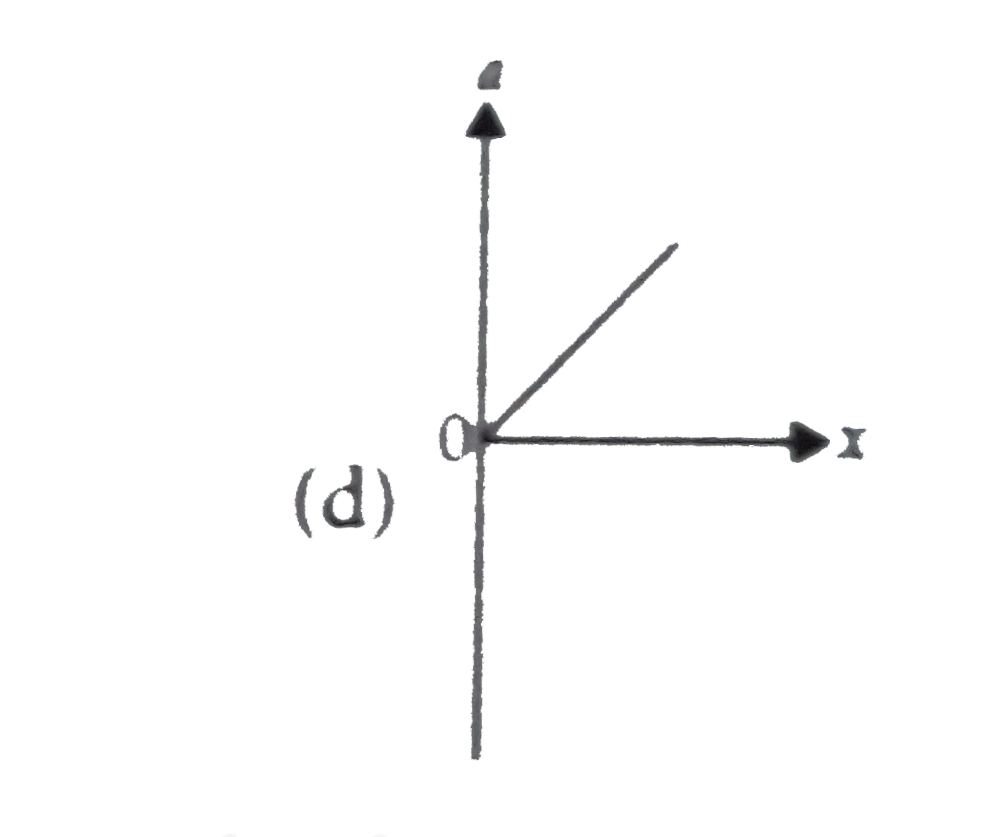
A ball is thrown vertically upwards. Which of the following graph/graphs represent velocity-time graph of the ball during its flight (air resistance is neglected)
View SolutionA ball thrown vertically upward with initial velocity u. Which of the following graphs represent the velocity of ball correctly as function of time?
(Take upward direction as positive)
View SolutionA ball is thrown vertically upwards. Which of the following plots represents the speed-time graph of the ball during its height if the air resistance is ignored ?
View SolutionA ball is thrown vertically upwards. Which of the following plots represent the speed graph of the ball during its flight if the air resistence is not ignored?
View SolutionA ball is thrown vertically upwards. Which of the following plots represent the speed graph of the ball during its flight if the air resistence is not ignored?
View SolutionWhich of the following is wheat fruit?
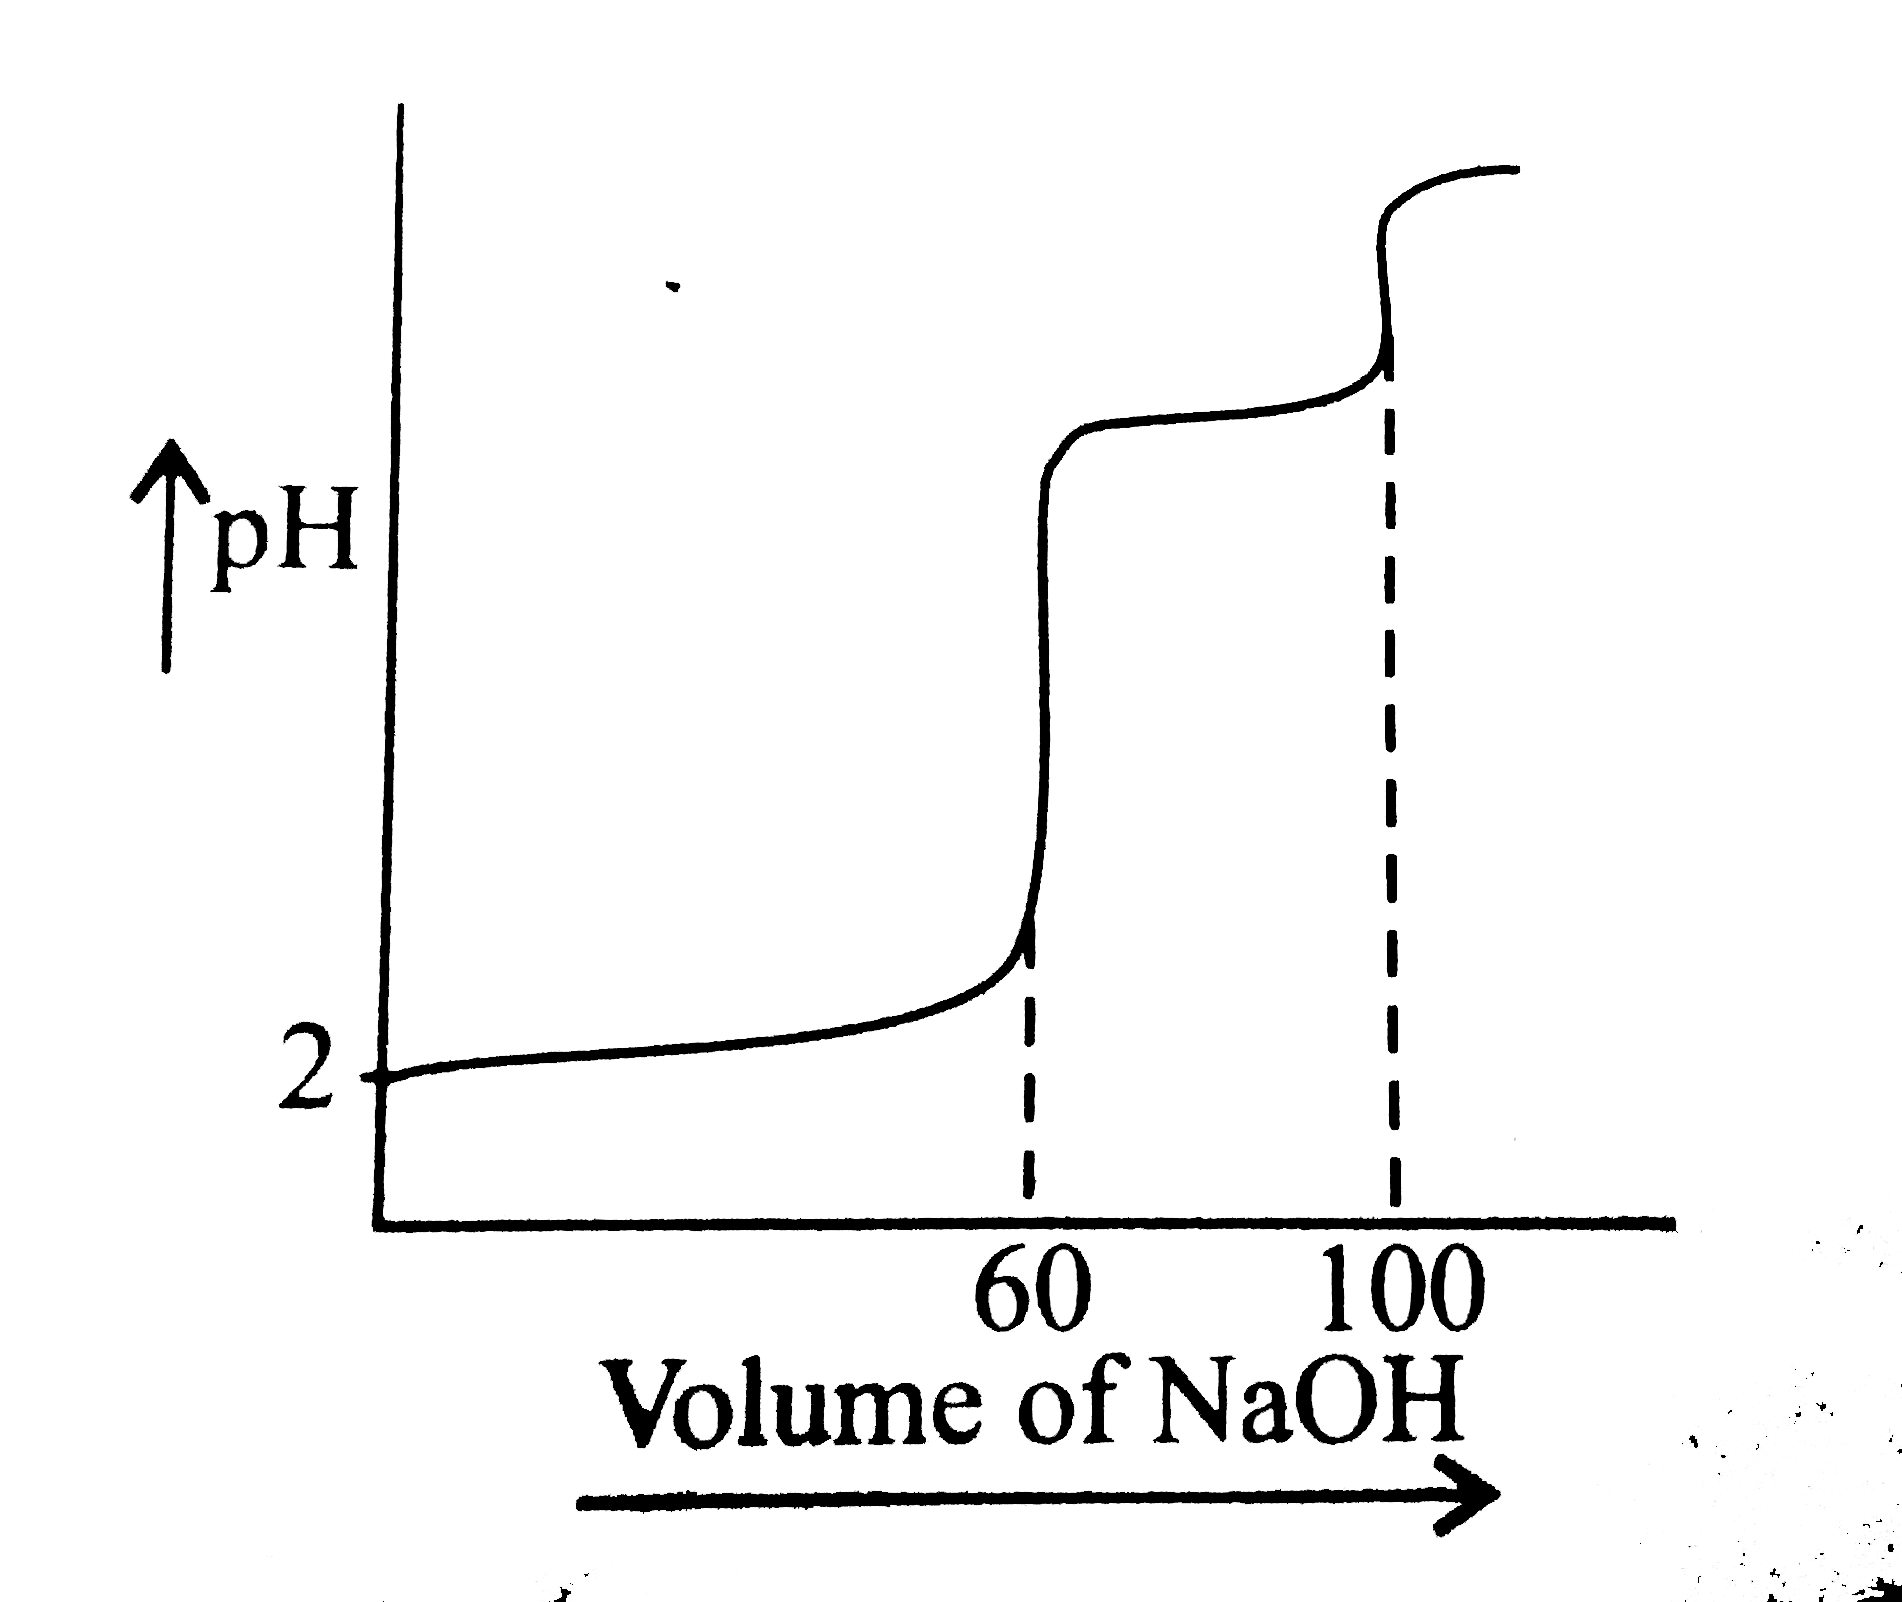
View SolutionThe following graph represents the titration of pH vs volume
View Solution

