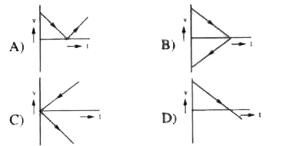
A ball is thrown vertically upwards. Which of the following plots represents the speed-time graph of the ball during its height if the air resistance is ignored ?
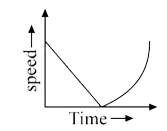
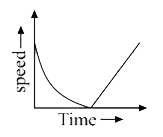
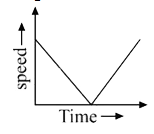
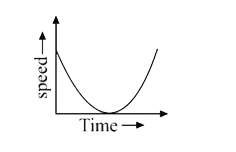
The correct Answer is:C
To determine the speed-time graph of a ball thrown vertically upwards while ignoring air resistance, we can follow these steps:
Step 1: Understand the motion of the ball
When a ball is thrown vertically upwards, it will initially move upwards with a certain speed (initial velocity, u). As it rises, the speed decreases due to the acceleration due to gravity (g), which acts downwards.
Step 2: Analyze the speed change
The speed of the ball decreases as it moves upwards until it reaches its maximum height, where the speed becomes zero. After reaching the maximum height, the ball will start to fall back down, and its speed will increase again due to gravity.
Step 3: Write the equations of motion
The speed of the ball at any time t during its upward motion can be described by the equation:
v=u−gt
where:
- v is the speed at time t
- u is the initial speed
- g is the acceleration due to gravity (approximately 9.81m/s2)
Step 4: Sketch the speed-time graph
1. Upward motion: As the ball moves up, the speed decreases linearly from u to 0 at the maximum height. This part of the graph is a straight line sloping downwards.
2. Downward motion: After reaching the maximum height, the ball starts falling down. The speed increases from 0 back to u (but in the downward direction). This part of the graph is also a straight line, but it slopes upwards.
Step 5: Combine the two parts
The complete speed-time graph will consist of two linear segments:
- A downward sloping line from u to 0 (upward motion)
- An upward sloping line from 0 back to u (downward motion)
Conclusion
The speed-time graph of the ball thrown vertically upwards, ignoring air resistance, is a V-shaped graph with the vertex at the maximum height where the speed is zero.
When a ball is thrown vertically upwards, it will initially move upwards with a certain speed (initial velocity, u). As it rises, the speed decreases due to the acceleration due to gravity (g), which acts downwards.
The speed of the ball decreases as it moves upwards until it reaches its maximum height, where the speed becomes zero. After reaching the maximum height, the ball will start to fall back down, and its speed will increase again due to gravity.
The speed of the ball at any time t during its upward motion can be described by the equation:
v=u−gt
where:
- v is the speed at time t
- u is the initial speed
- g is the acceleration due to gravity (approximately 9.81m/s2)
1. Upward motion: As the ball moves up, the speed decreases linearly from u to 0 at the maximum height. This part of the graph is a straight line sloping downwards.
2. Downward motion: After reaching the maximum height, the ball starts falling down. The speed increases from 0 back to u (but in the downward direction). This part of the graph is also a straight line, but it slopes upwards.
The complete speed-time graph will consist of two linear segments:
- A downward sloping line from u to 0 (upward motion)
- An upward sloping line from 0 back to u (downward motion)
The speed-time graph of the ball thrown vertically upwards, ignoring air resistance, is a V-shaped graph with the vertex at the maximum height where the speed is zero.
Topper's Solved these Questions
Similar Questions
Which of the following is wheat fruit?
View SolutionA ball is thrown vertically upwards. Which of the following plots represent the speed graph of the ball during its flight if the air resistence is not ignored?
View SolutionA ball is thrown vertically upwards. Which of the following plots represent the speed graph of the ball during its flight if the air resistence is not ignored?
View SolutionA ball is thrown vertically upwards. Which of the following graph/graphs represent velocity-time graph of the ball during its flight (air resistance is neglected)
View SolutionA body is thrown vertically upwards. Which one of the following graphs correctly represent the velocity vs time?
View SolutionThe speed -time graph of the ball in the above situation is.
View SolutionA ball is thrown vertically upward. What is the magnitude of velocity at the highest point ?
View SolutionA body is thrown vertically upwards which graph represents variation of velocity w.r.t time
View SolutionA ball is thrown vertically upwards. It returns 6 s later. Calculate the greatest height reached by the ball
View SolutionA ball is thrown vertically upwards from the ground. If T1 and T2 are the respective time taken in going up and coming down, and the air resistance is not ignored, then
View Solution

