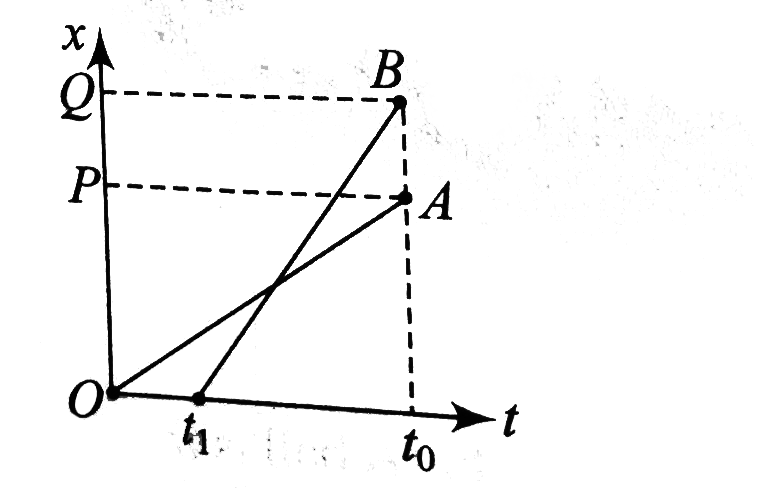
The position-time (x-t) graphs for two children A and B returning from their school O to their homes P and Q respectively along straight line path (taken as x-axis) are shown in figure. Choose the correct statement (s):
A lives closer to the school B
A starts from the school earlier than B
A and B have equal average velocities from 0 to t0.
B overtakes A on the way
(i) A lives closer to the school than (A) lives at a distance OP and b at a distance OQ from the school .
(ii) (A) Starts from the school earlier than (B)
(iii) Walks faster same
Topper's Solved these Questions
- KINEMATICS OF A PARTICLE BOOK - VMC MODULES ENGLISHCHAPTER - KINEMATICS OF A PARTICLE EXERCISE - LEVEL 1
75 Videos
- KINEMATICS OF A PARTICLE BOOK - VMC MODULES ENGLISHCHAPTER - KINEMATICS OF A PARTICLE EXERCISE - LEVEL 2
65 Videos
- JEE MAIN REVISON TEST-23BOOK - VMC MODULES ENGLISHCHAPTER - JEE MAIN REVISON TEST-23EXERCISE - PHYSICS (SECTION 2)
1 Videos
- LAWS OF MOTION BOOK - VMC MODULES ENGLISHCHAPTER - LAWS OF MOTION EXERCISE - IMPECCABLE
53 Videos
Similar Questions
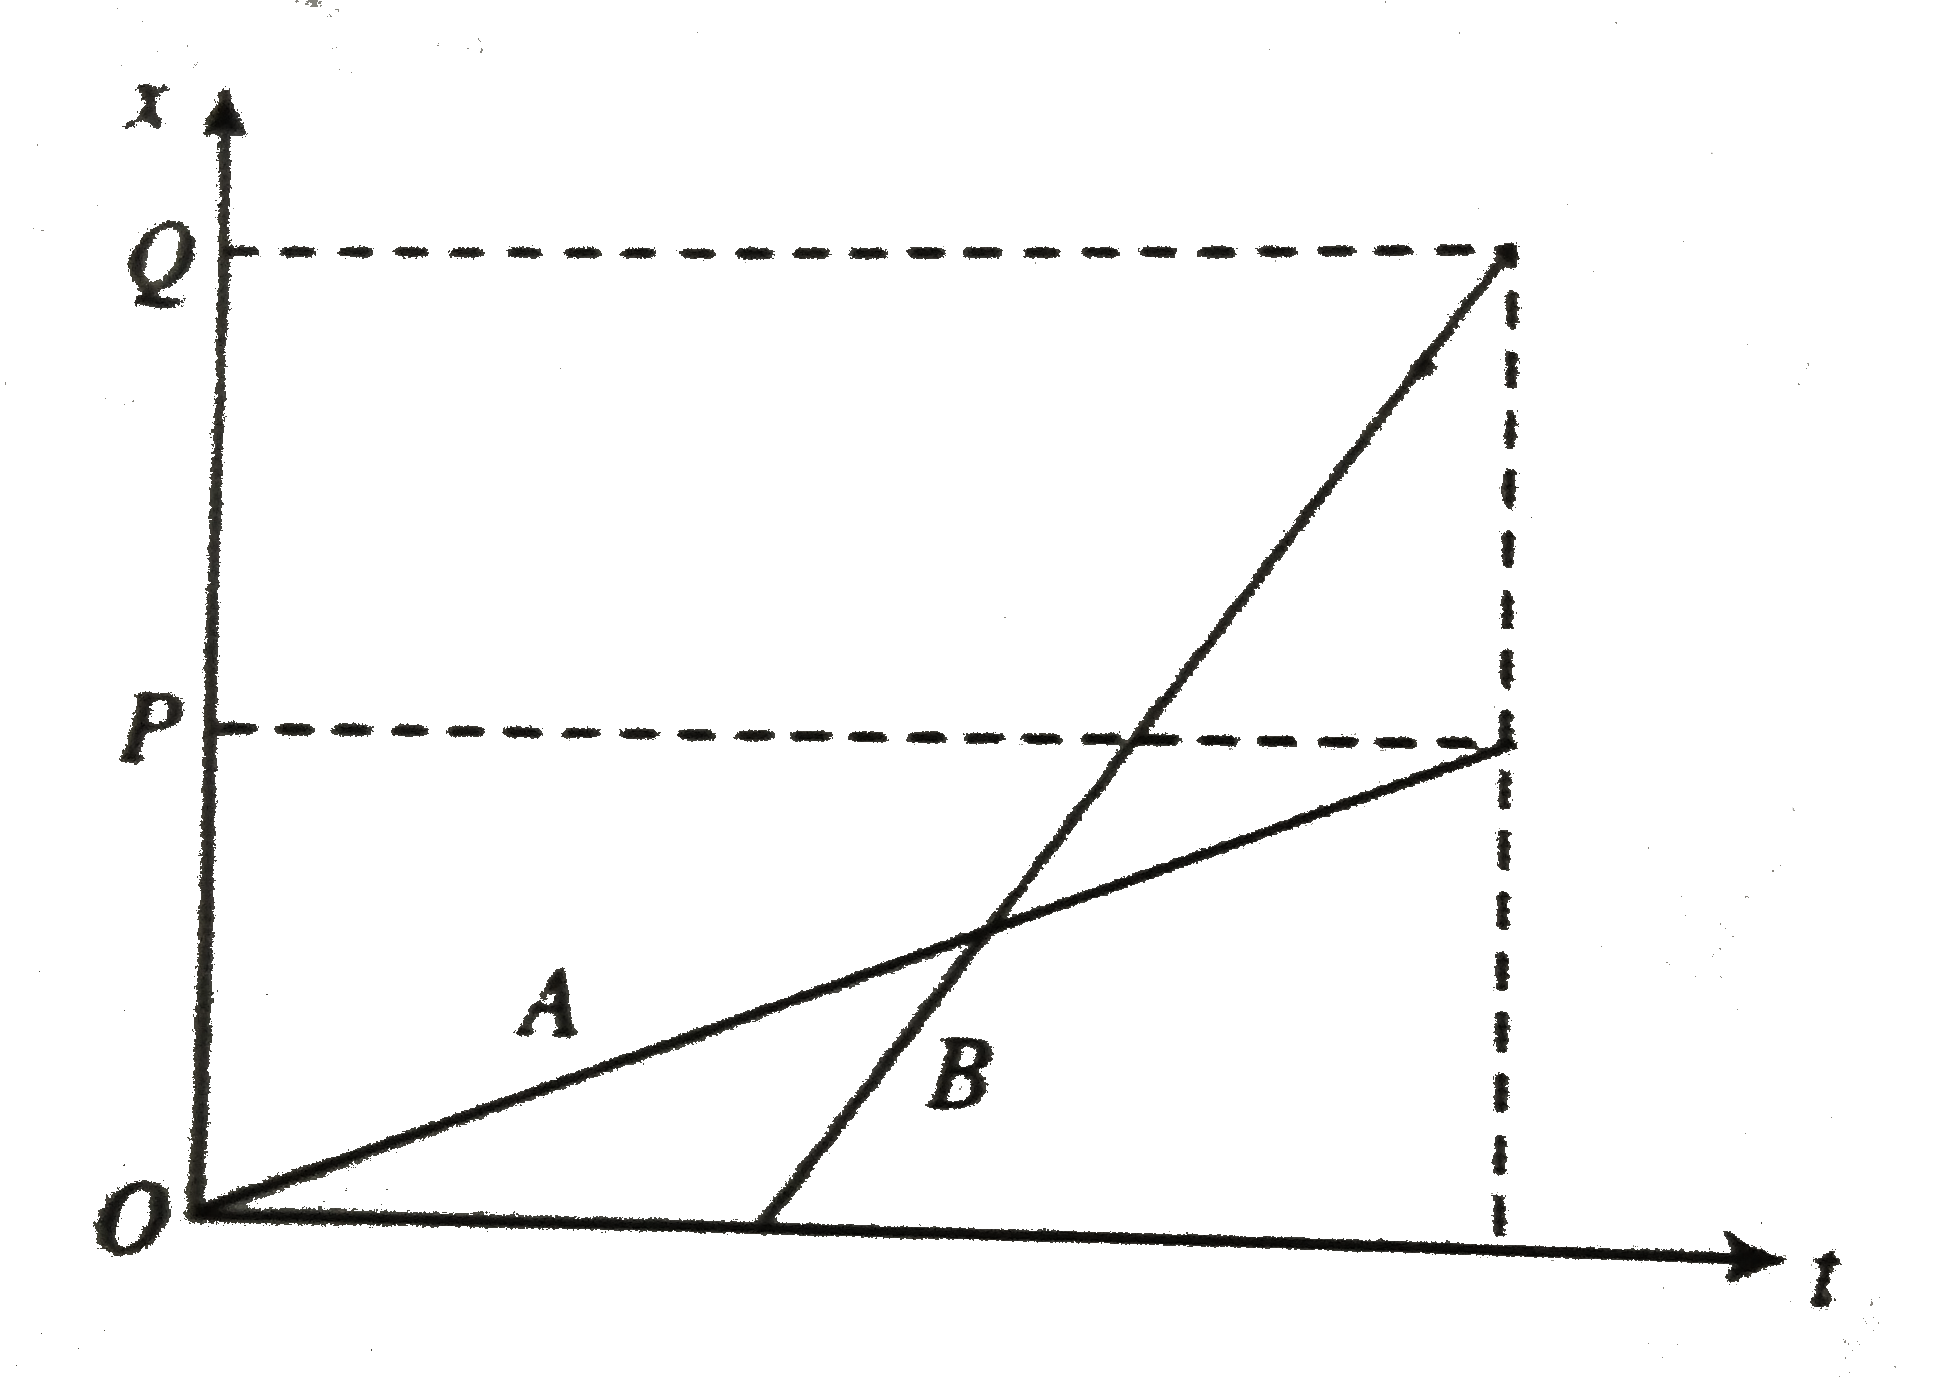
The position-time (x-t) graphs for two children A and B returning from their school O to their homes P and Q, respectively, are shown in . Choose the correct entries in the brackets
 .
.
a.(A/B) Iives closer to school than (B/A).
b. (A/B) starts from the school earlier than (B/A).
c. (A/B) walks faster than (B/A).
d. A and B reach home at the (same//differnt) time.
e. (A//B) overtakes on the road (once//twice).
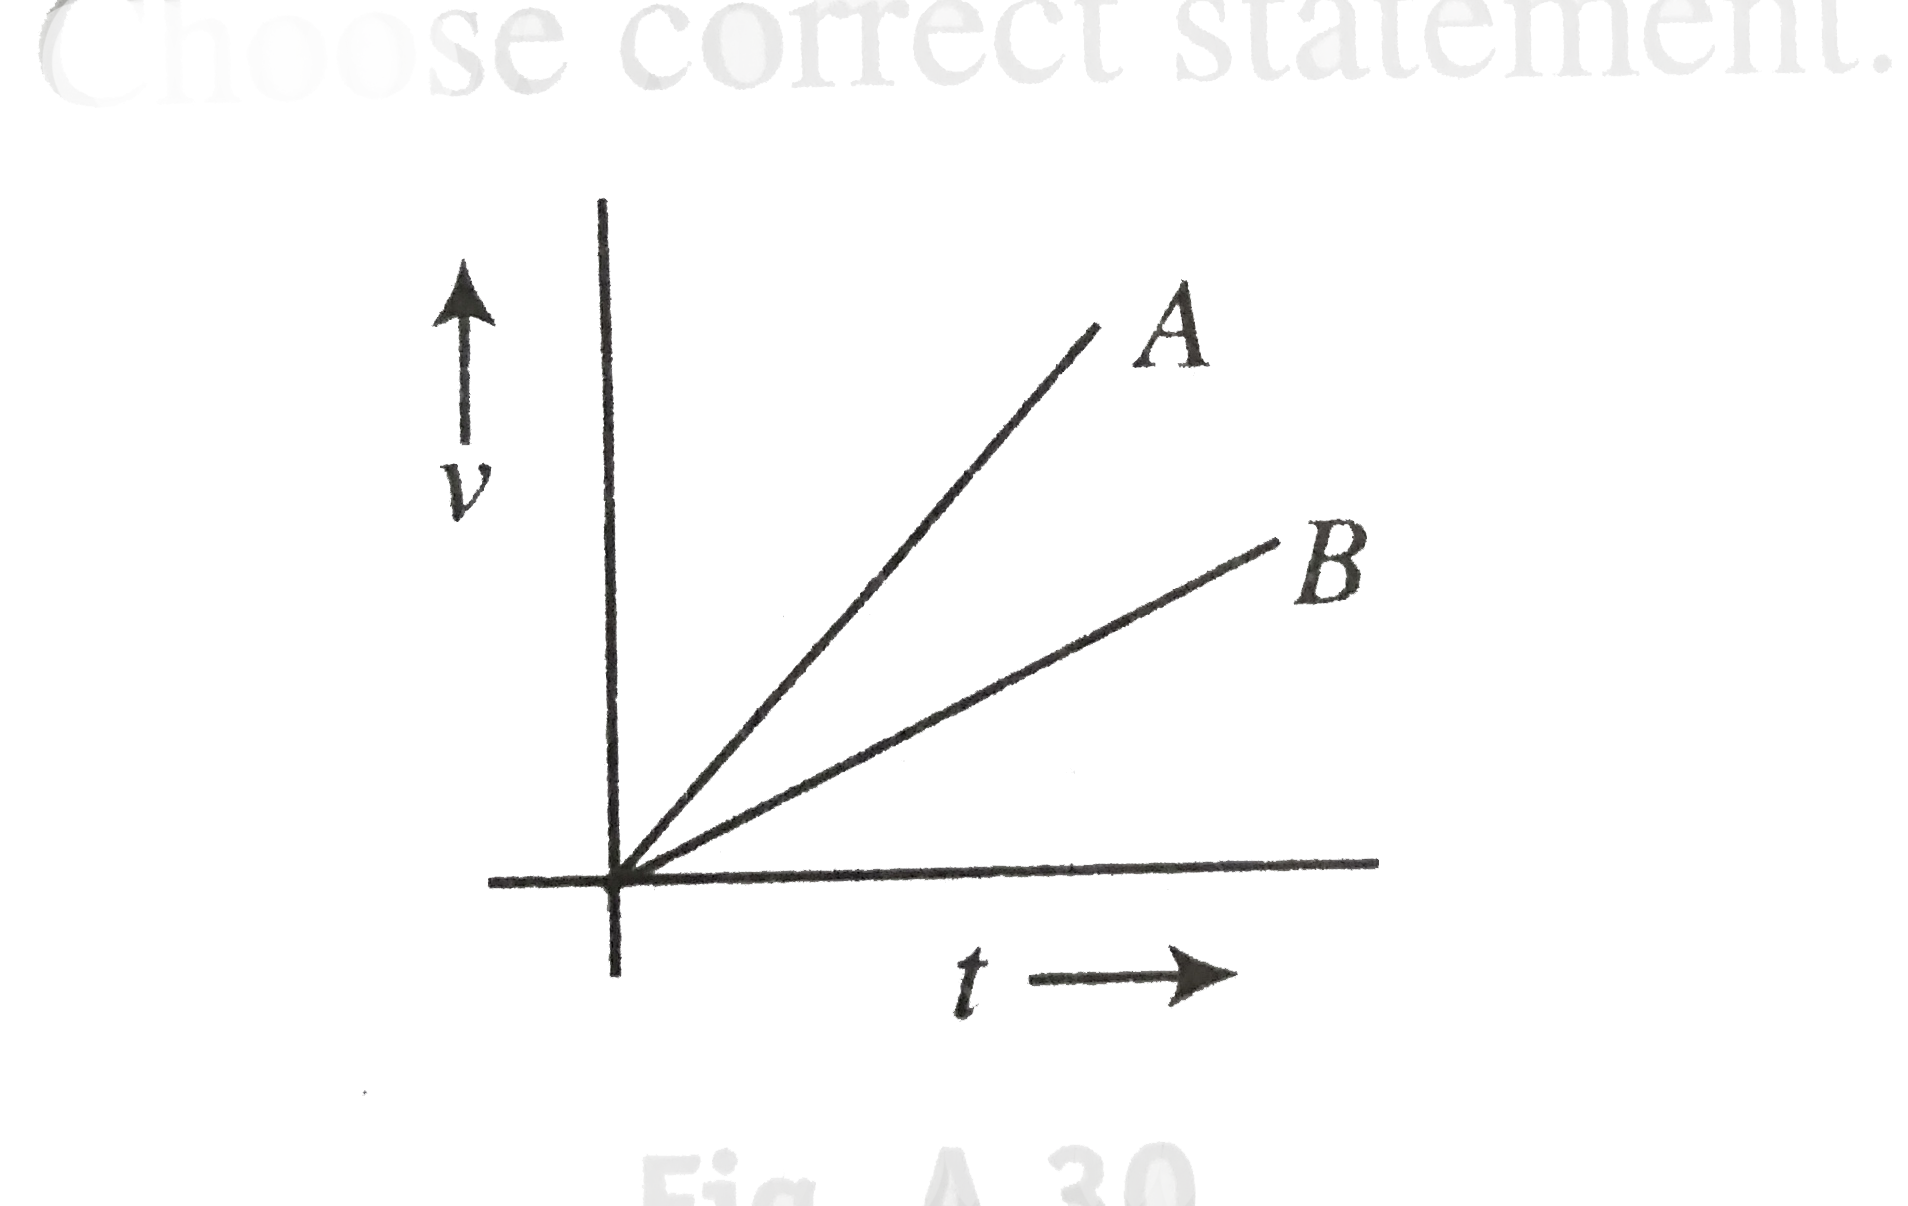
View SolutionThe velocity - time graph of two bodies A and B is shown in figure. Choose correct statement.
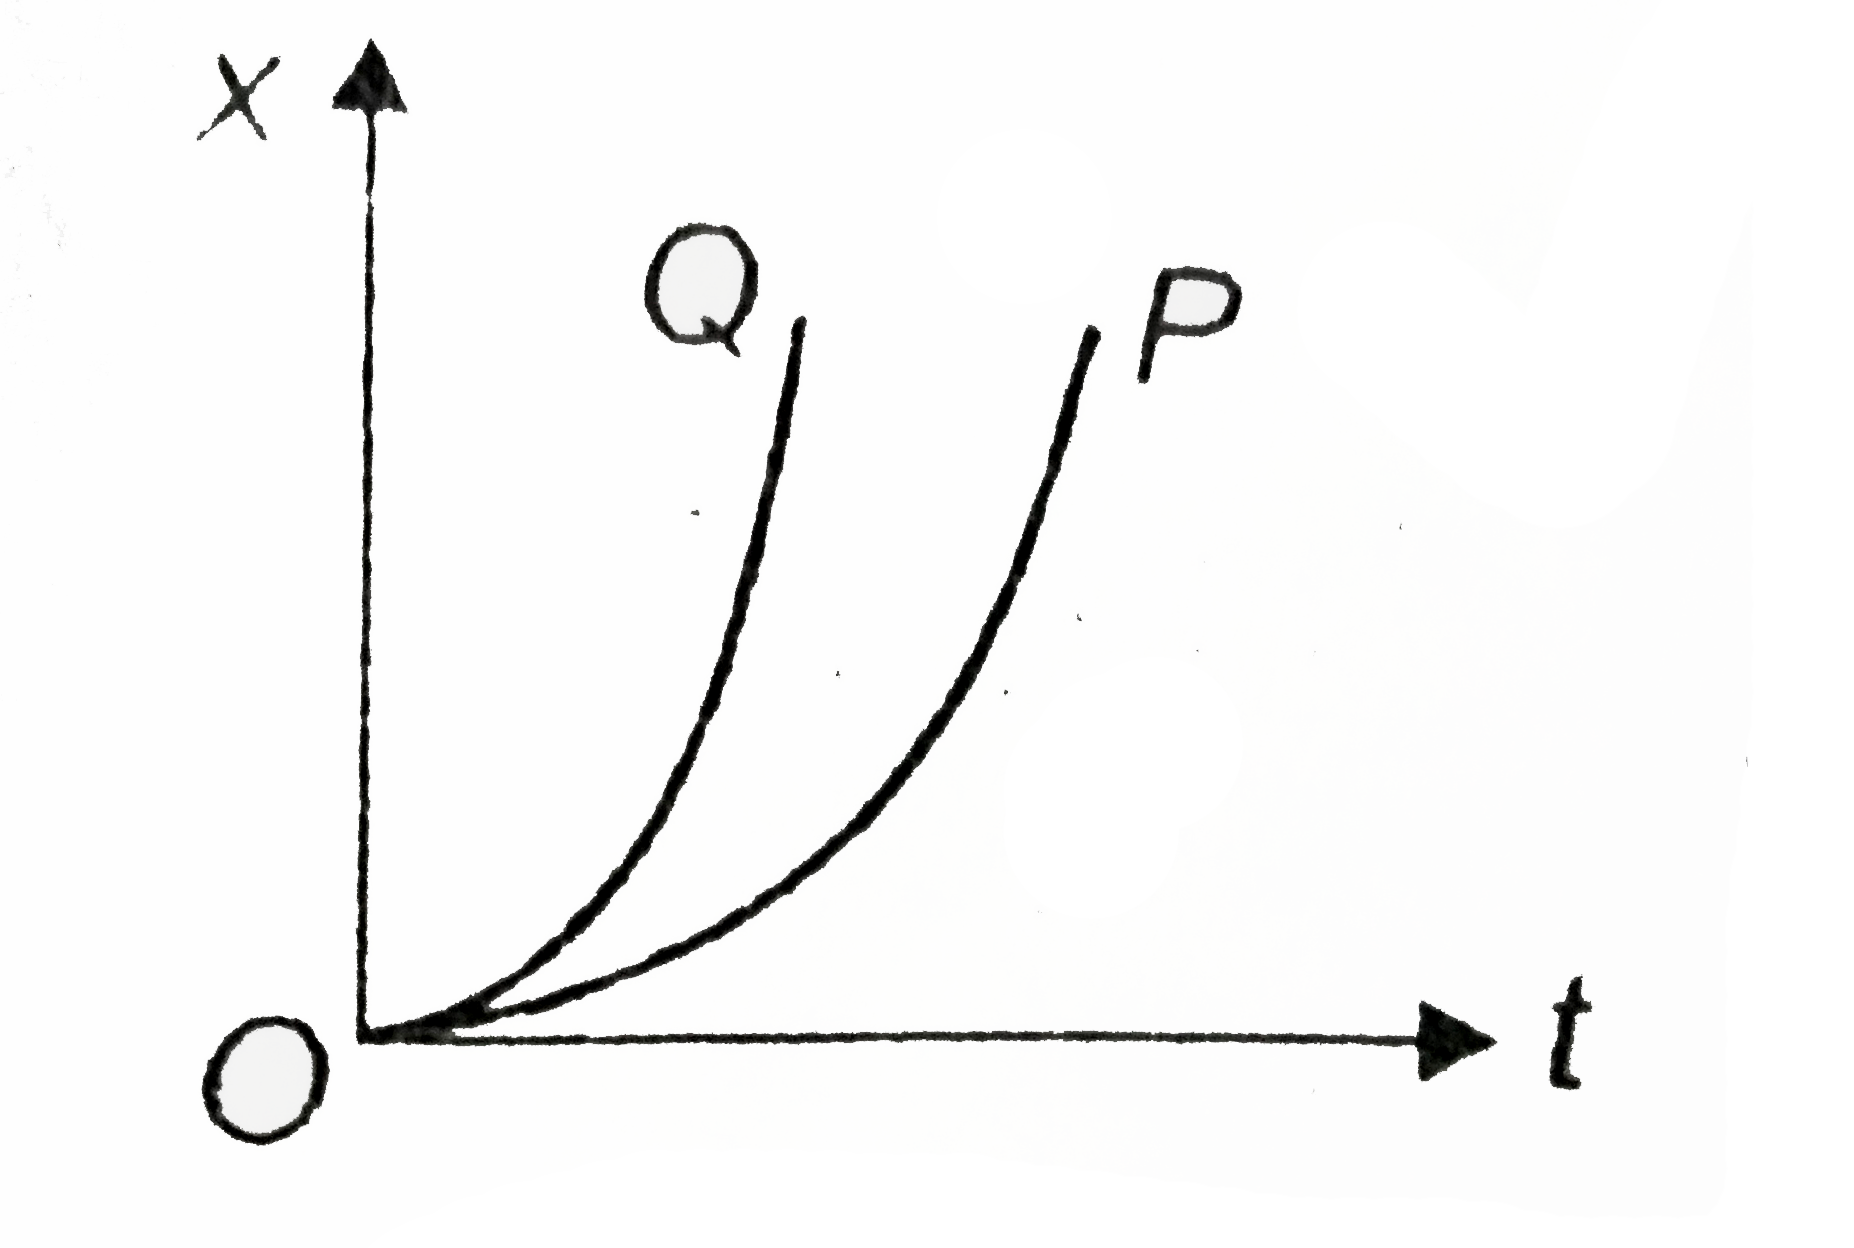
View SolutionThe position-time graph for two particles P and Q moving on x-axis is shown in the figure. Then
View SolutionFor a particle moving along x-axis, a scaled x-6 graph is shown in figure. Mark the correct statement (s).
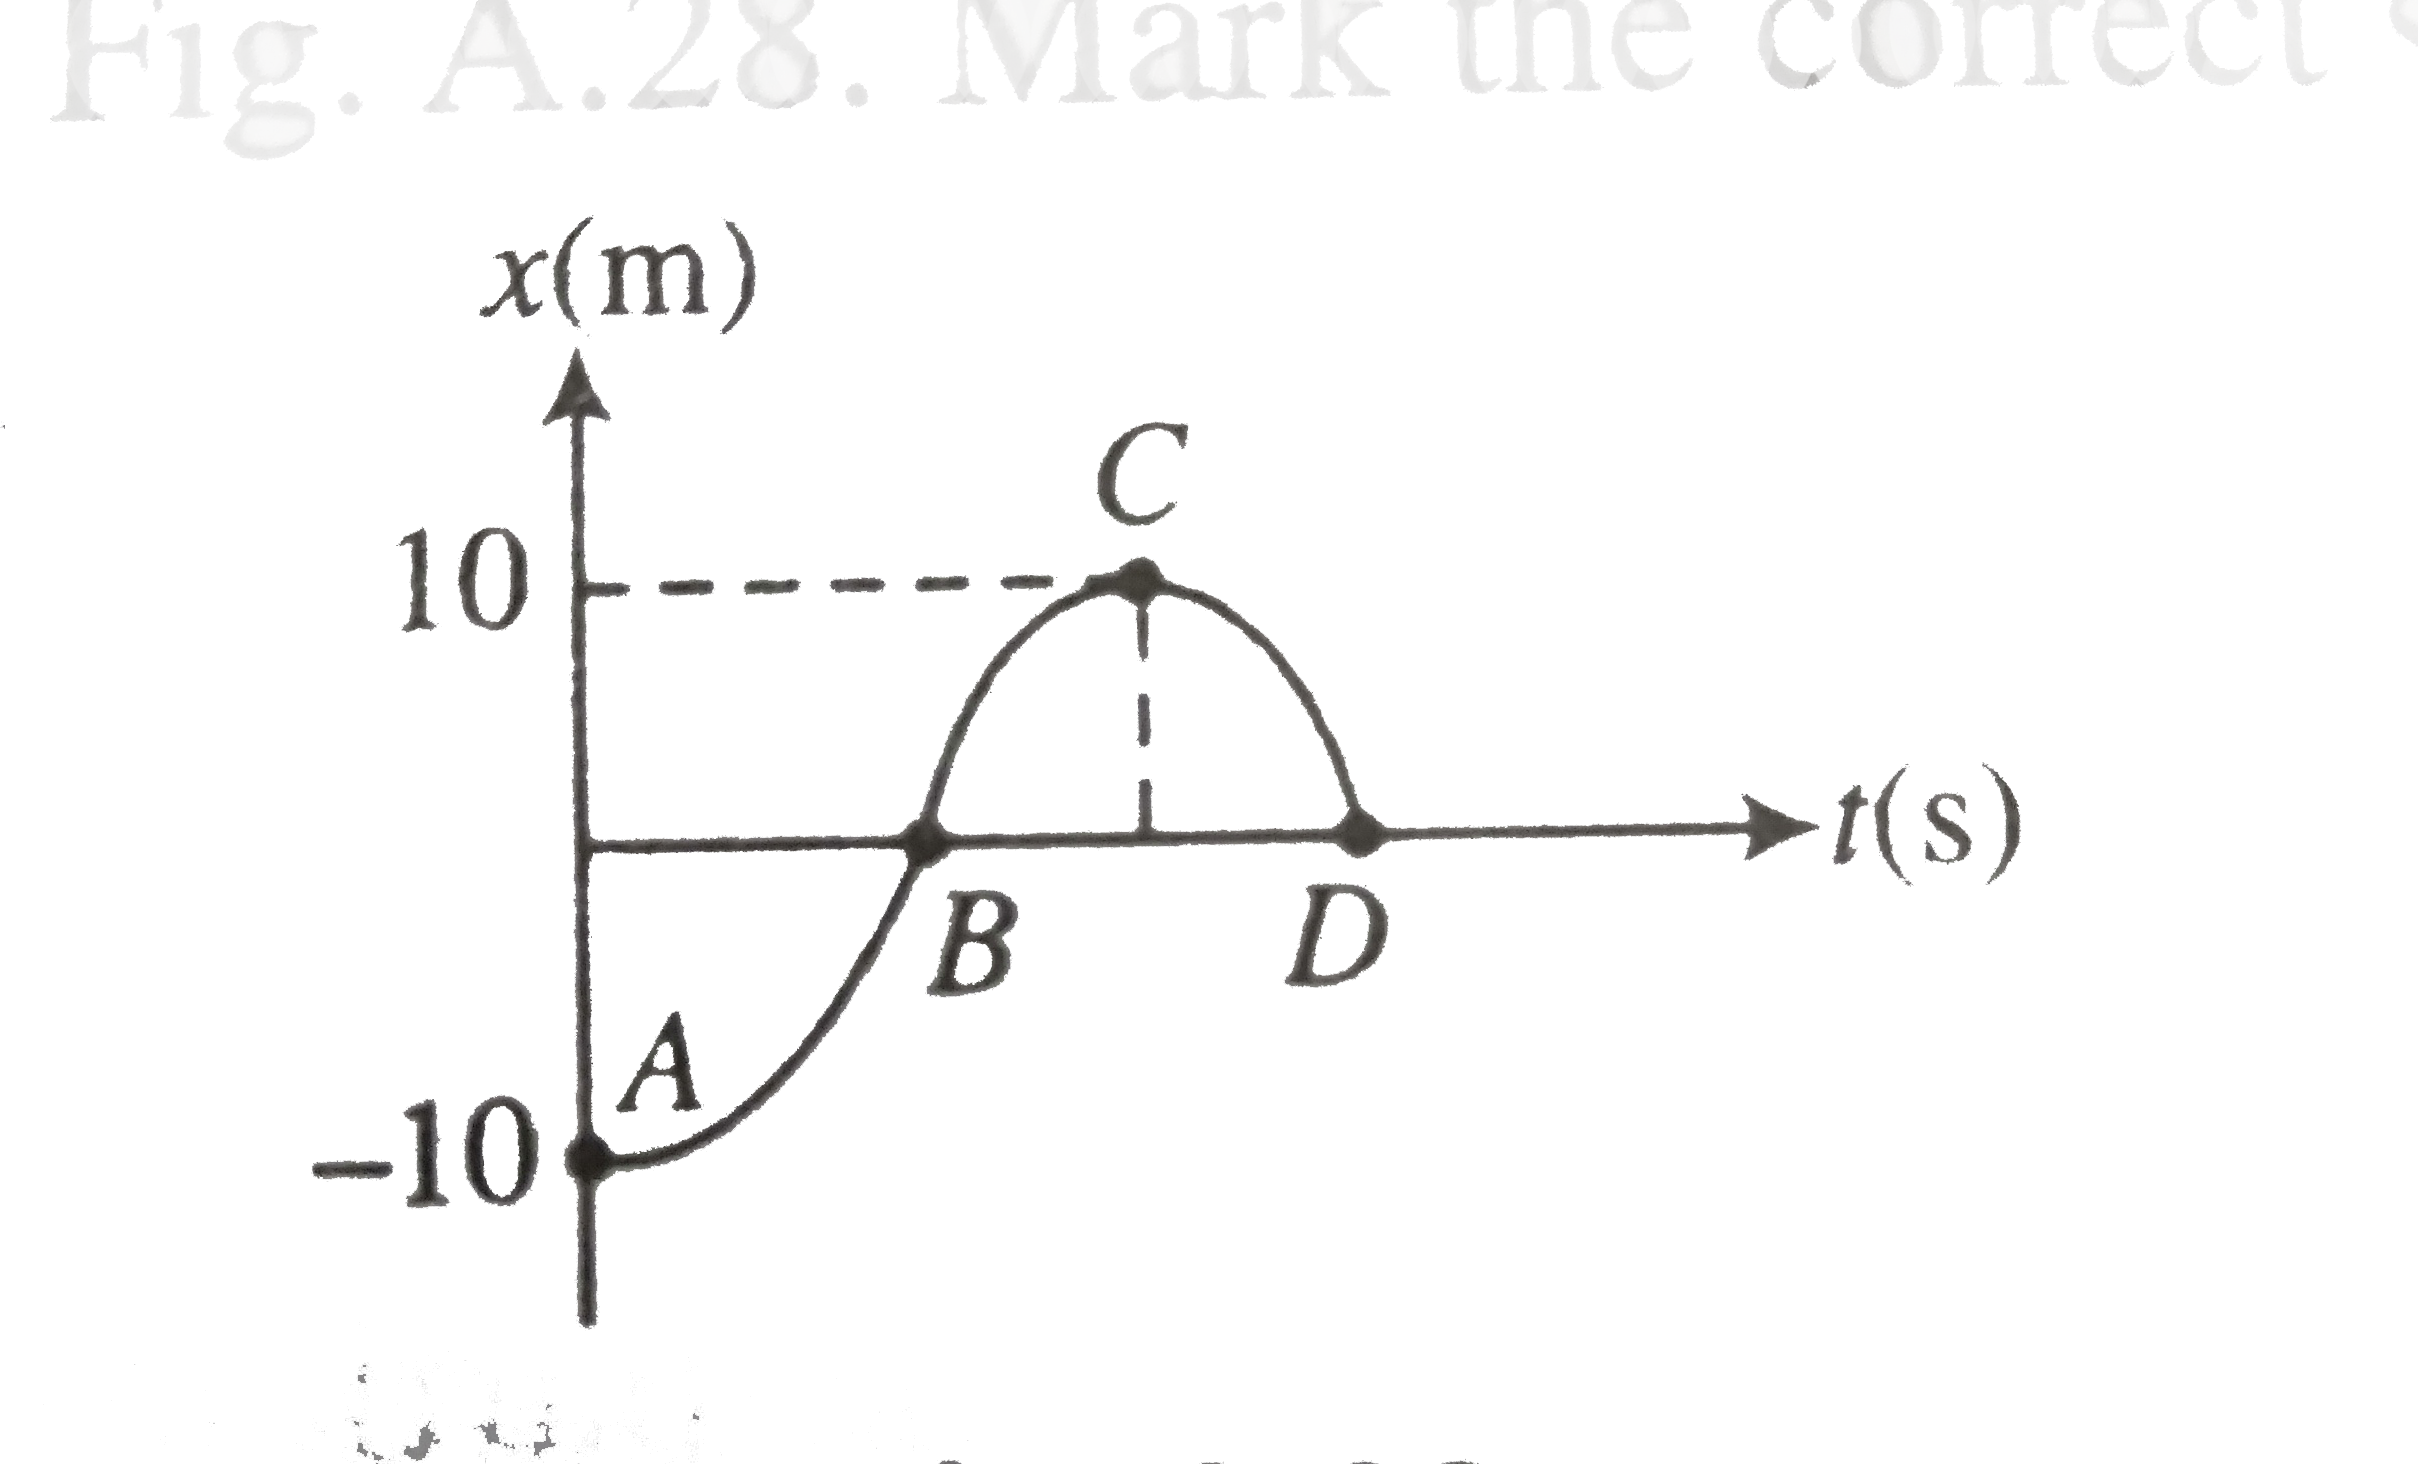
View SolutionDisplacment-time graph of a particle moving in a straight line is as shown in figure. Choose the INCORRECT statement(s)
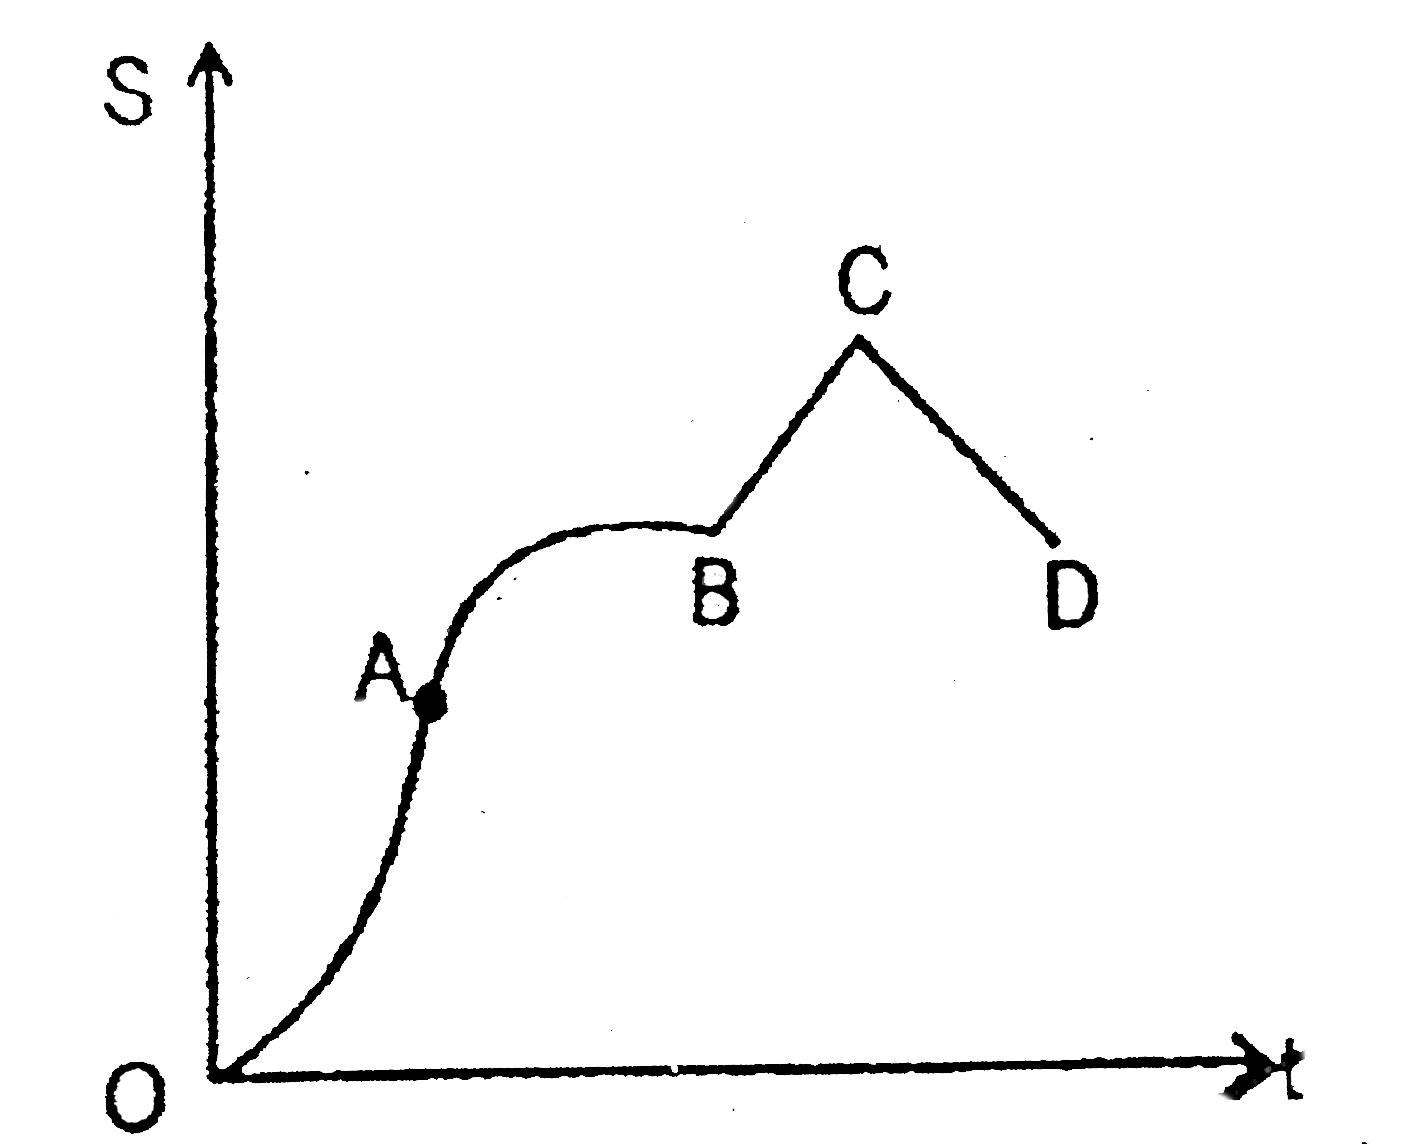
View SolutionDisplacement time graph of a particle moving in a straight line is as shown in figure. Select the correct alternative (s) :
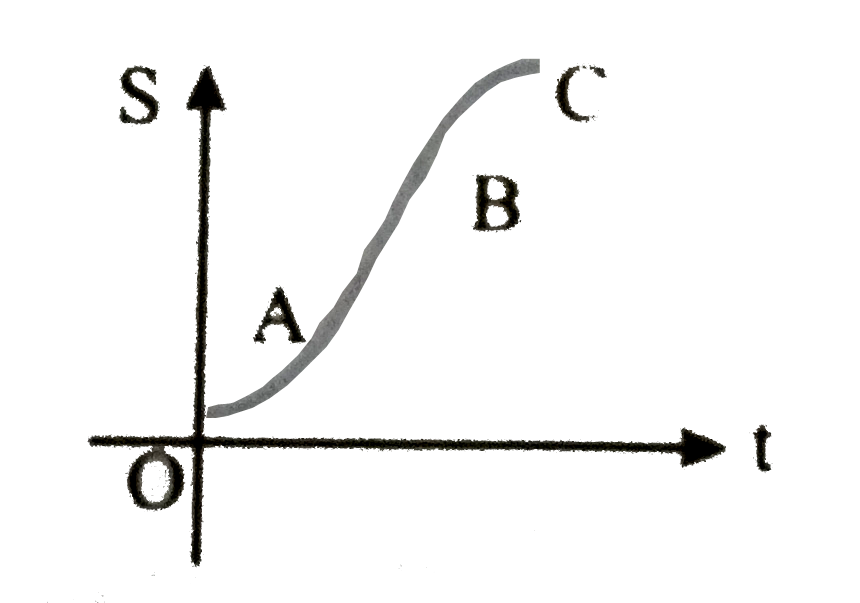 .
.
View Solution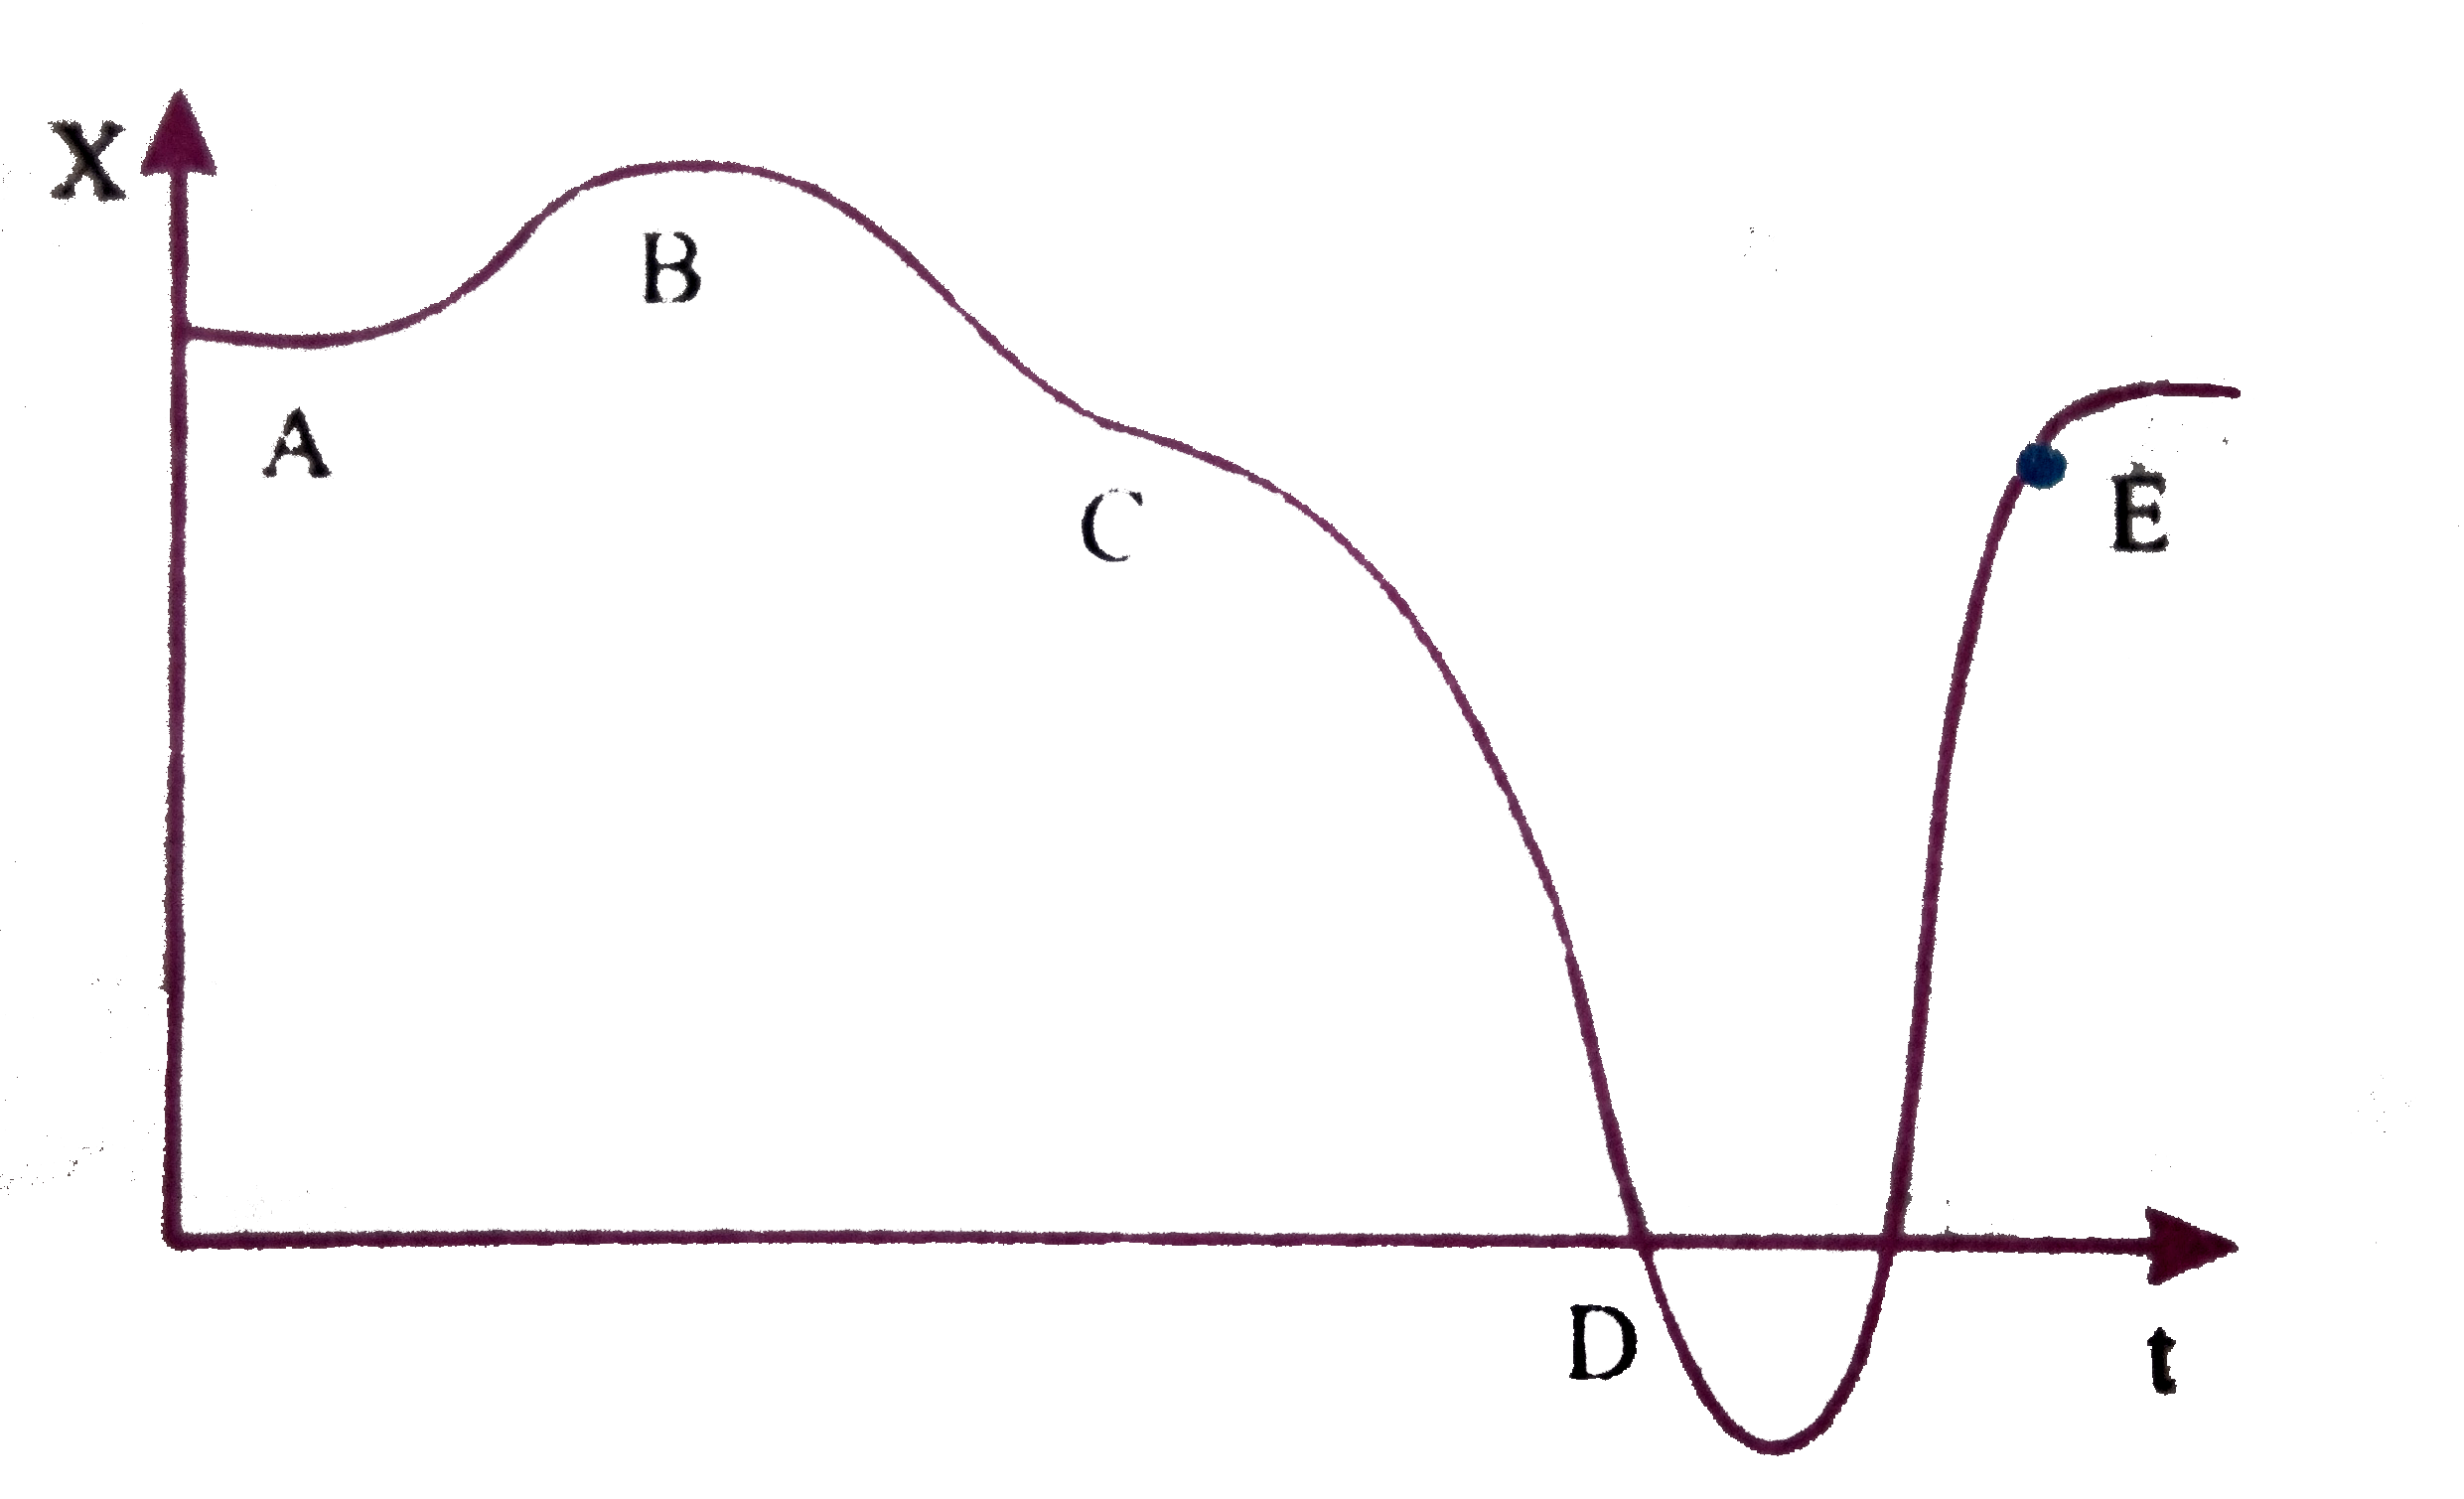
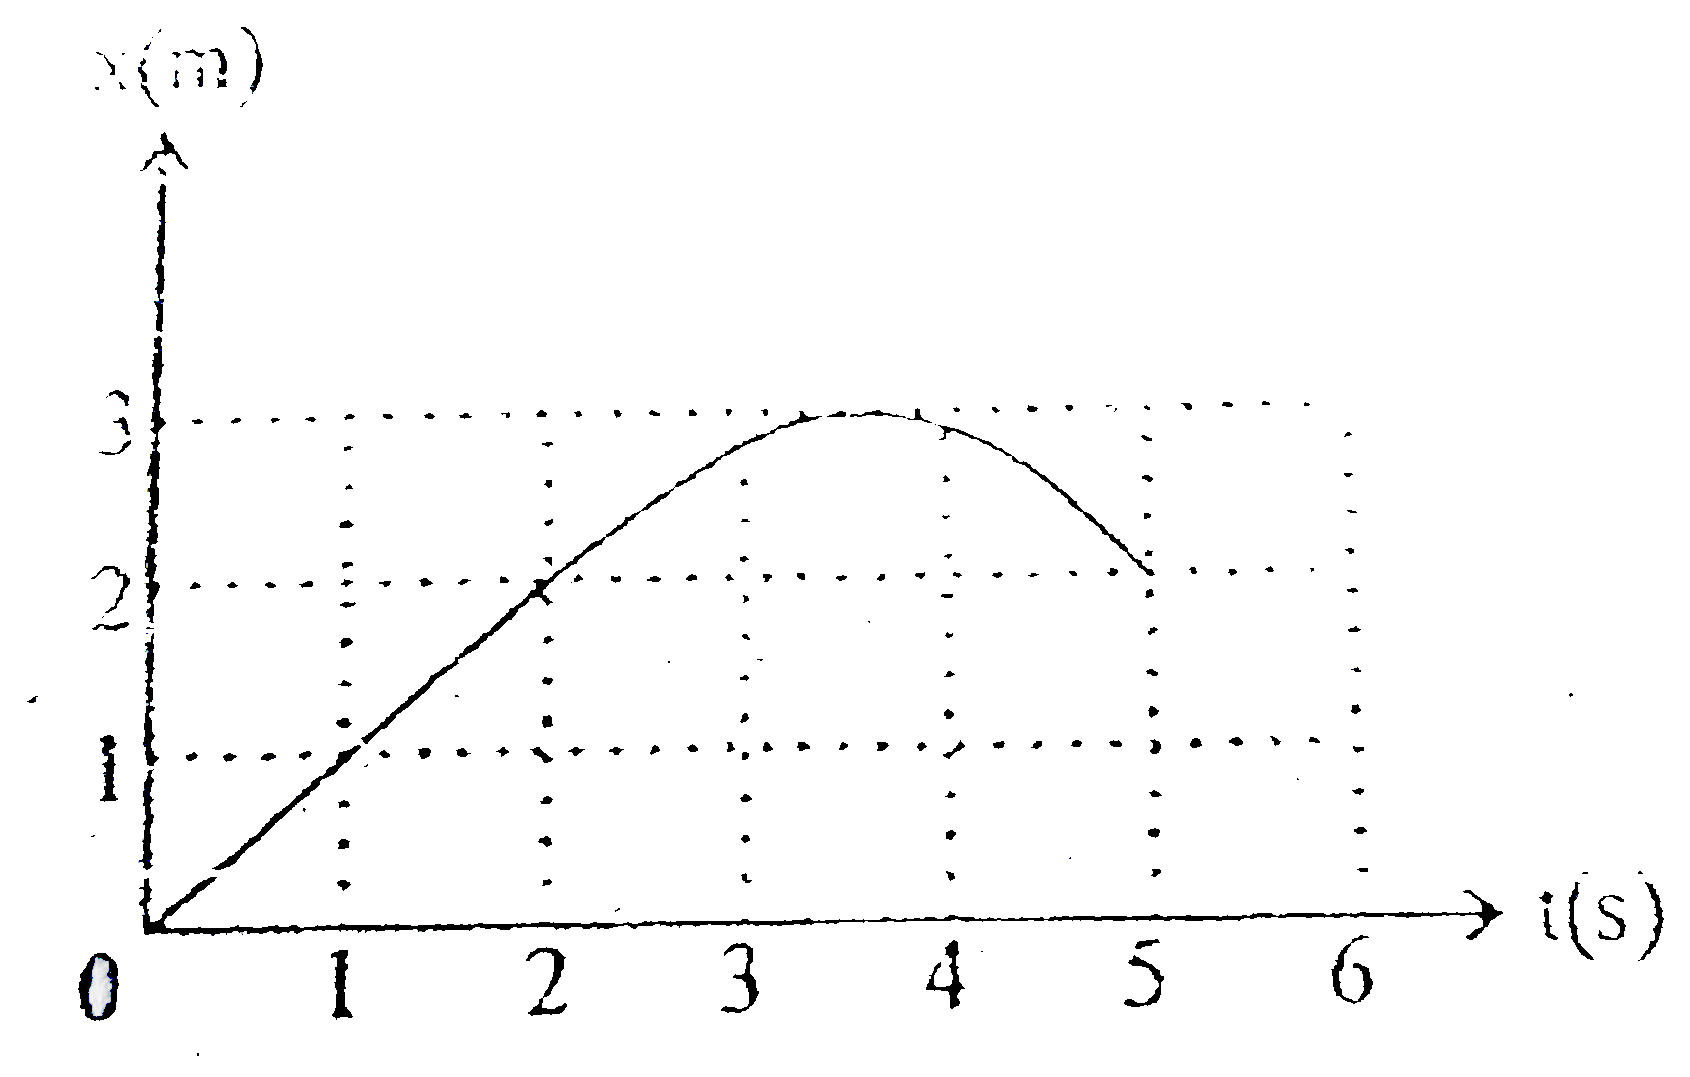
A graph of x versus t is shown in figure. Choose correct alternative from below.
View SolutionA particle moved along the X−axis according to the graph shown in Figure. Choose the incorrct options.
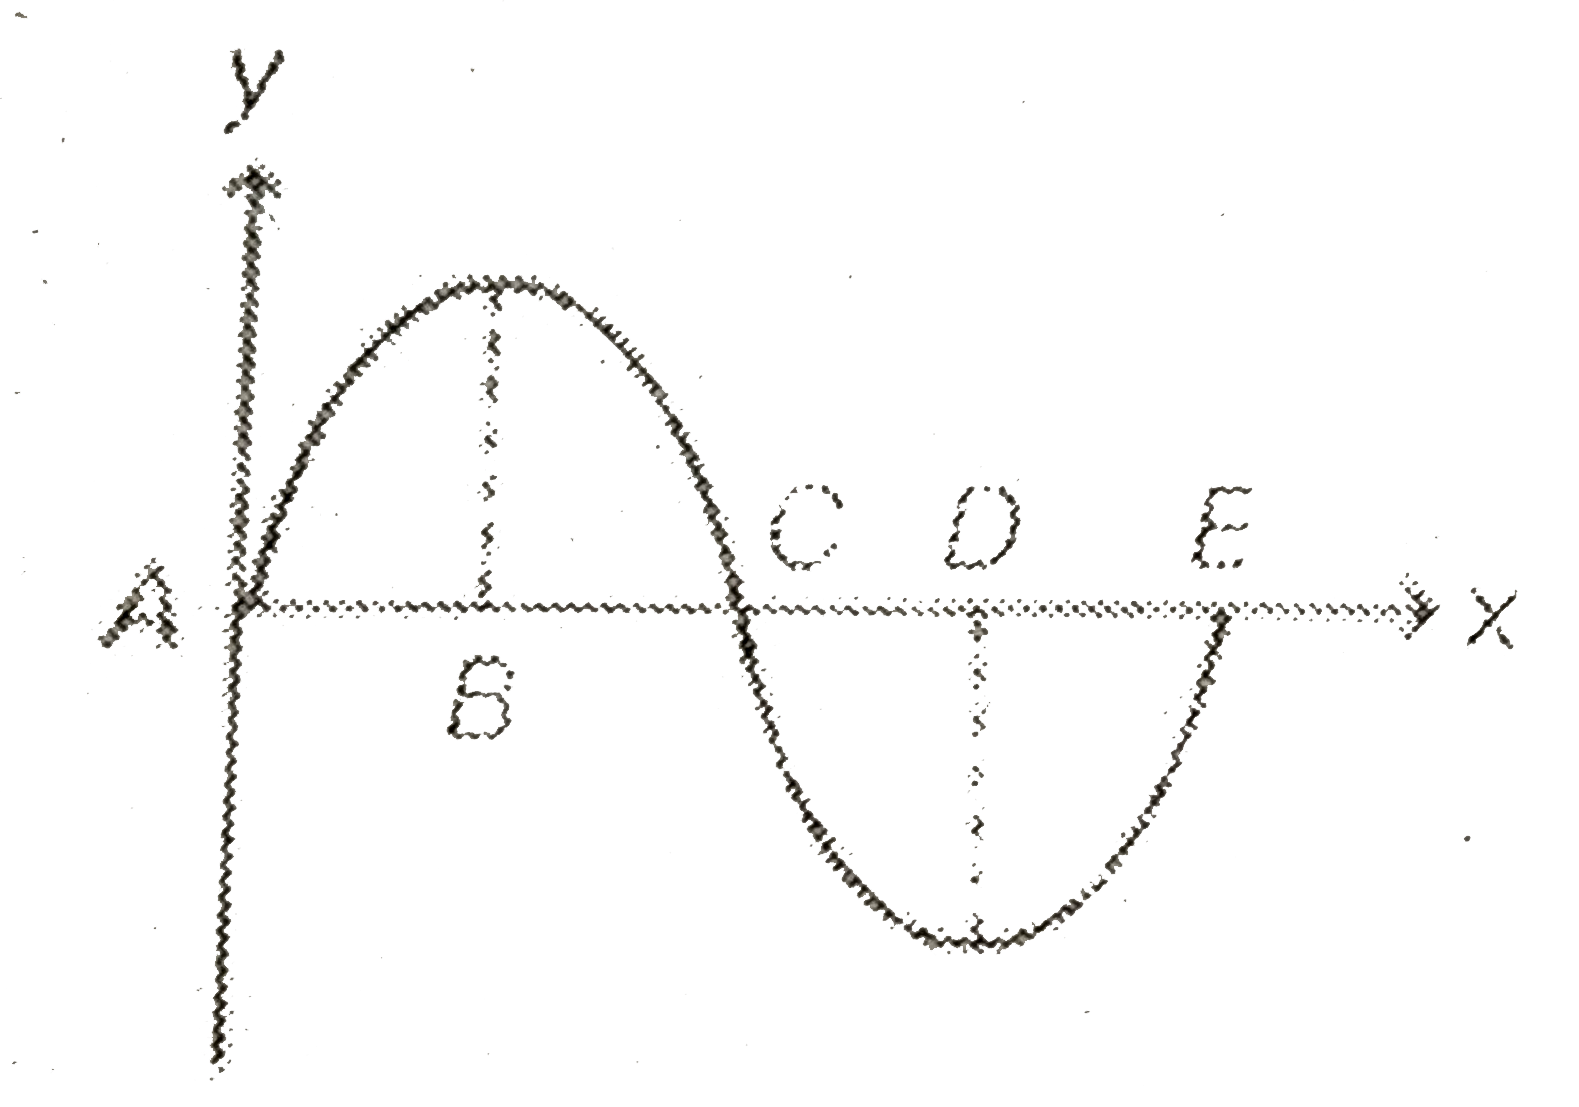
View SolutionSound wave is travellimg along positive x -direction . Displacement (y) of particles from their mean position at position x is a shown in figure . Choose the correct alternative(s).
View SolutionHeat energy at constant rate is given to two substances P and Q. If variation of temperature (T) of substances with time (t) is as shown in figure, then select the correct statement
View Solution
