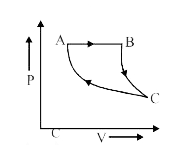
For a given thermodynamic process, the P – V diagram is as shown below:
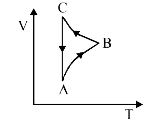
Which of the following is the V – T diagram for the process?
A→B: isobaric
B→C: adiabatic
C→A : isothermal
A
B
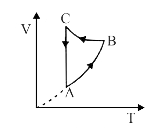
C
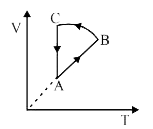
D
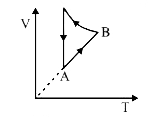
Video Solution
Text Solution
The correct Answer is:D
Use transformation of gragphs
|
Topper's Solved these Questions
- GASEOUS STATE & THERMODYNAMICSBOOK - VMC MODULES ENGLISHCHAPTER - GASEOUS STATE & THERMODYNAMICSEXERCISE - JEE MAIN (ARCHIVE )
81 Videos
- GASEOUS STATE & THERMODYNAMICSBOOK - VMC MODULES ENGLISHCHAPTER - GASEOUS STATE & THERMODYNAMICSEXERCISE - JEE ADVANCED (ARCHIVE )
111 Videos
- GASEOUS STATE & THERMODYNAMICSBOOK - VMC MODULES ENGLISHCHAPTER - GASEOUS STATE & THERMODYNAMICSEXERCISE - Level - 1
75 Videos
- ENERGY & MOMENTUMBOOK - VMC MODULES ENGLISHCHAPTER - ENERGY & MOMENTUMEXERCISE - JEE ADVANCE (ARCHIVE) - TRUE/FALSE TYPE
1 Videos
- GRAVITATIONBOOK - VMC MODULES ENGLISHCHAPTER - GRAVITATIONEXERCISE - JEE Advance (Archive) TRUE/FALSE
1 Videos
Similar Questions
Knowledge Check
Which of the following P-V diagram represent the graph of isometric process?
A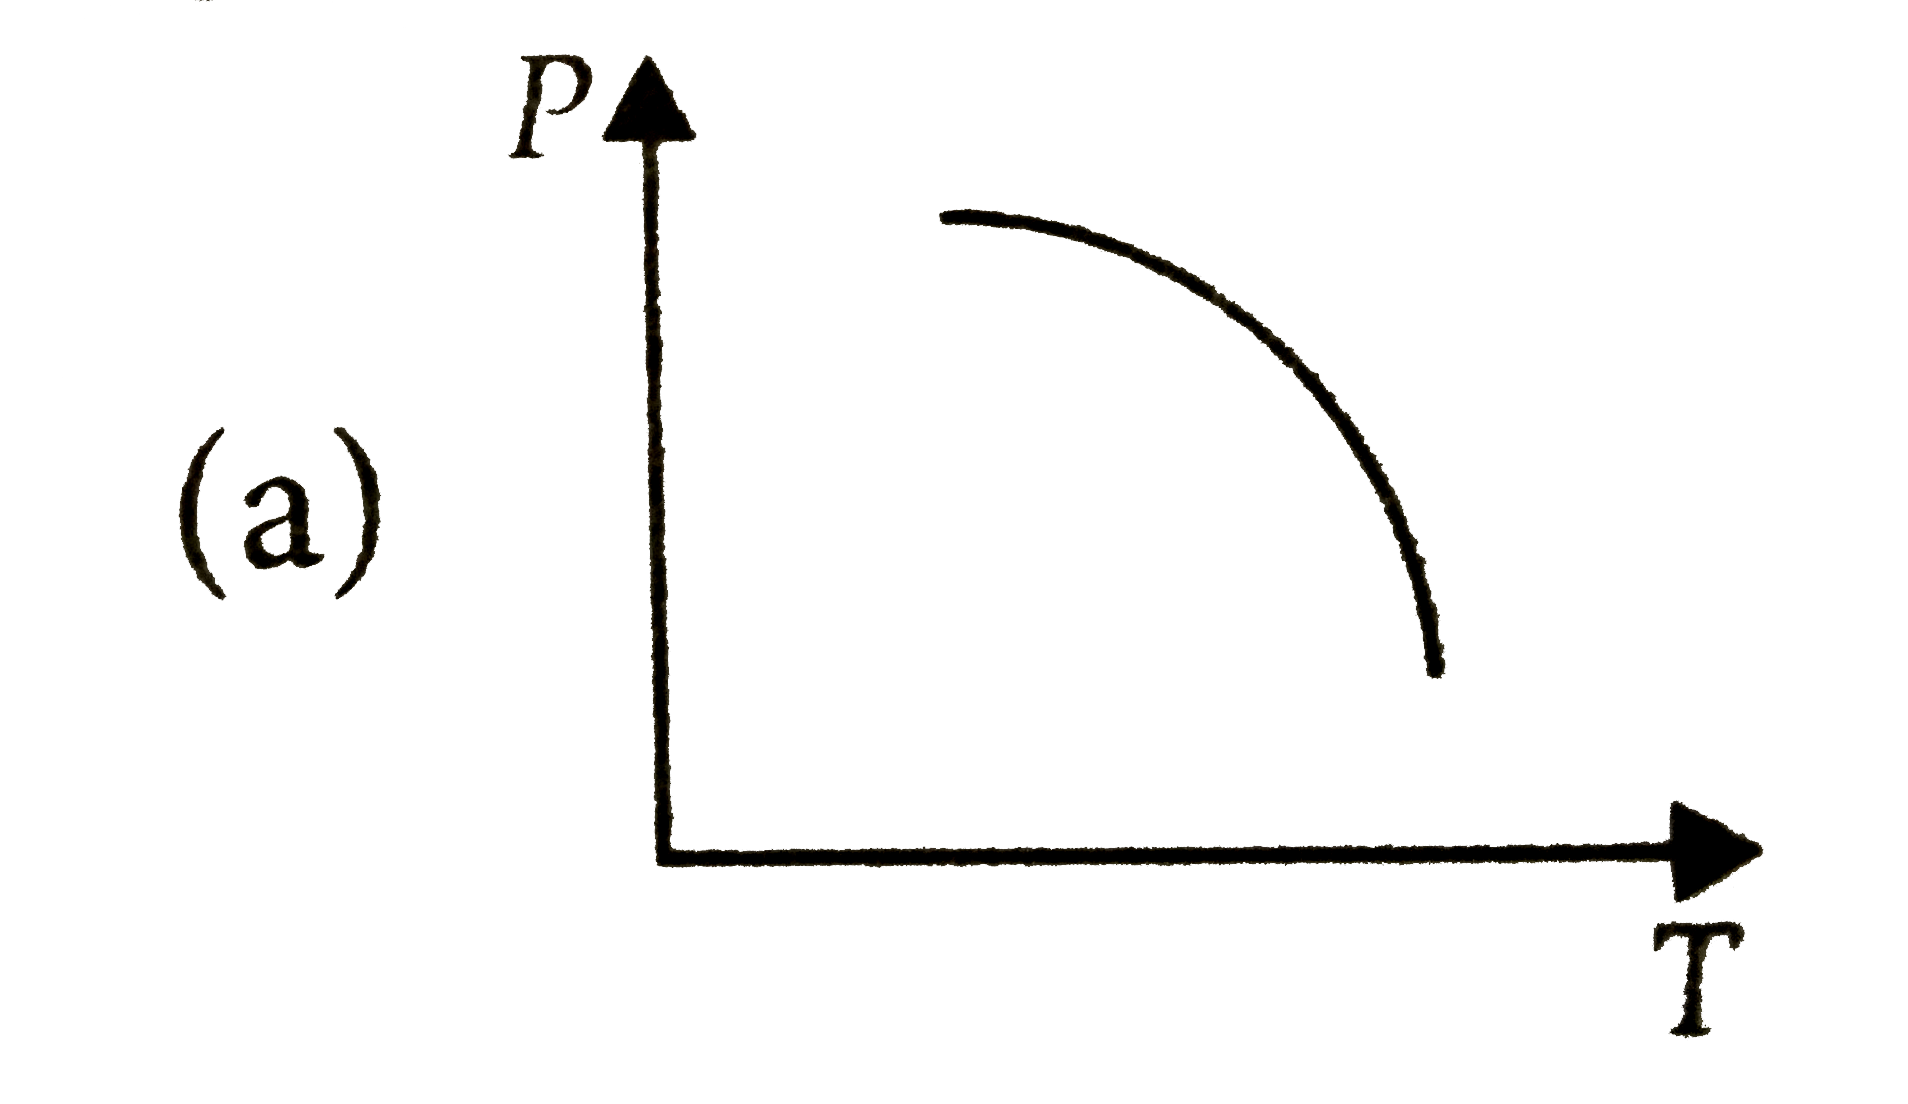 B
B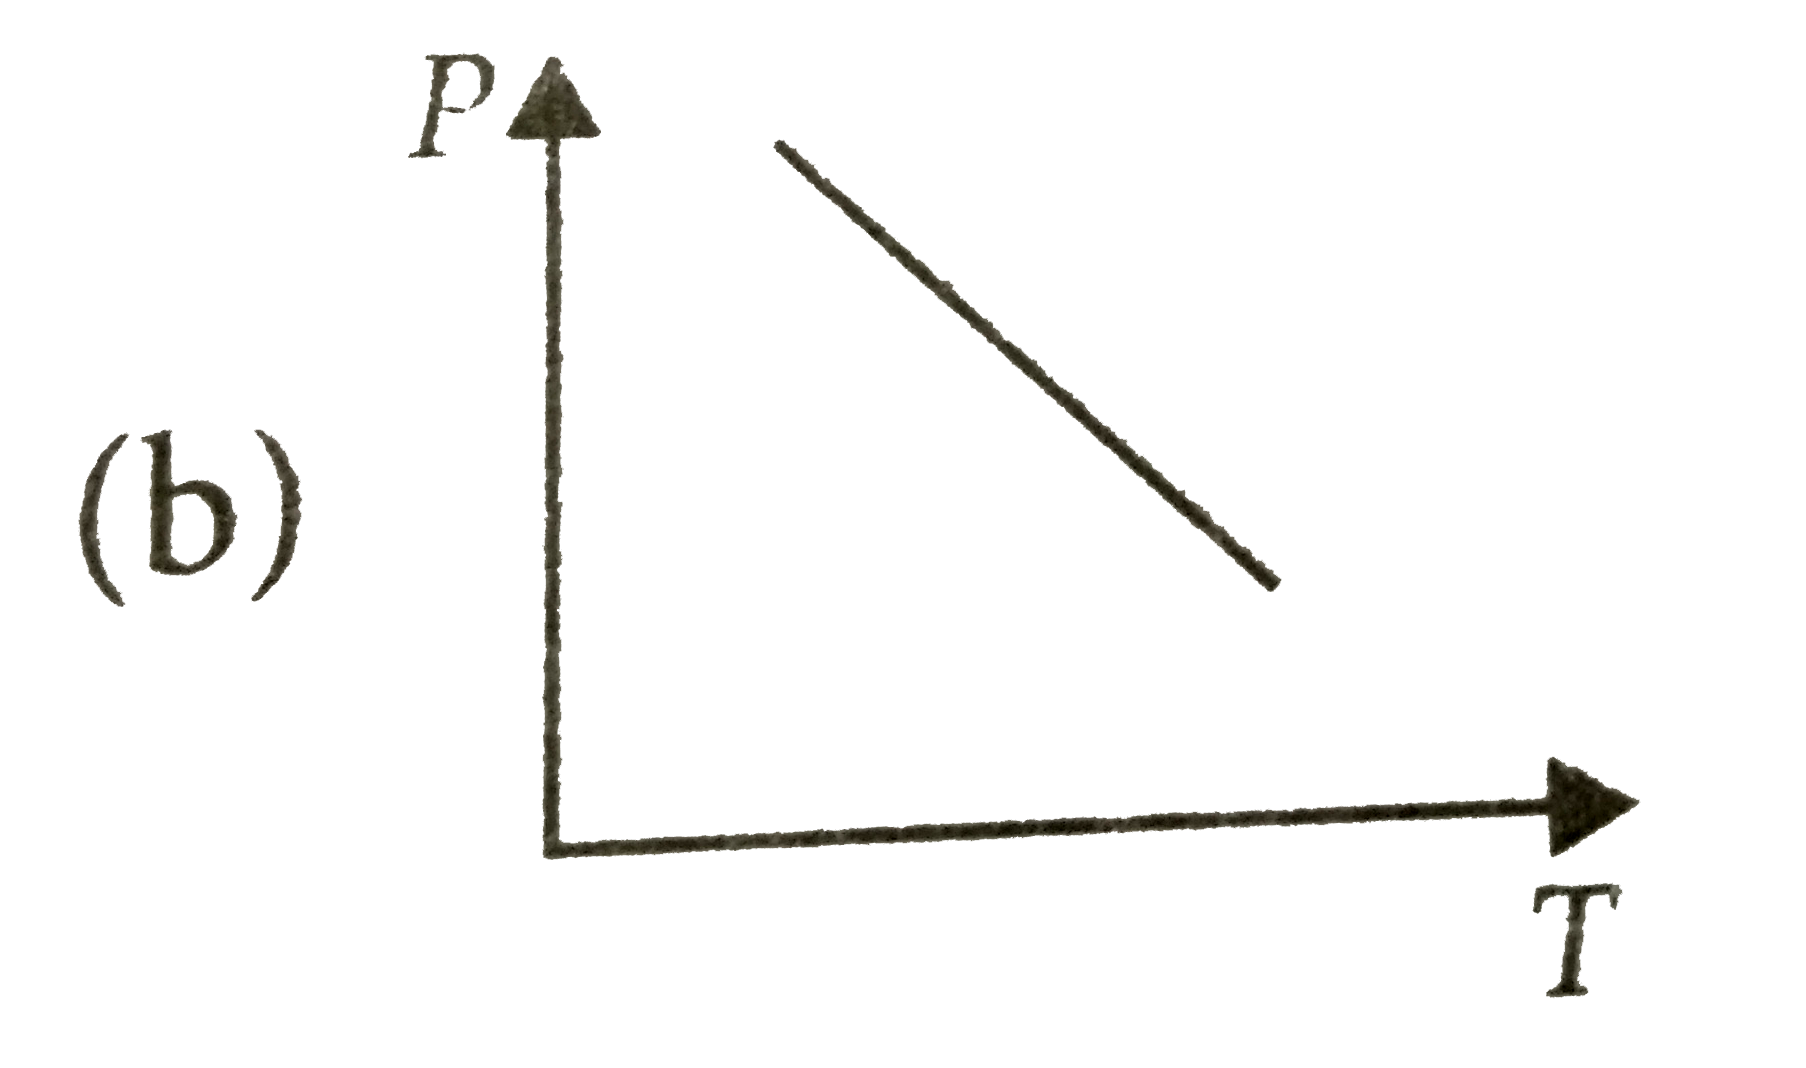 C
C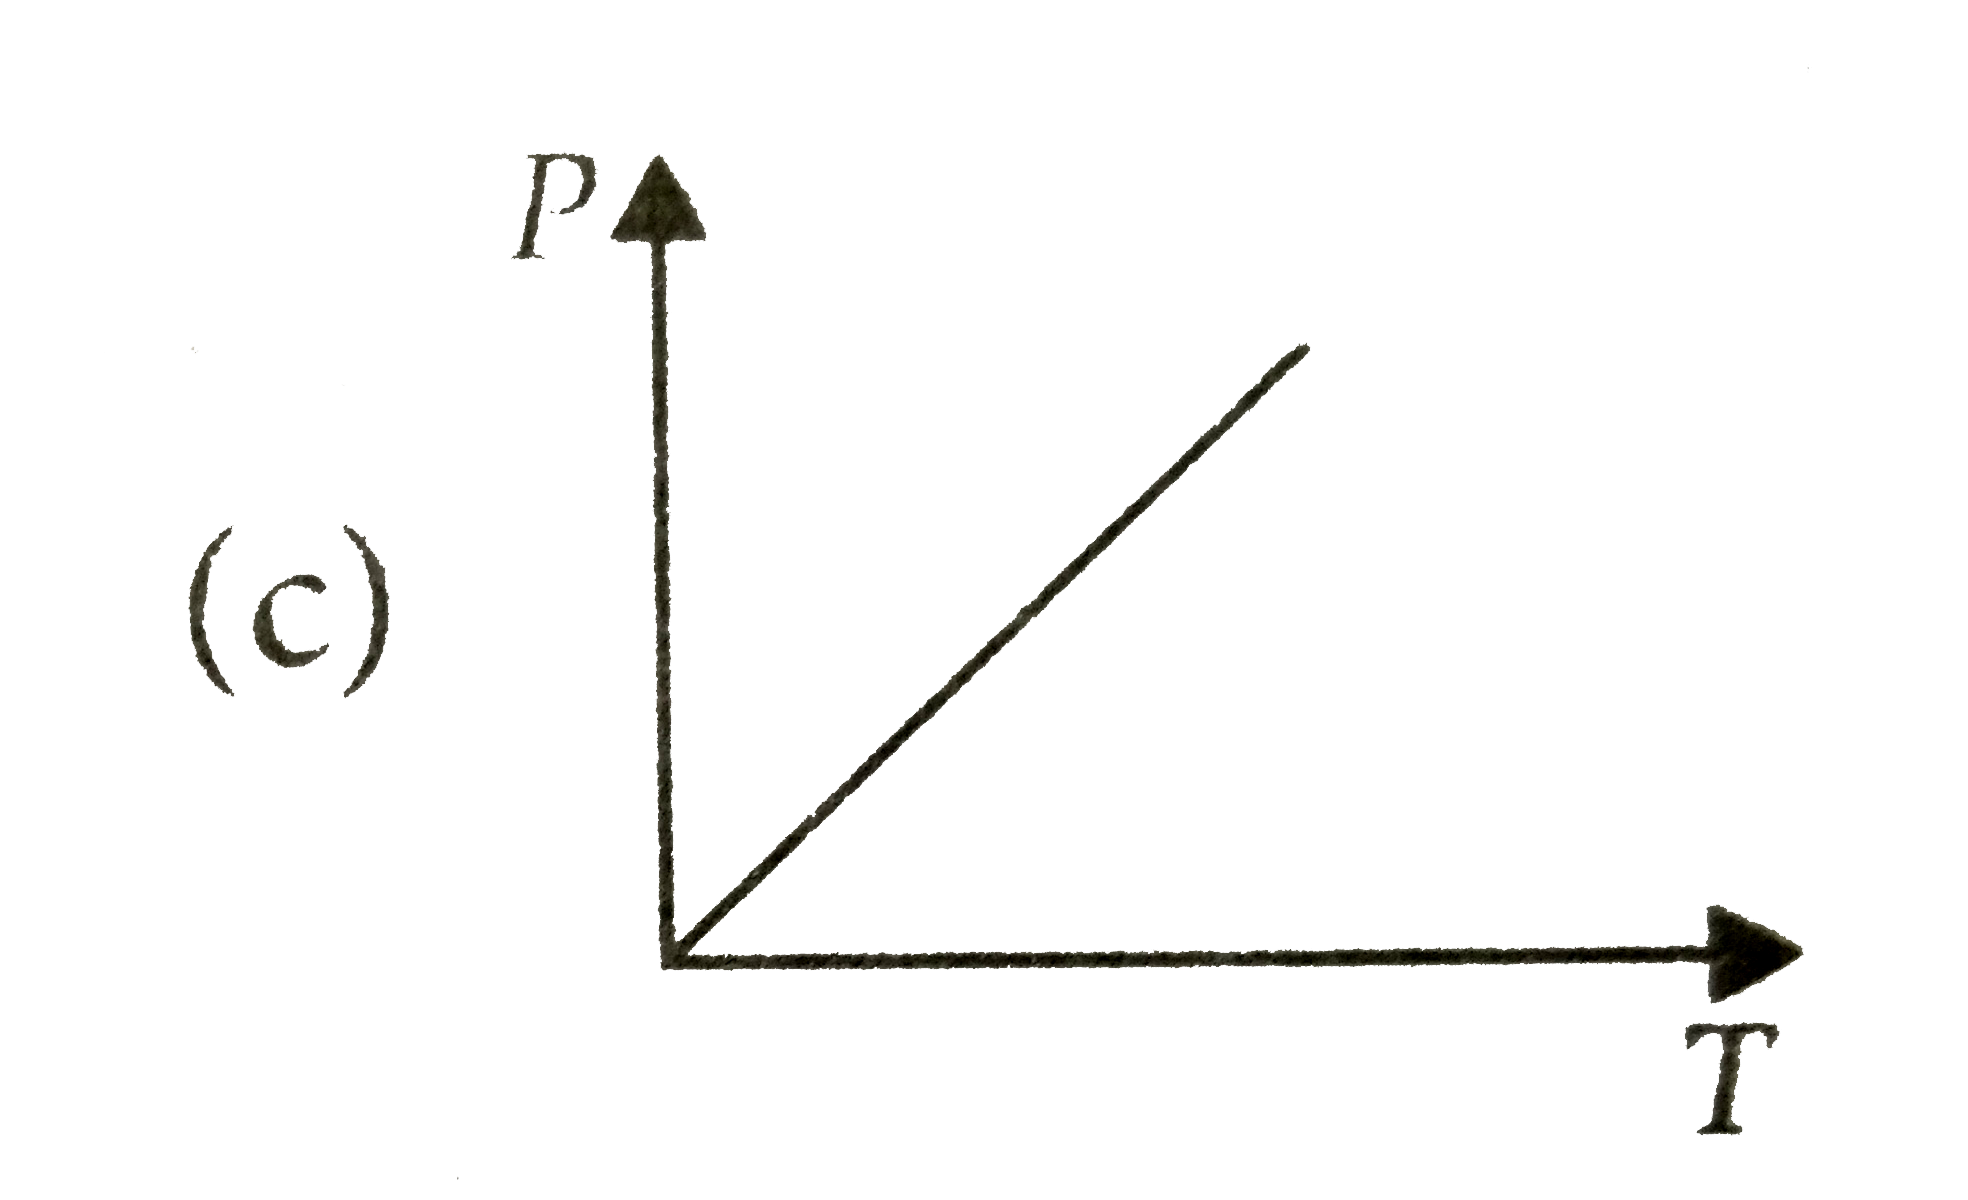 D
D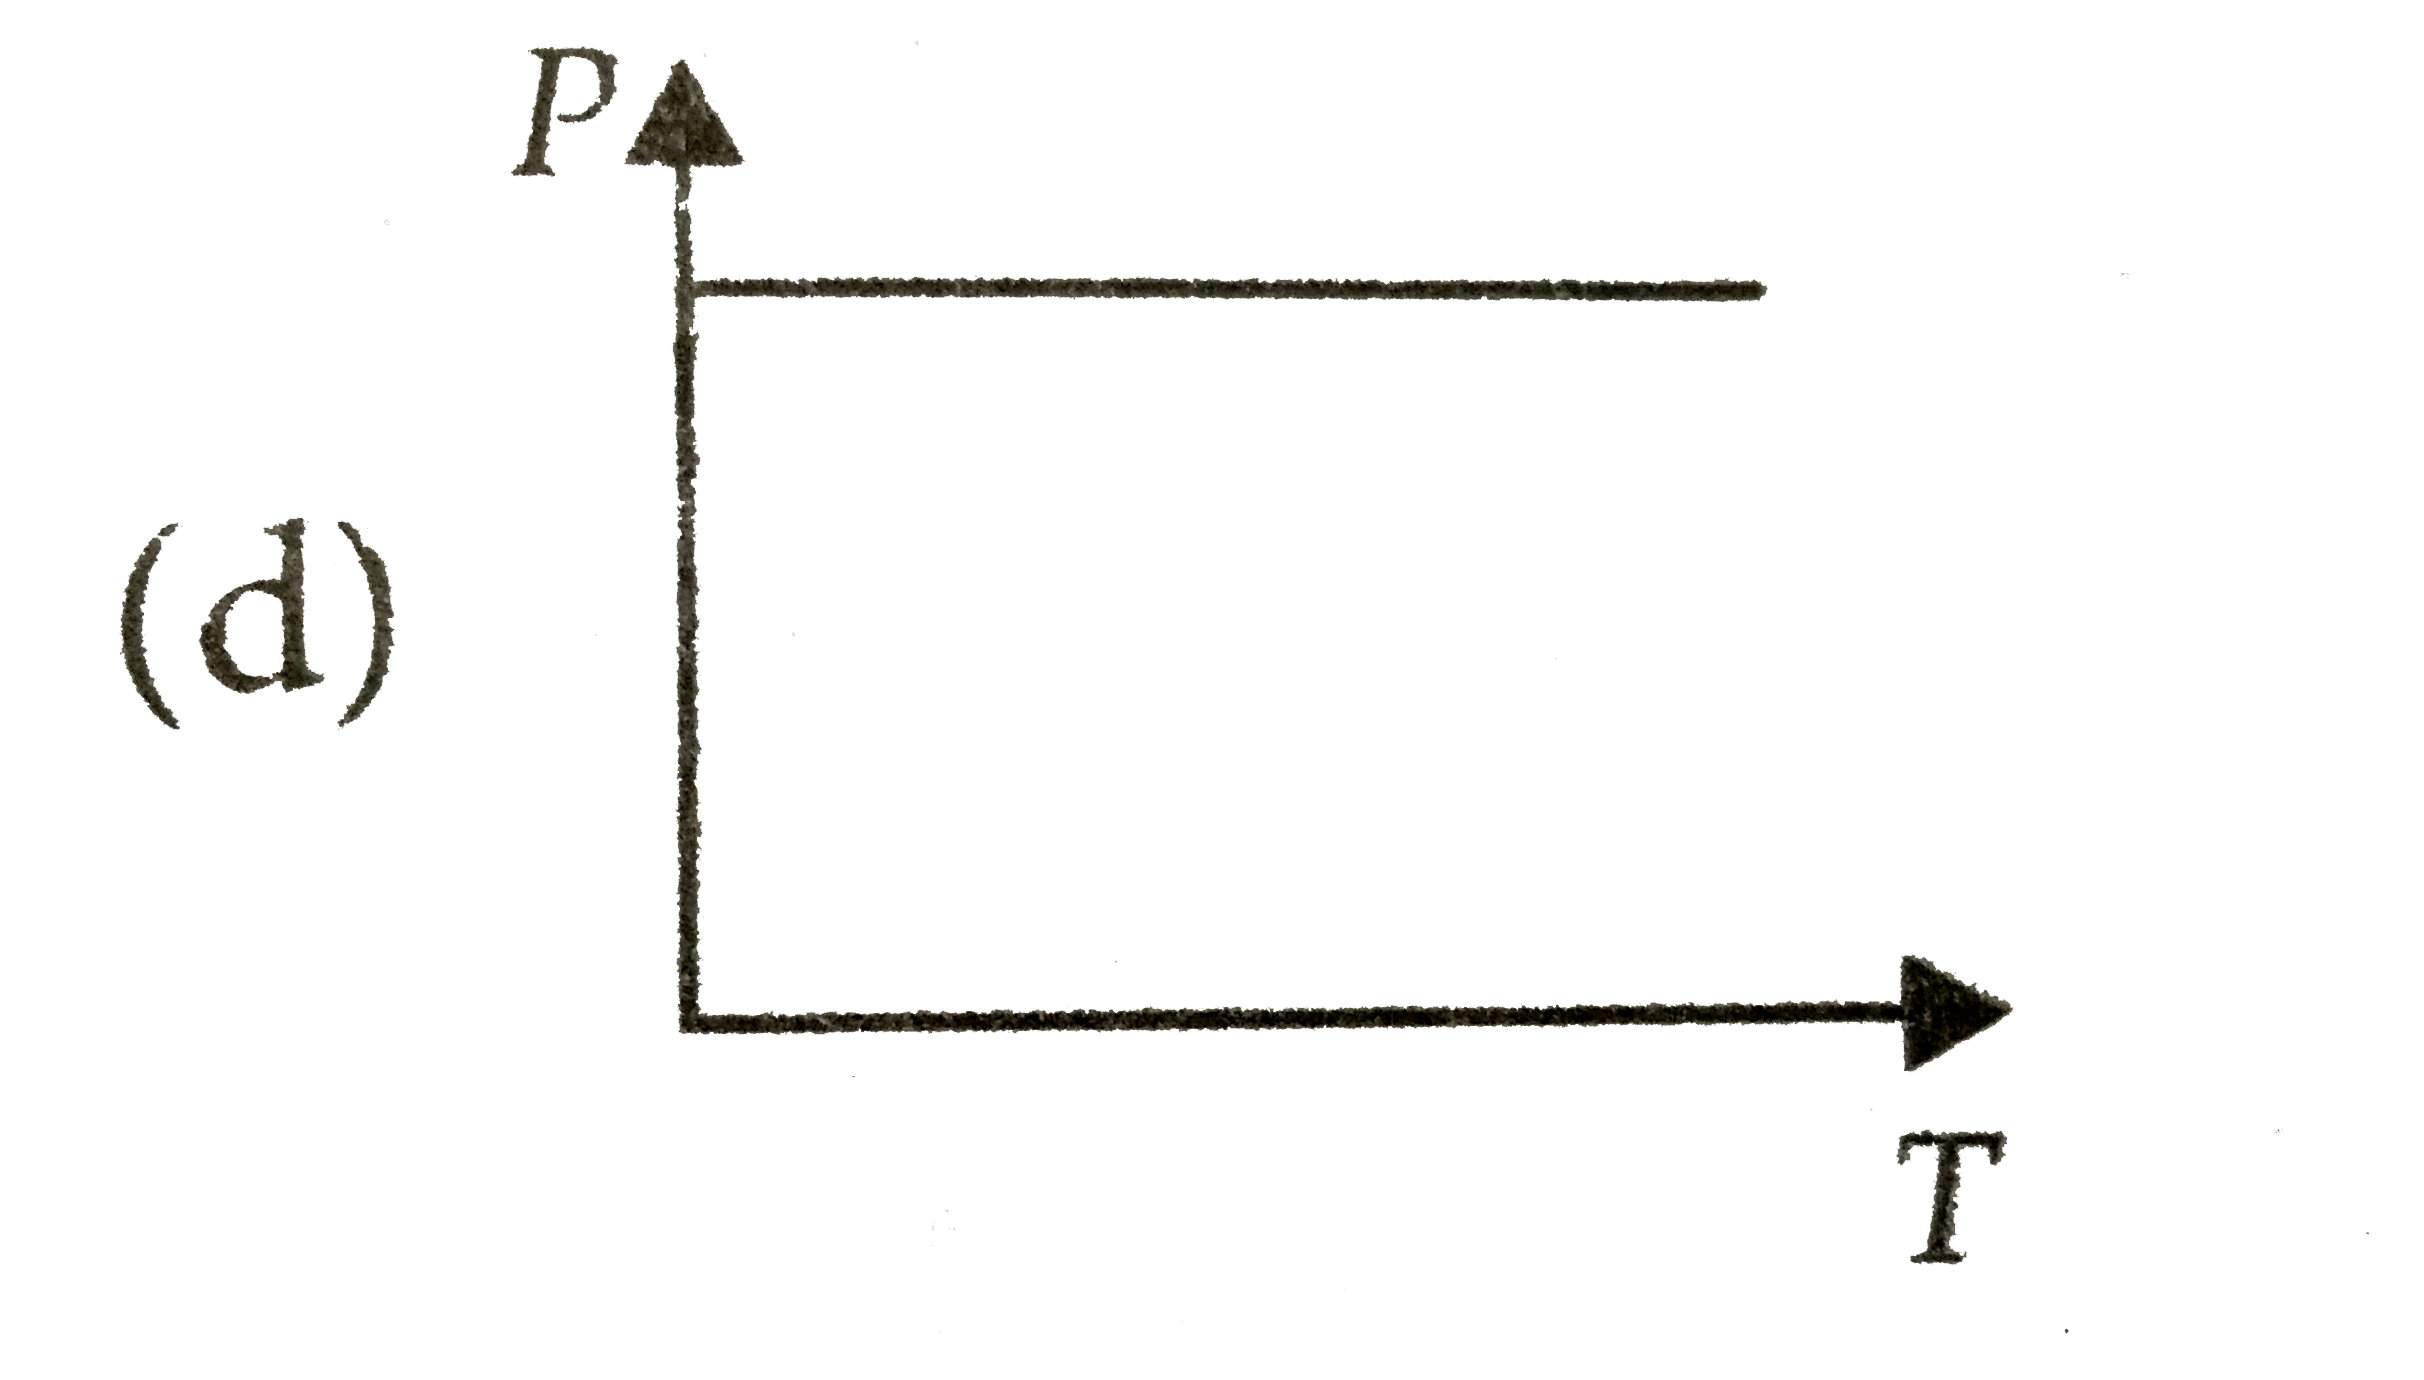
Thermodynamic processes are indicated in the following diagram
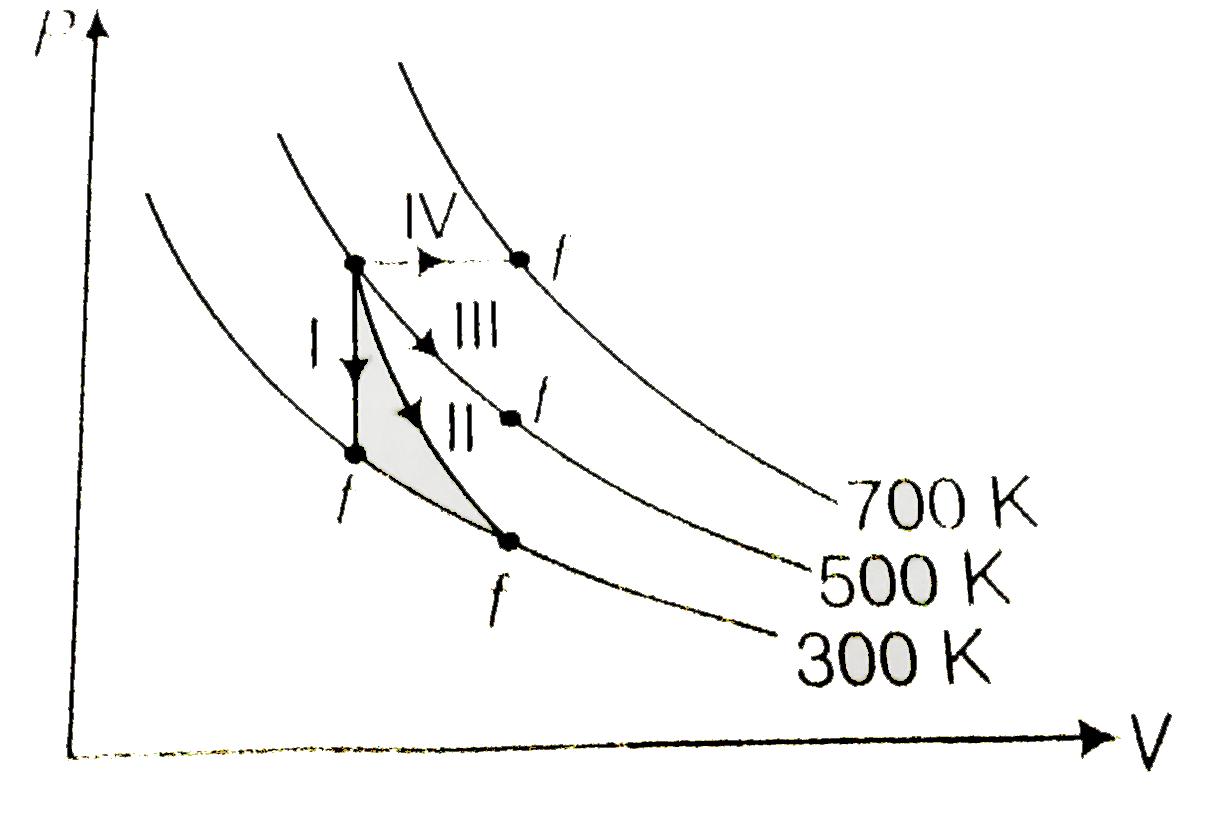
Match the following :

View SolutionA cyclic process ABCD is shown in the P−V diagram. Which of the following curves represents the same process?
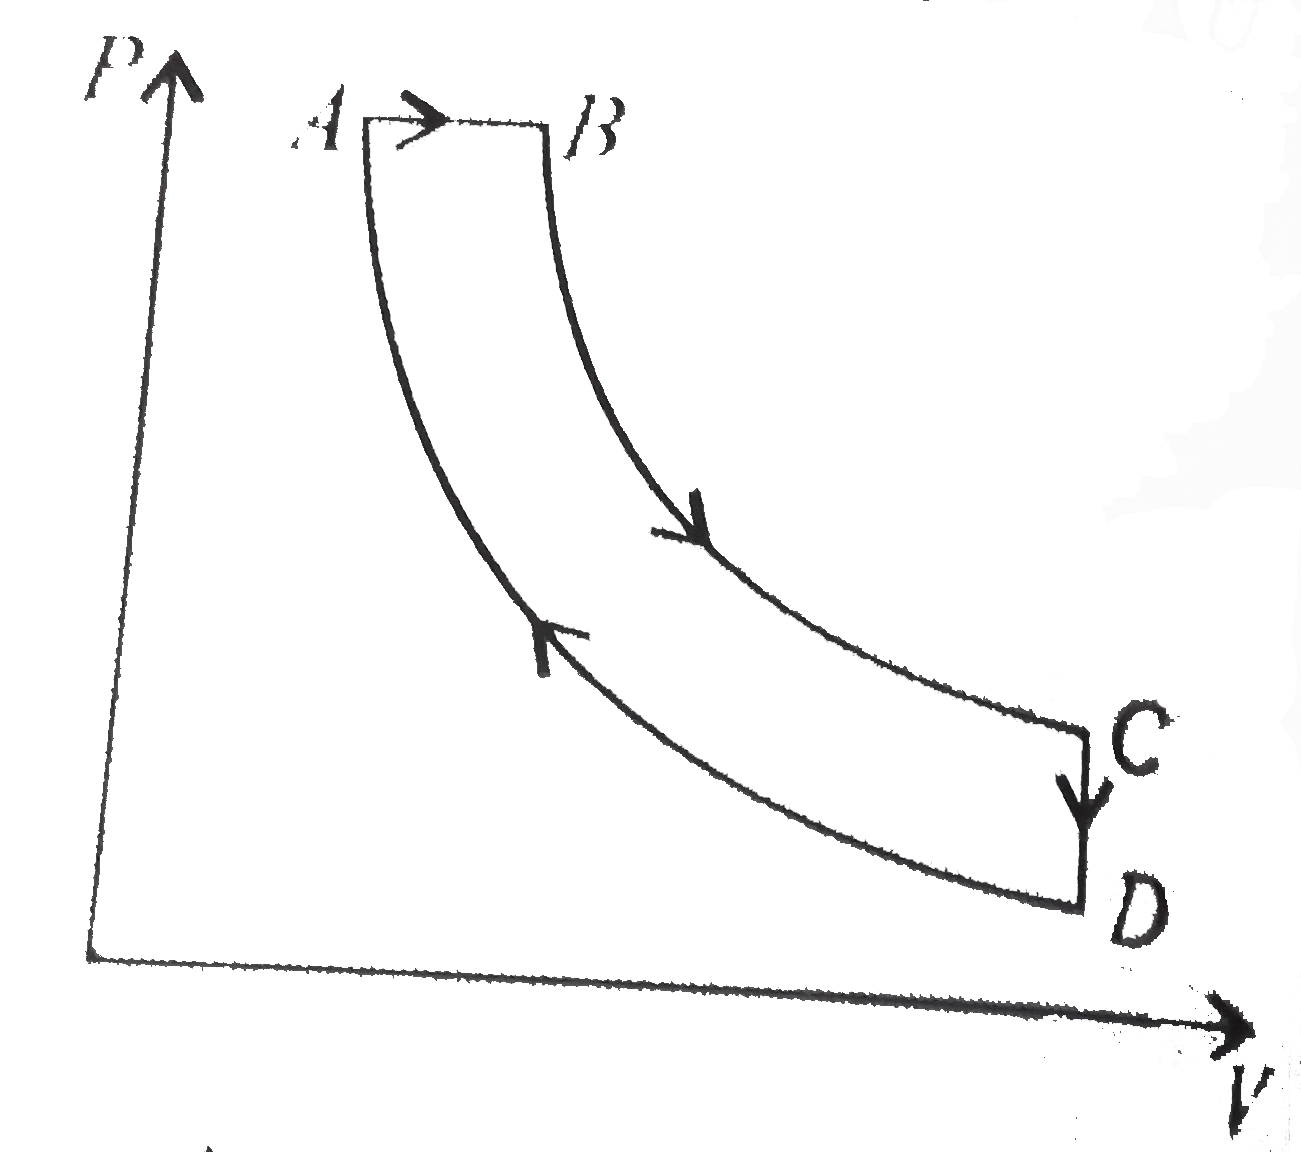
View SolutionA cyclic process ABCD is shown in the P−V diagram. Which of the following curves represents the same process?

View SolutionP−T diagram is shown in Fig. Choose the corresponding V−T diagram.
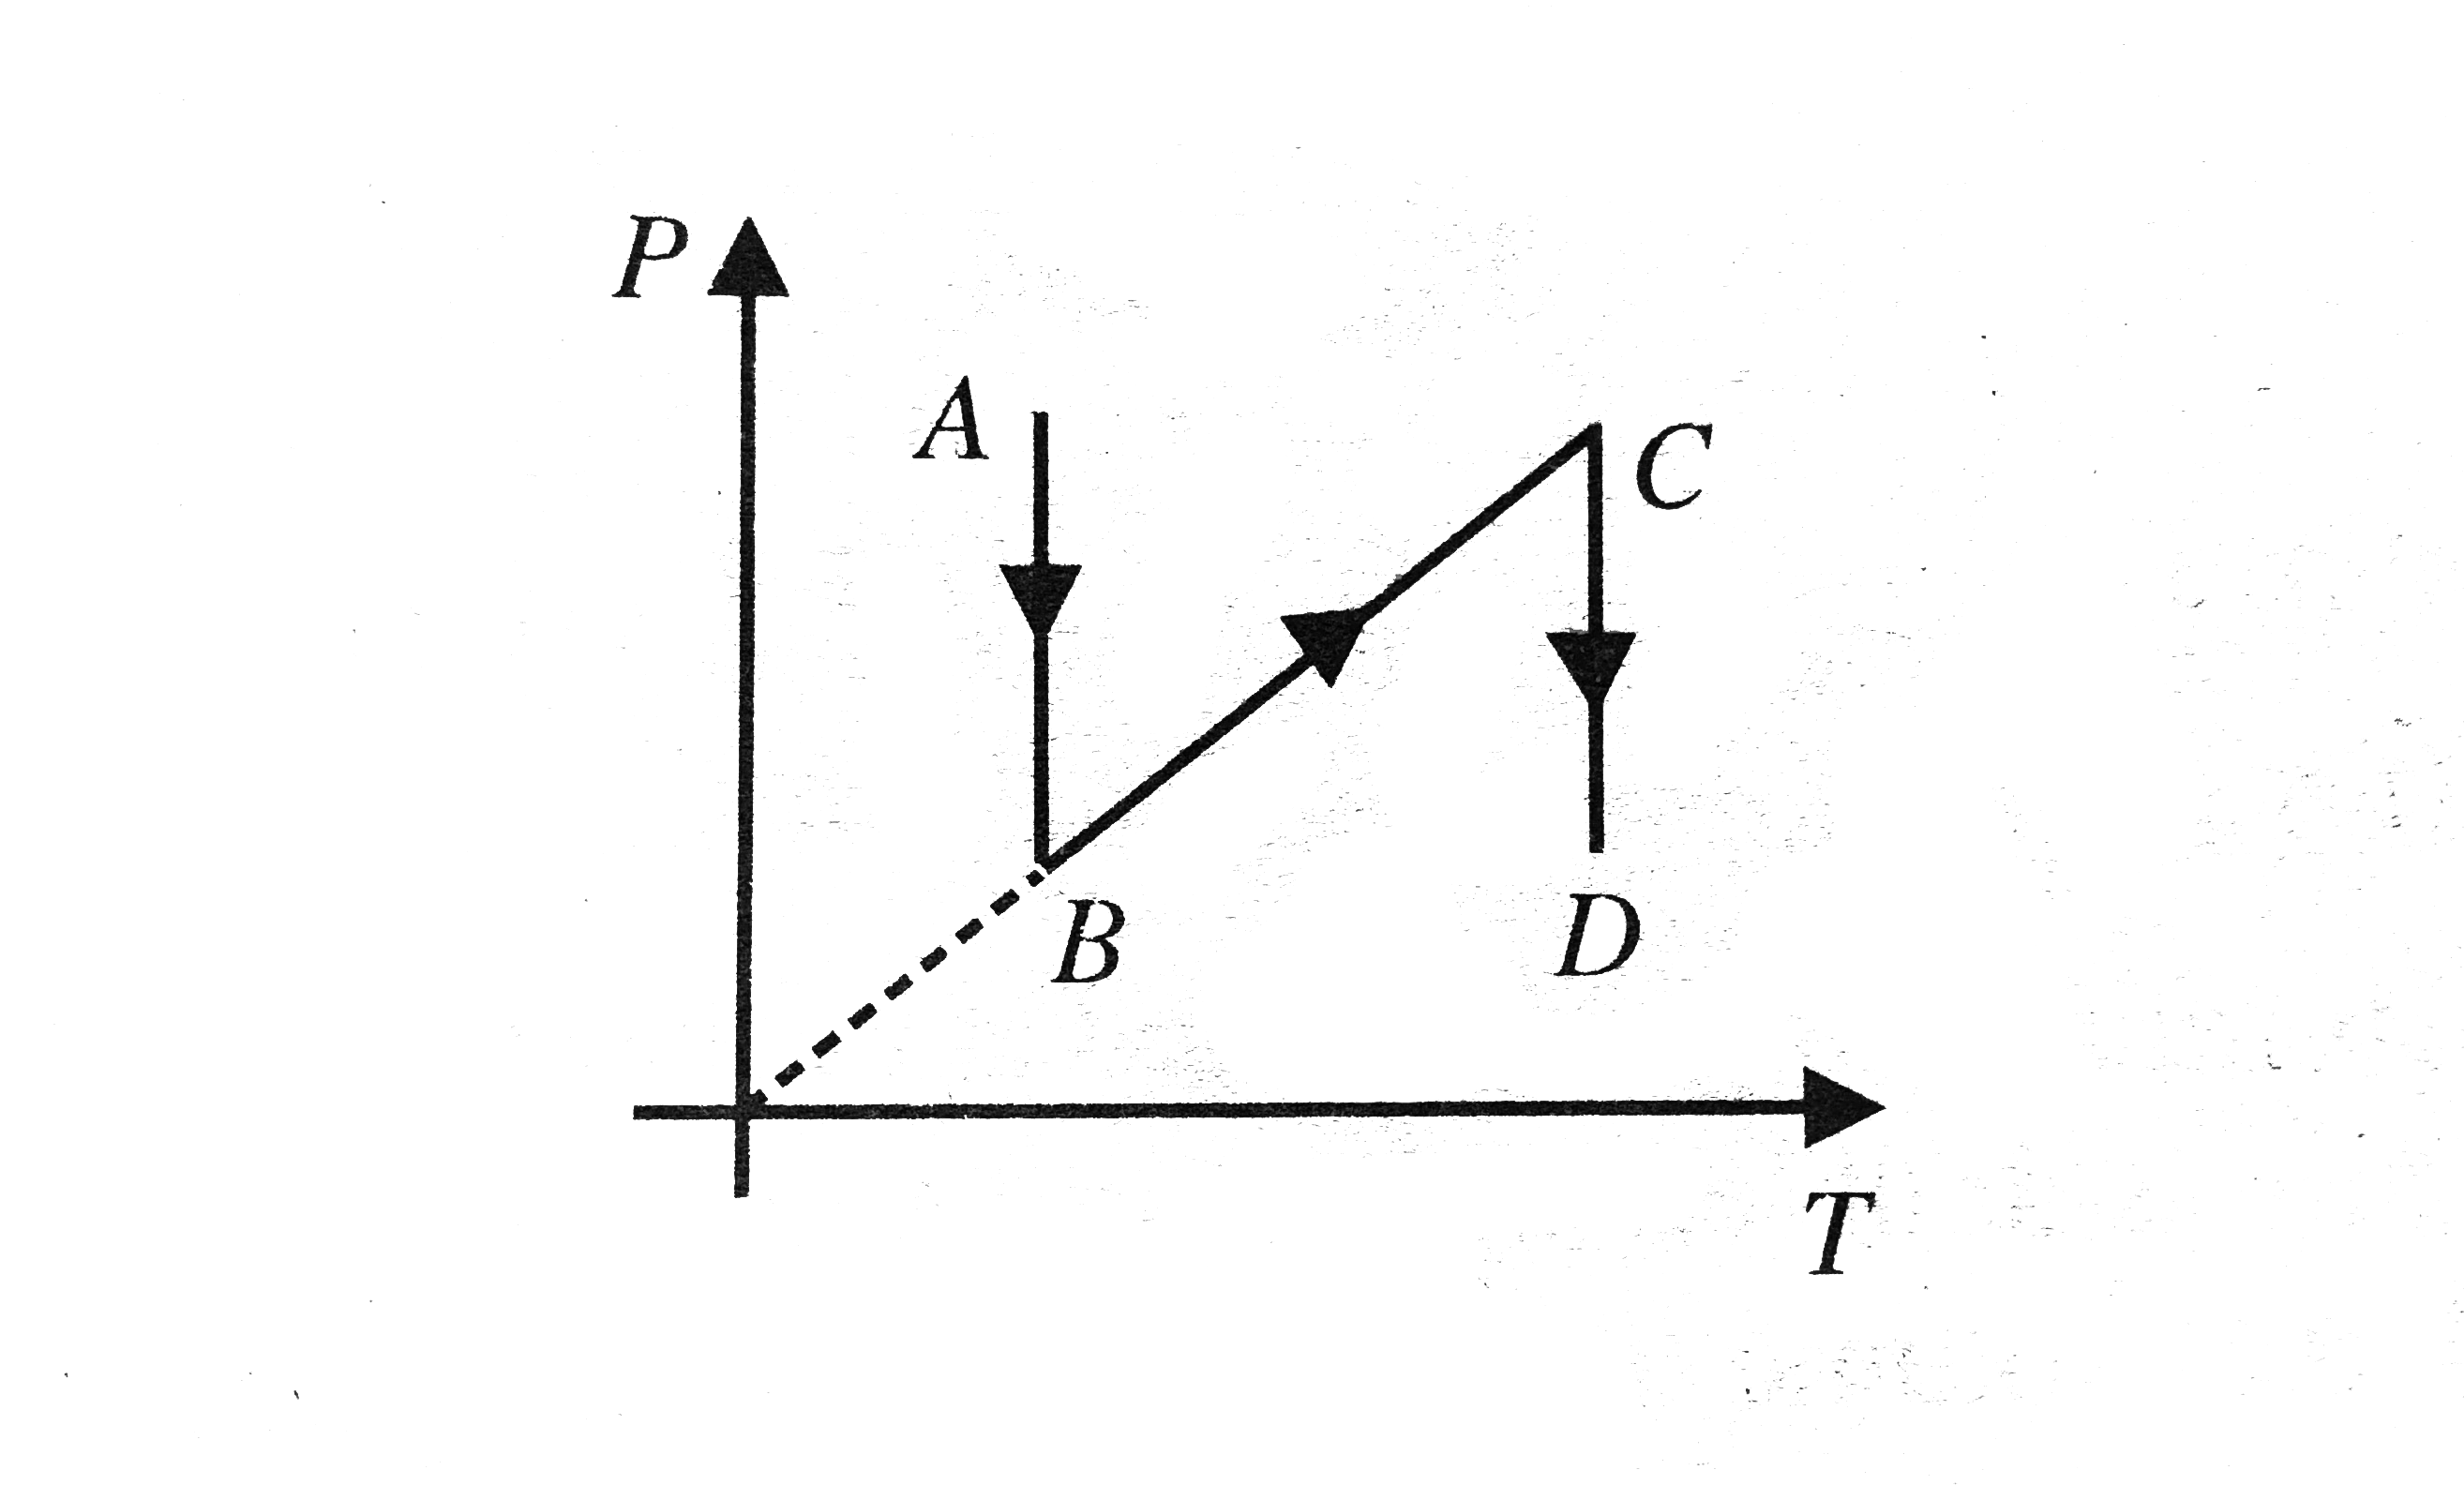
View SolutionP−T diagram is shown in Fig. Choose the corresponding V−T diagram.

View SolutionThe diagram below shows a cell cycle.
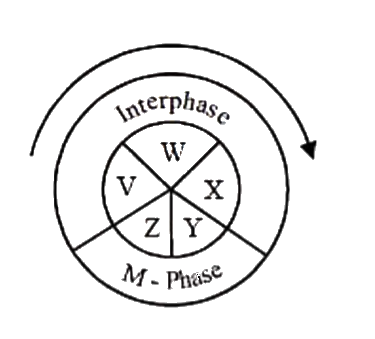
Which of the following process occur during V?
View SolutionA cyclic process ABCD is shown in the V−T diagram. Which of the following curves represent the same process ?
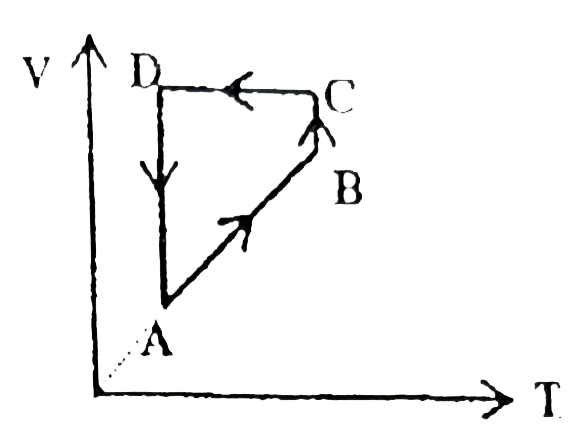
View Solution

