Pressure versus temperature graph of an ideal gas of equal number of an ideal gas of equal number of mole of defferent volumes are platted as shown in figure. Choose the correct alternative.
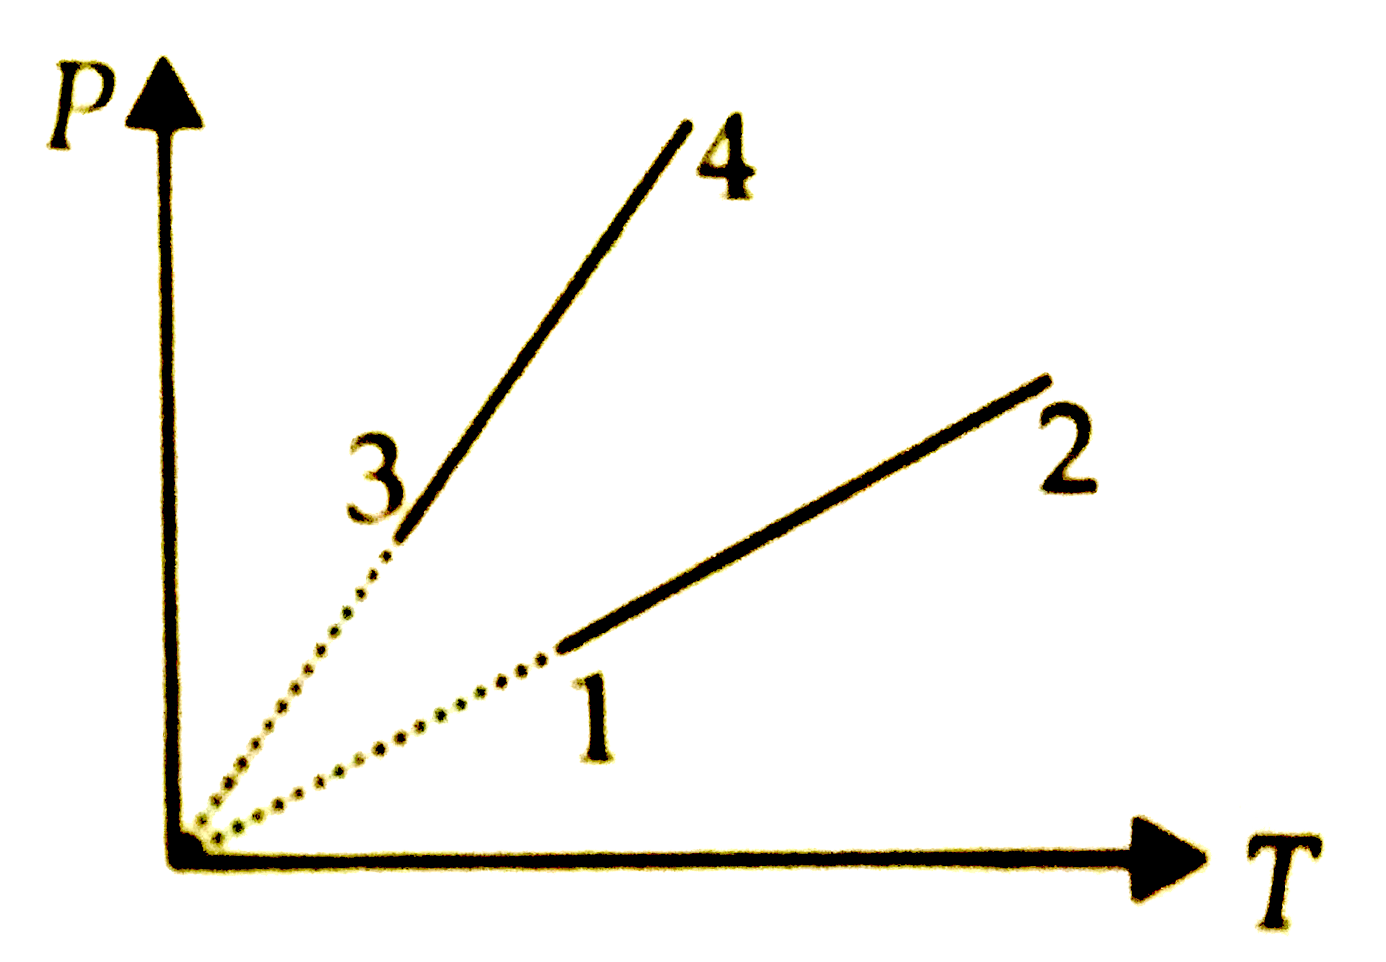
V1=V2,V3=V4 and V2>V3
V1=V2,V3=V4 and V2<V3
V1=V2=V3=V4
V4>V3>V2>V1
The correct Answer is:A
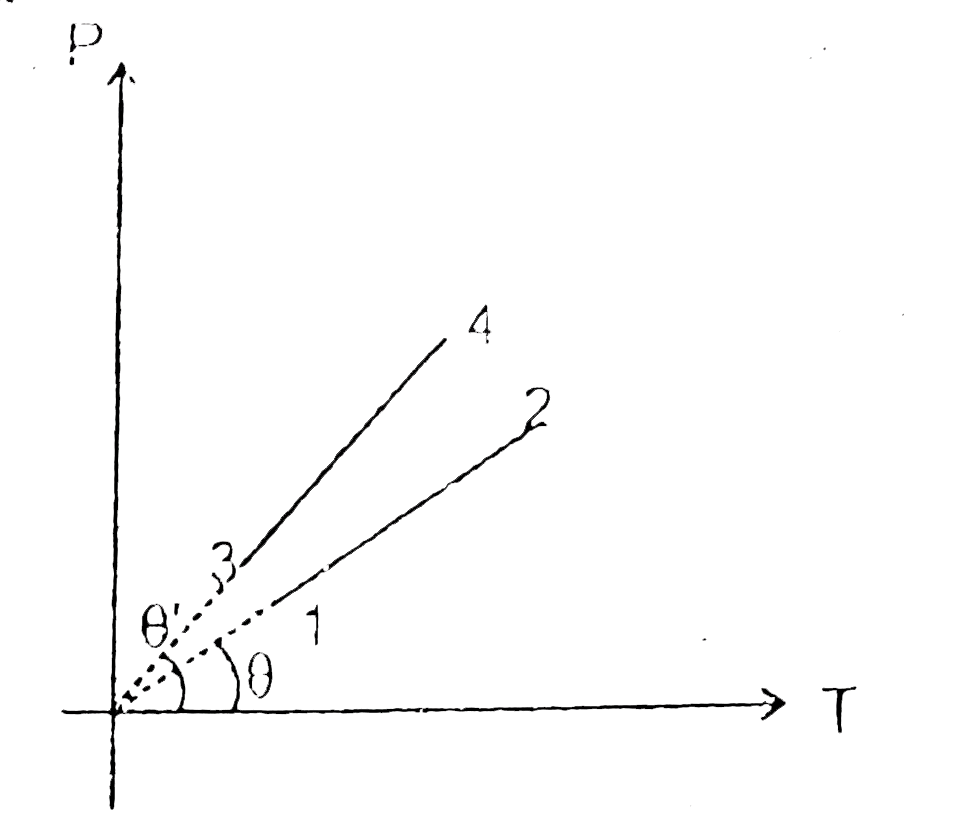
tanθ′>tanθ
nRV3=nRV4>nRV1=nRV2
V1=V2>V3=V4
Similar Questions
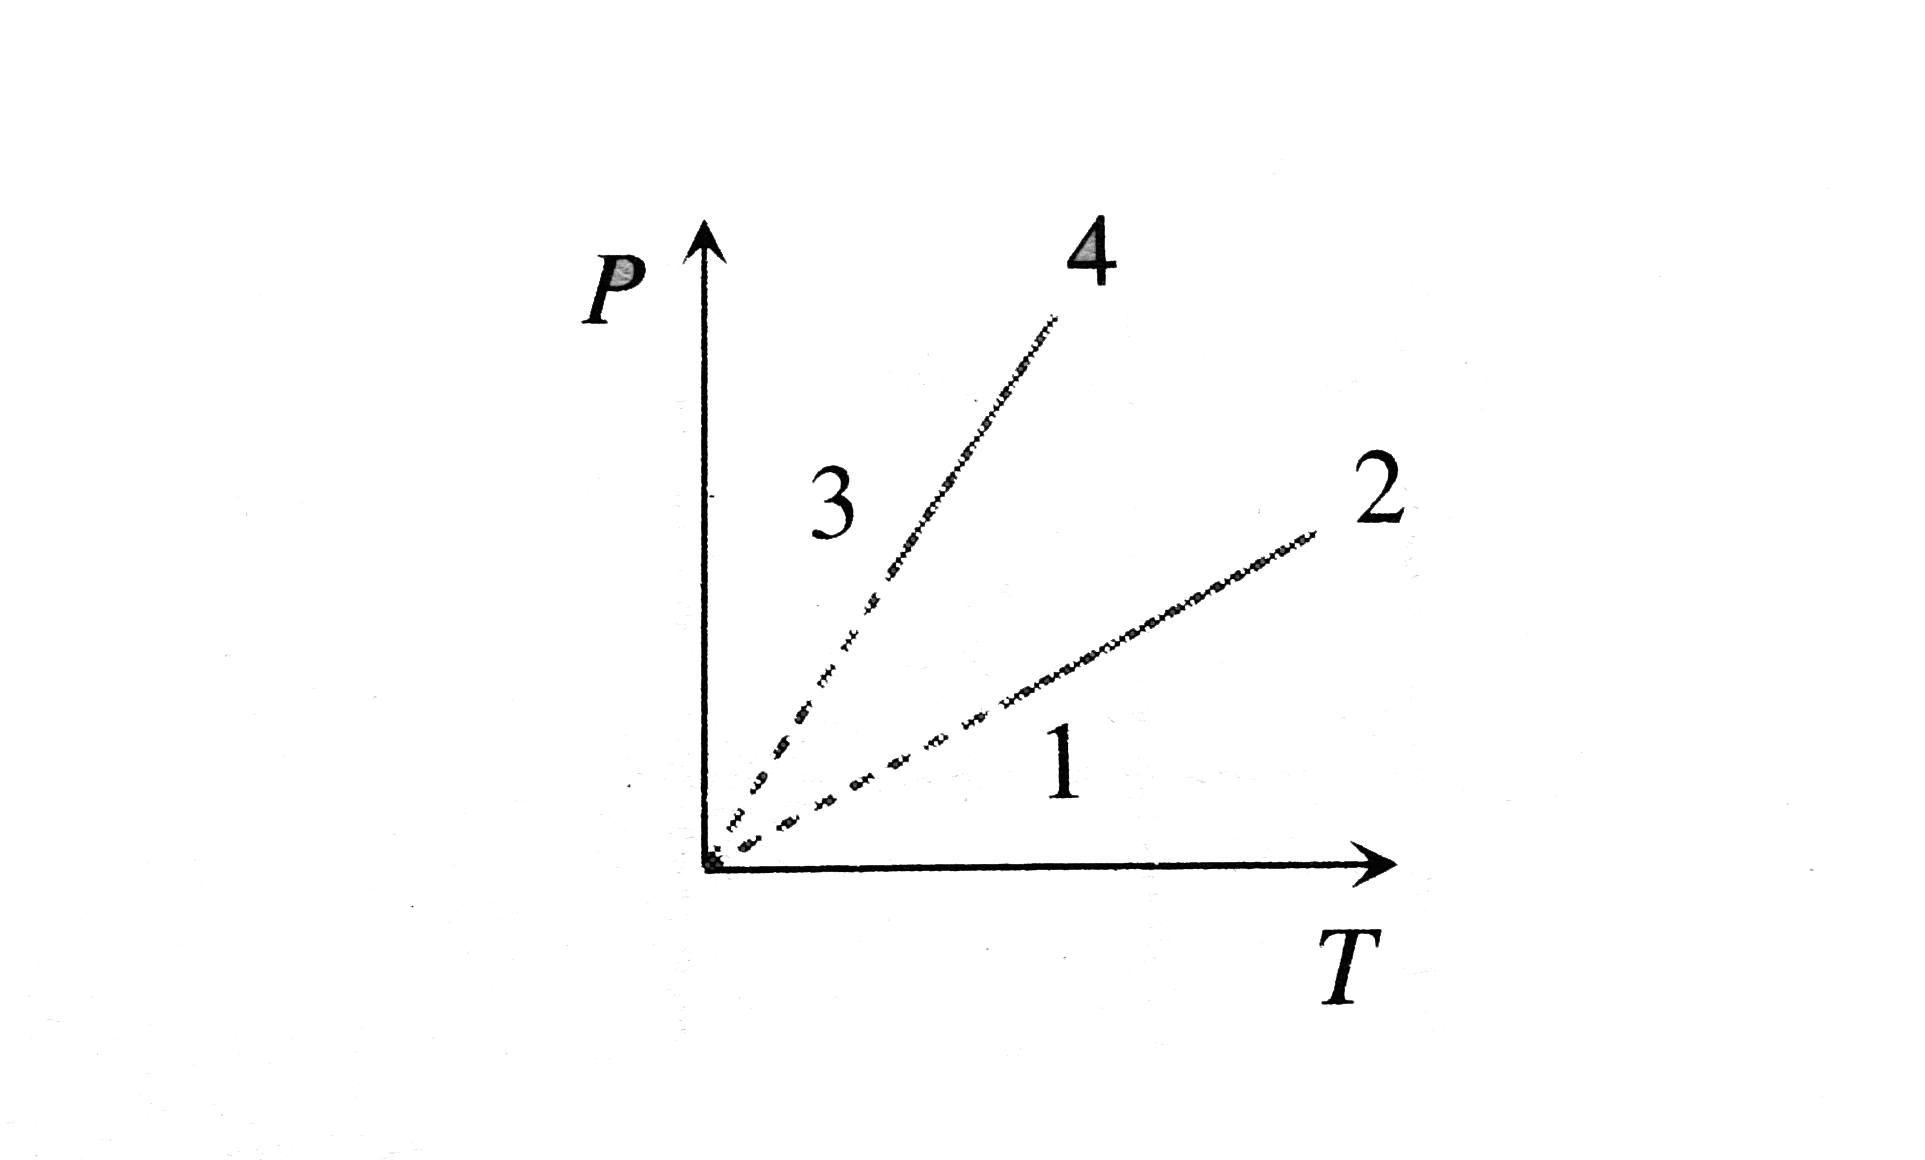
Pressure versus temperature graph of an ideal gas of equal number of moles of different volumes is plotted as shown in Fig. Choose the correct alternative.
View SolutionVolume versus temperature (V-T) graph of an ideal gas of equal number of moles is plotted as shown in the figure. Choose the correct alternative.
View Solution
Knowledge Check
Pressure versus temperature graph of an ideal gas of equal number of moles of different volumes is plotted as shown in Fig. Choose the correct alternative.
 AV1=V2=V3=V4BV4>V3>V2>V1CV1=V2,V3=V4andV2>V3DV1=V2,V3=V4andV2<V3
Pressure versus density graph of an ideal gas is shown in figure
View SolutionPressure versus temperature graphs of an ideal gas are as shown in figure. Choose the wrong statement
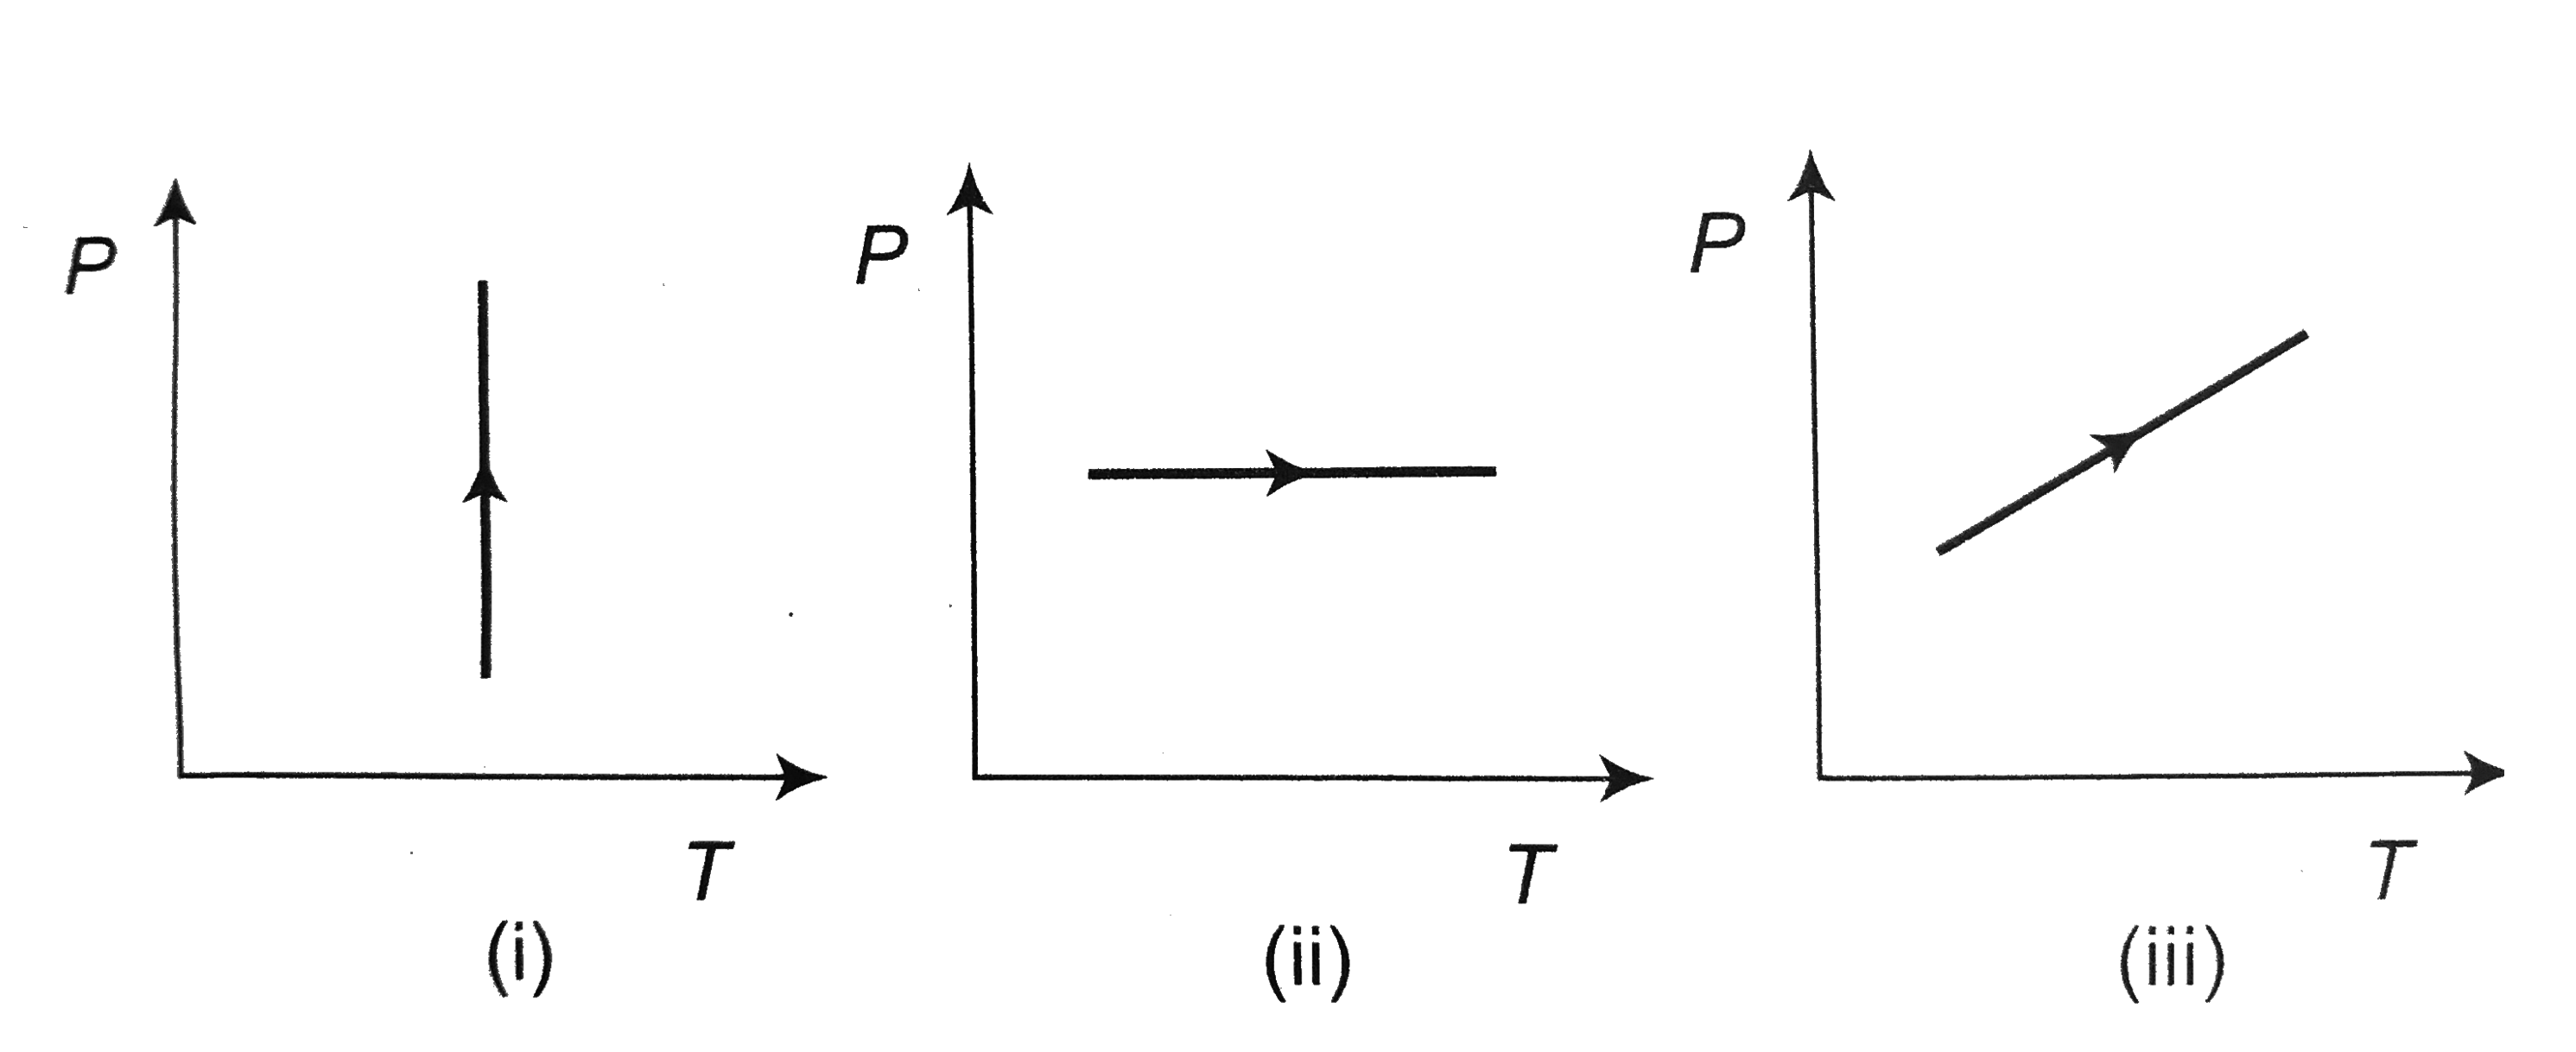
View SolutionPressure versus temperature graphs of an ideal gas are as shown in figure. Choose the wrong statement

View SolutionIf pressure and temperature of an ideal gas are doubled and volume is halved, the number of molecules of the gas
View SolutionPressure versus temperature graph of an ideal gas as shown in Fig.
Corresponding density (ρ) versus volume (V) graph will be
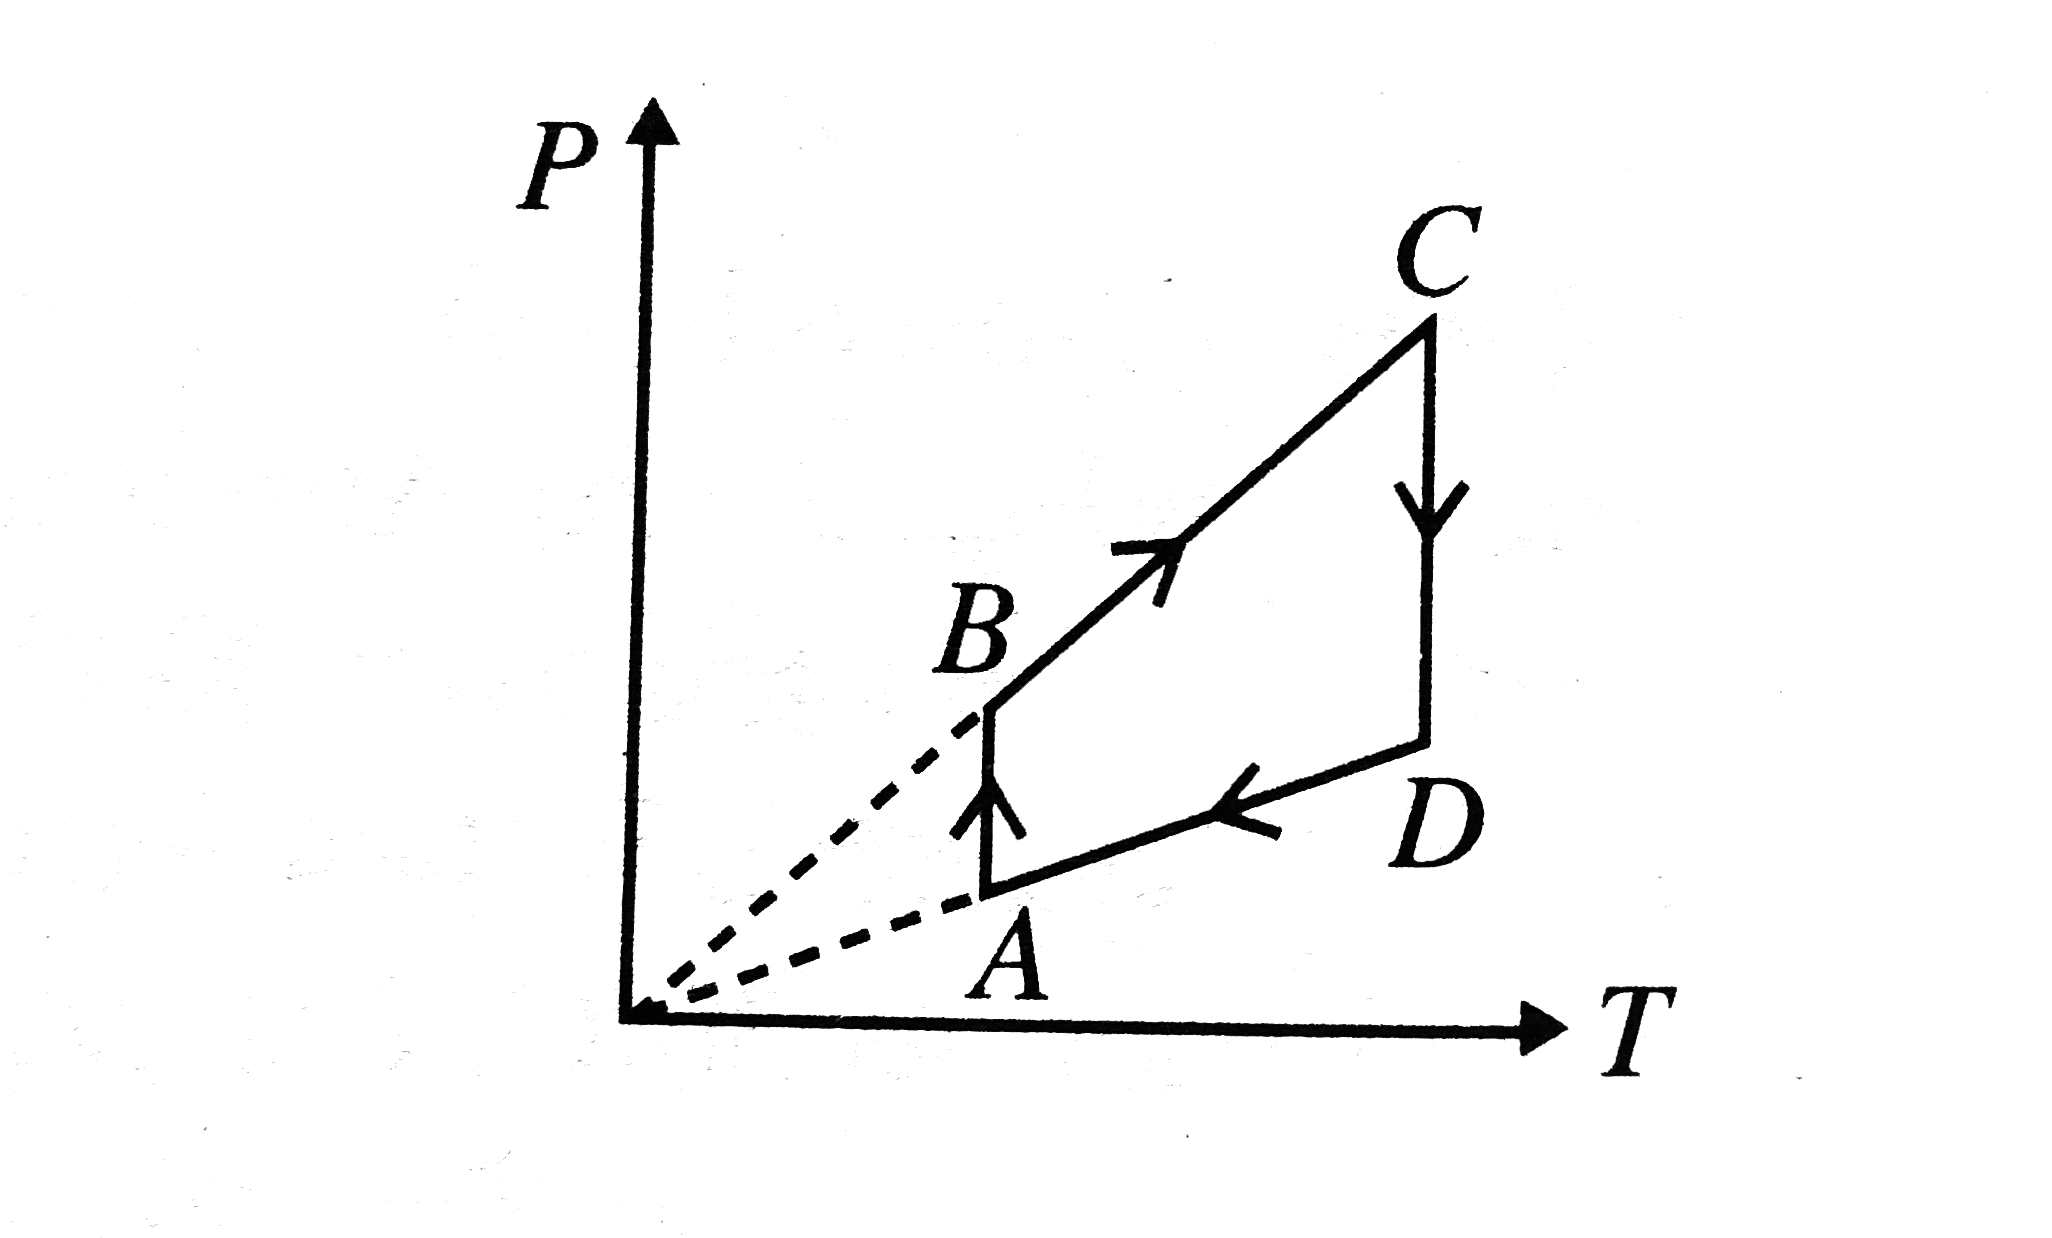
View SolutionPressure versus temperature graph of an ideal gas as shown in Fig.
Corresponding density (ρ) versus volume (V) graph will be

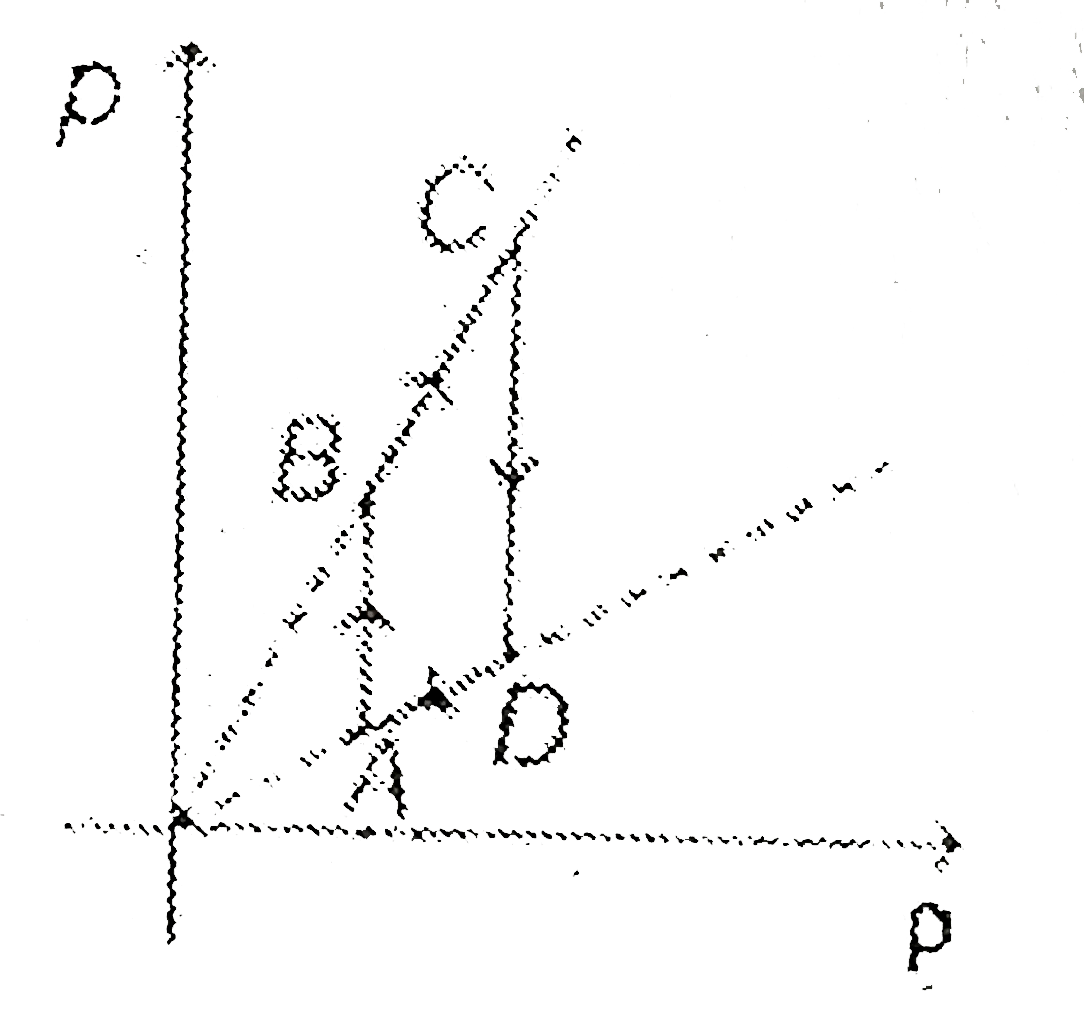
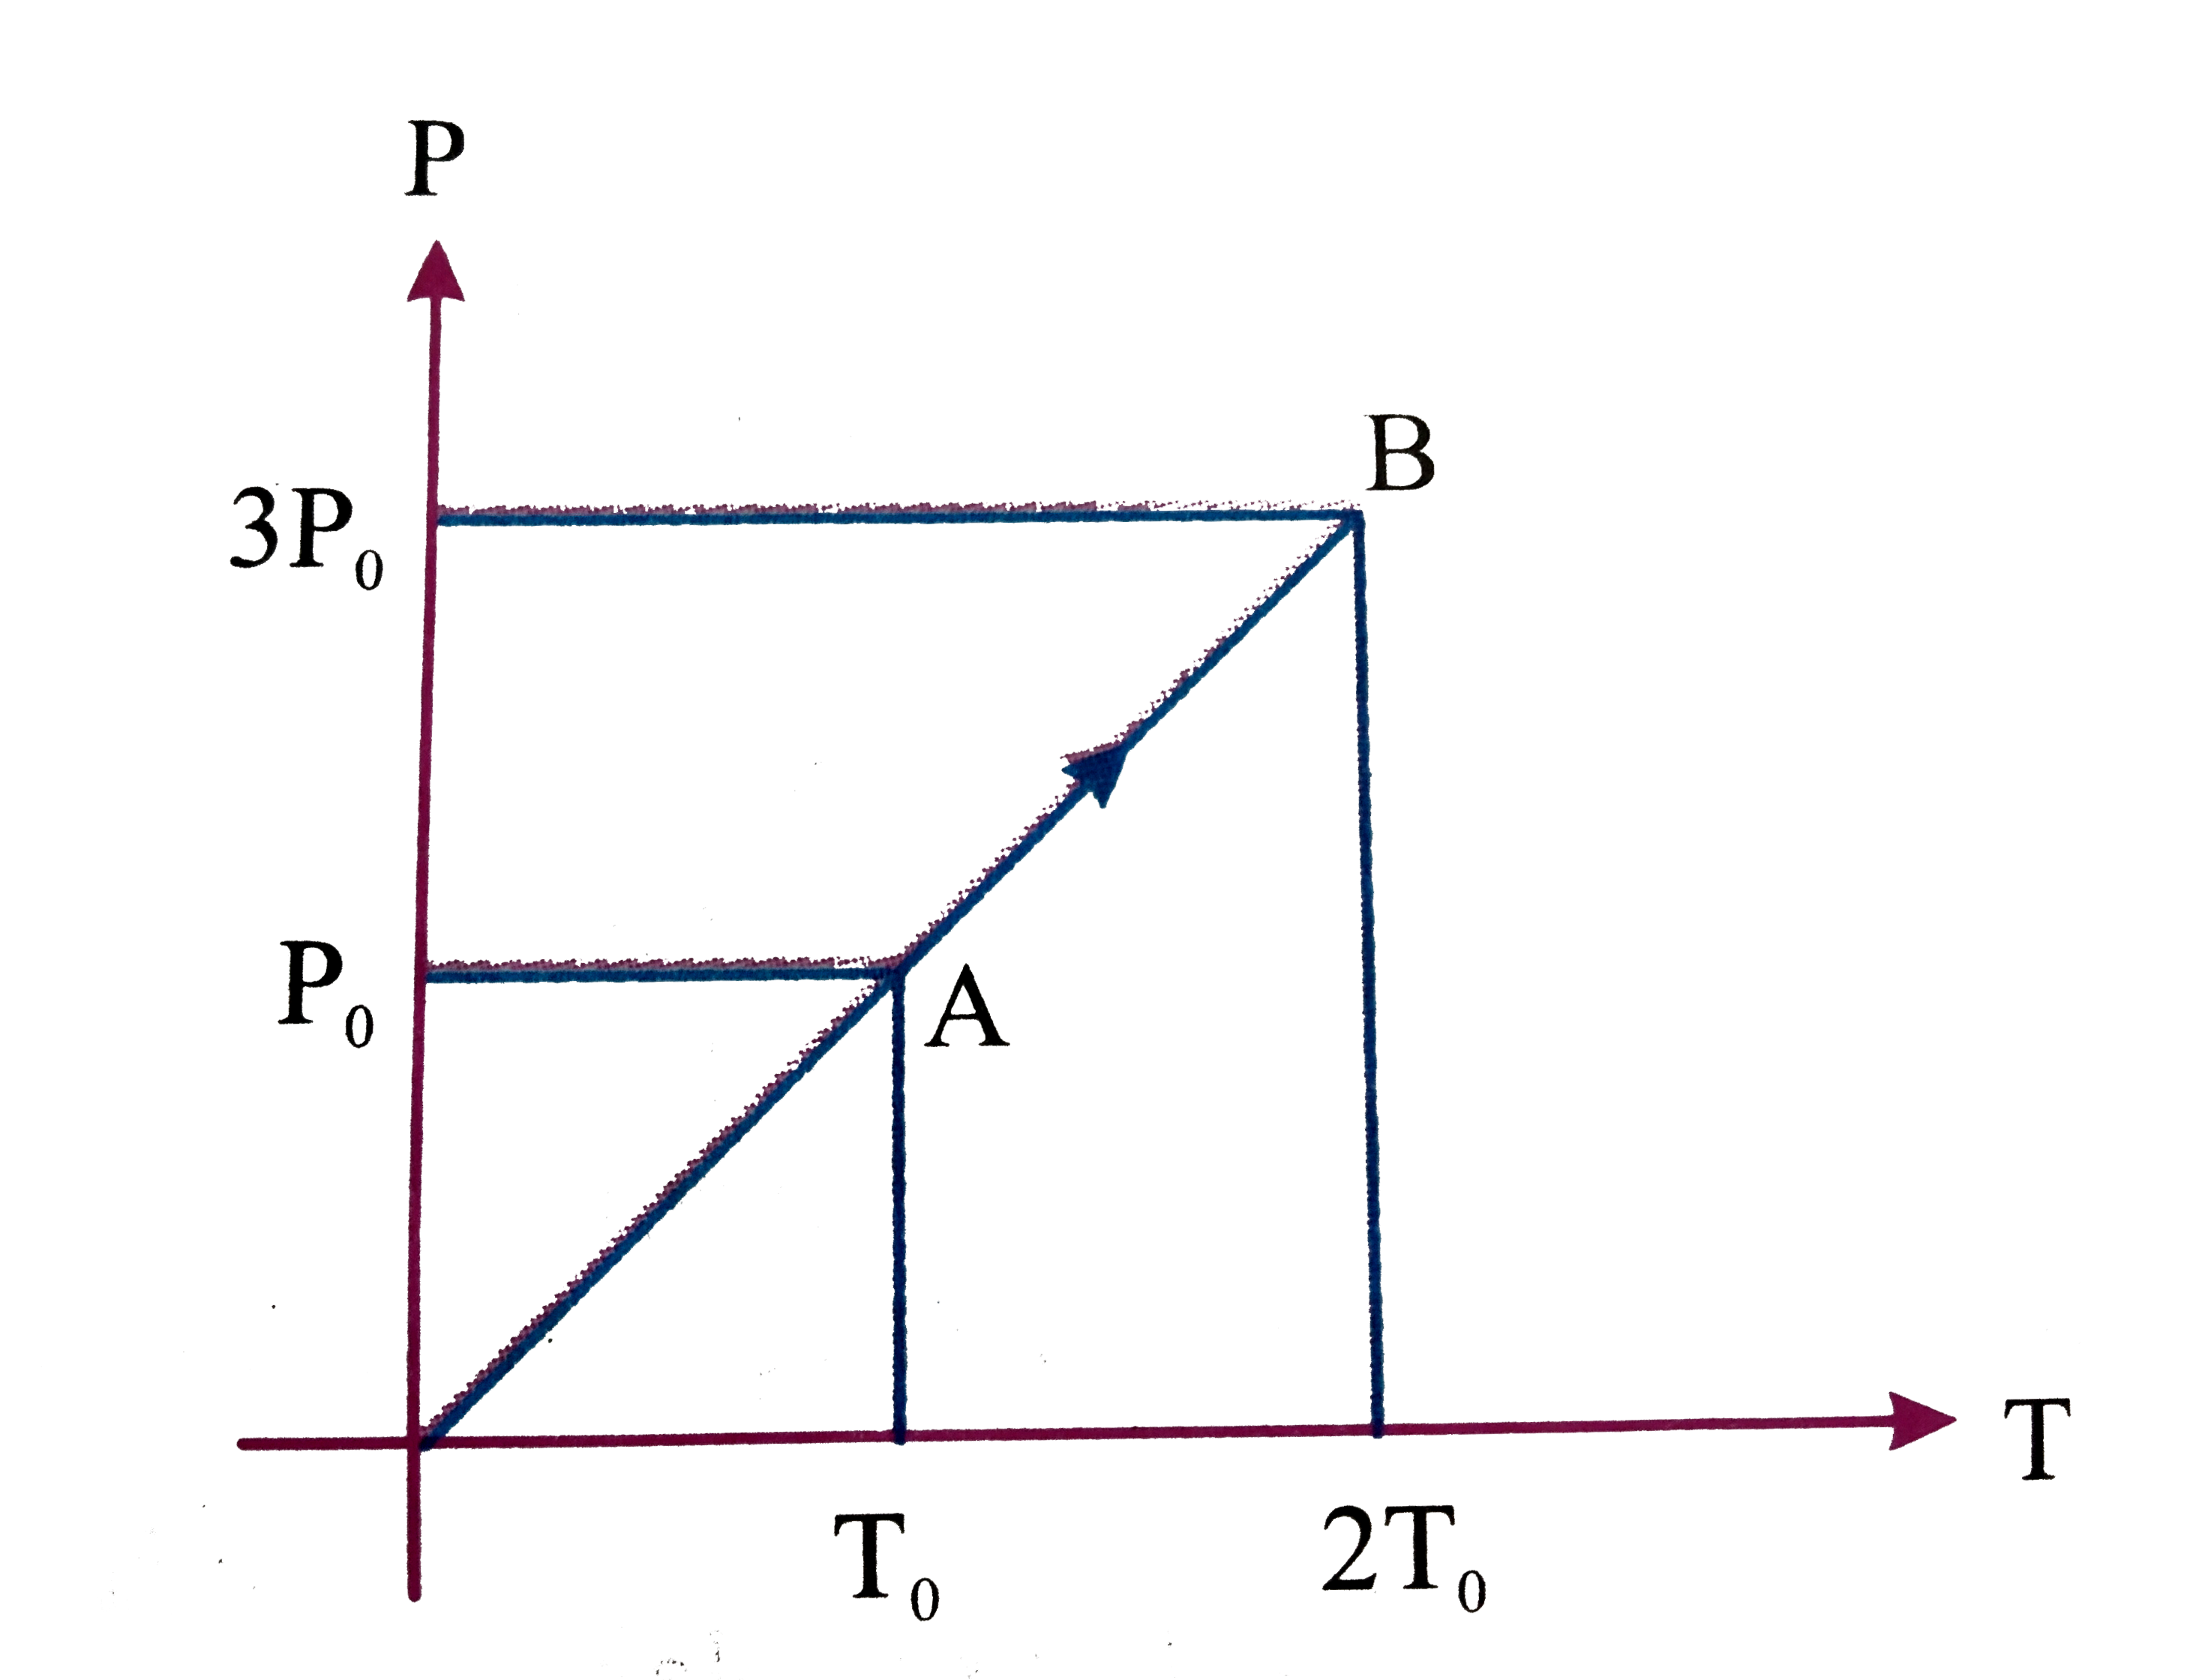
View SolutionPressure versus temperature graph of an ideal gas is shown in figure. Density of the gas at point A is ρ0. Density at B will be
View Solution
