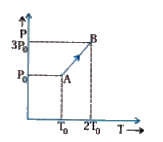
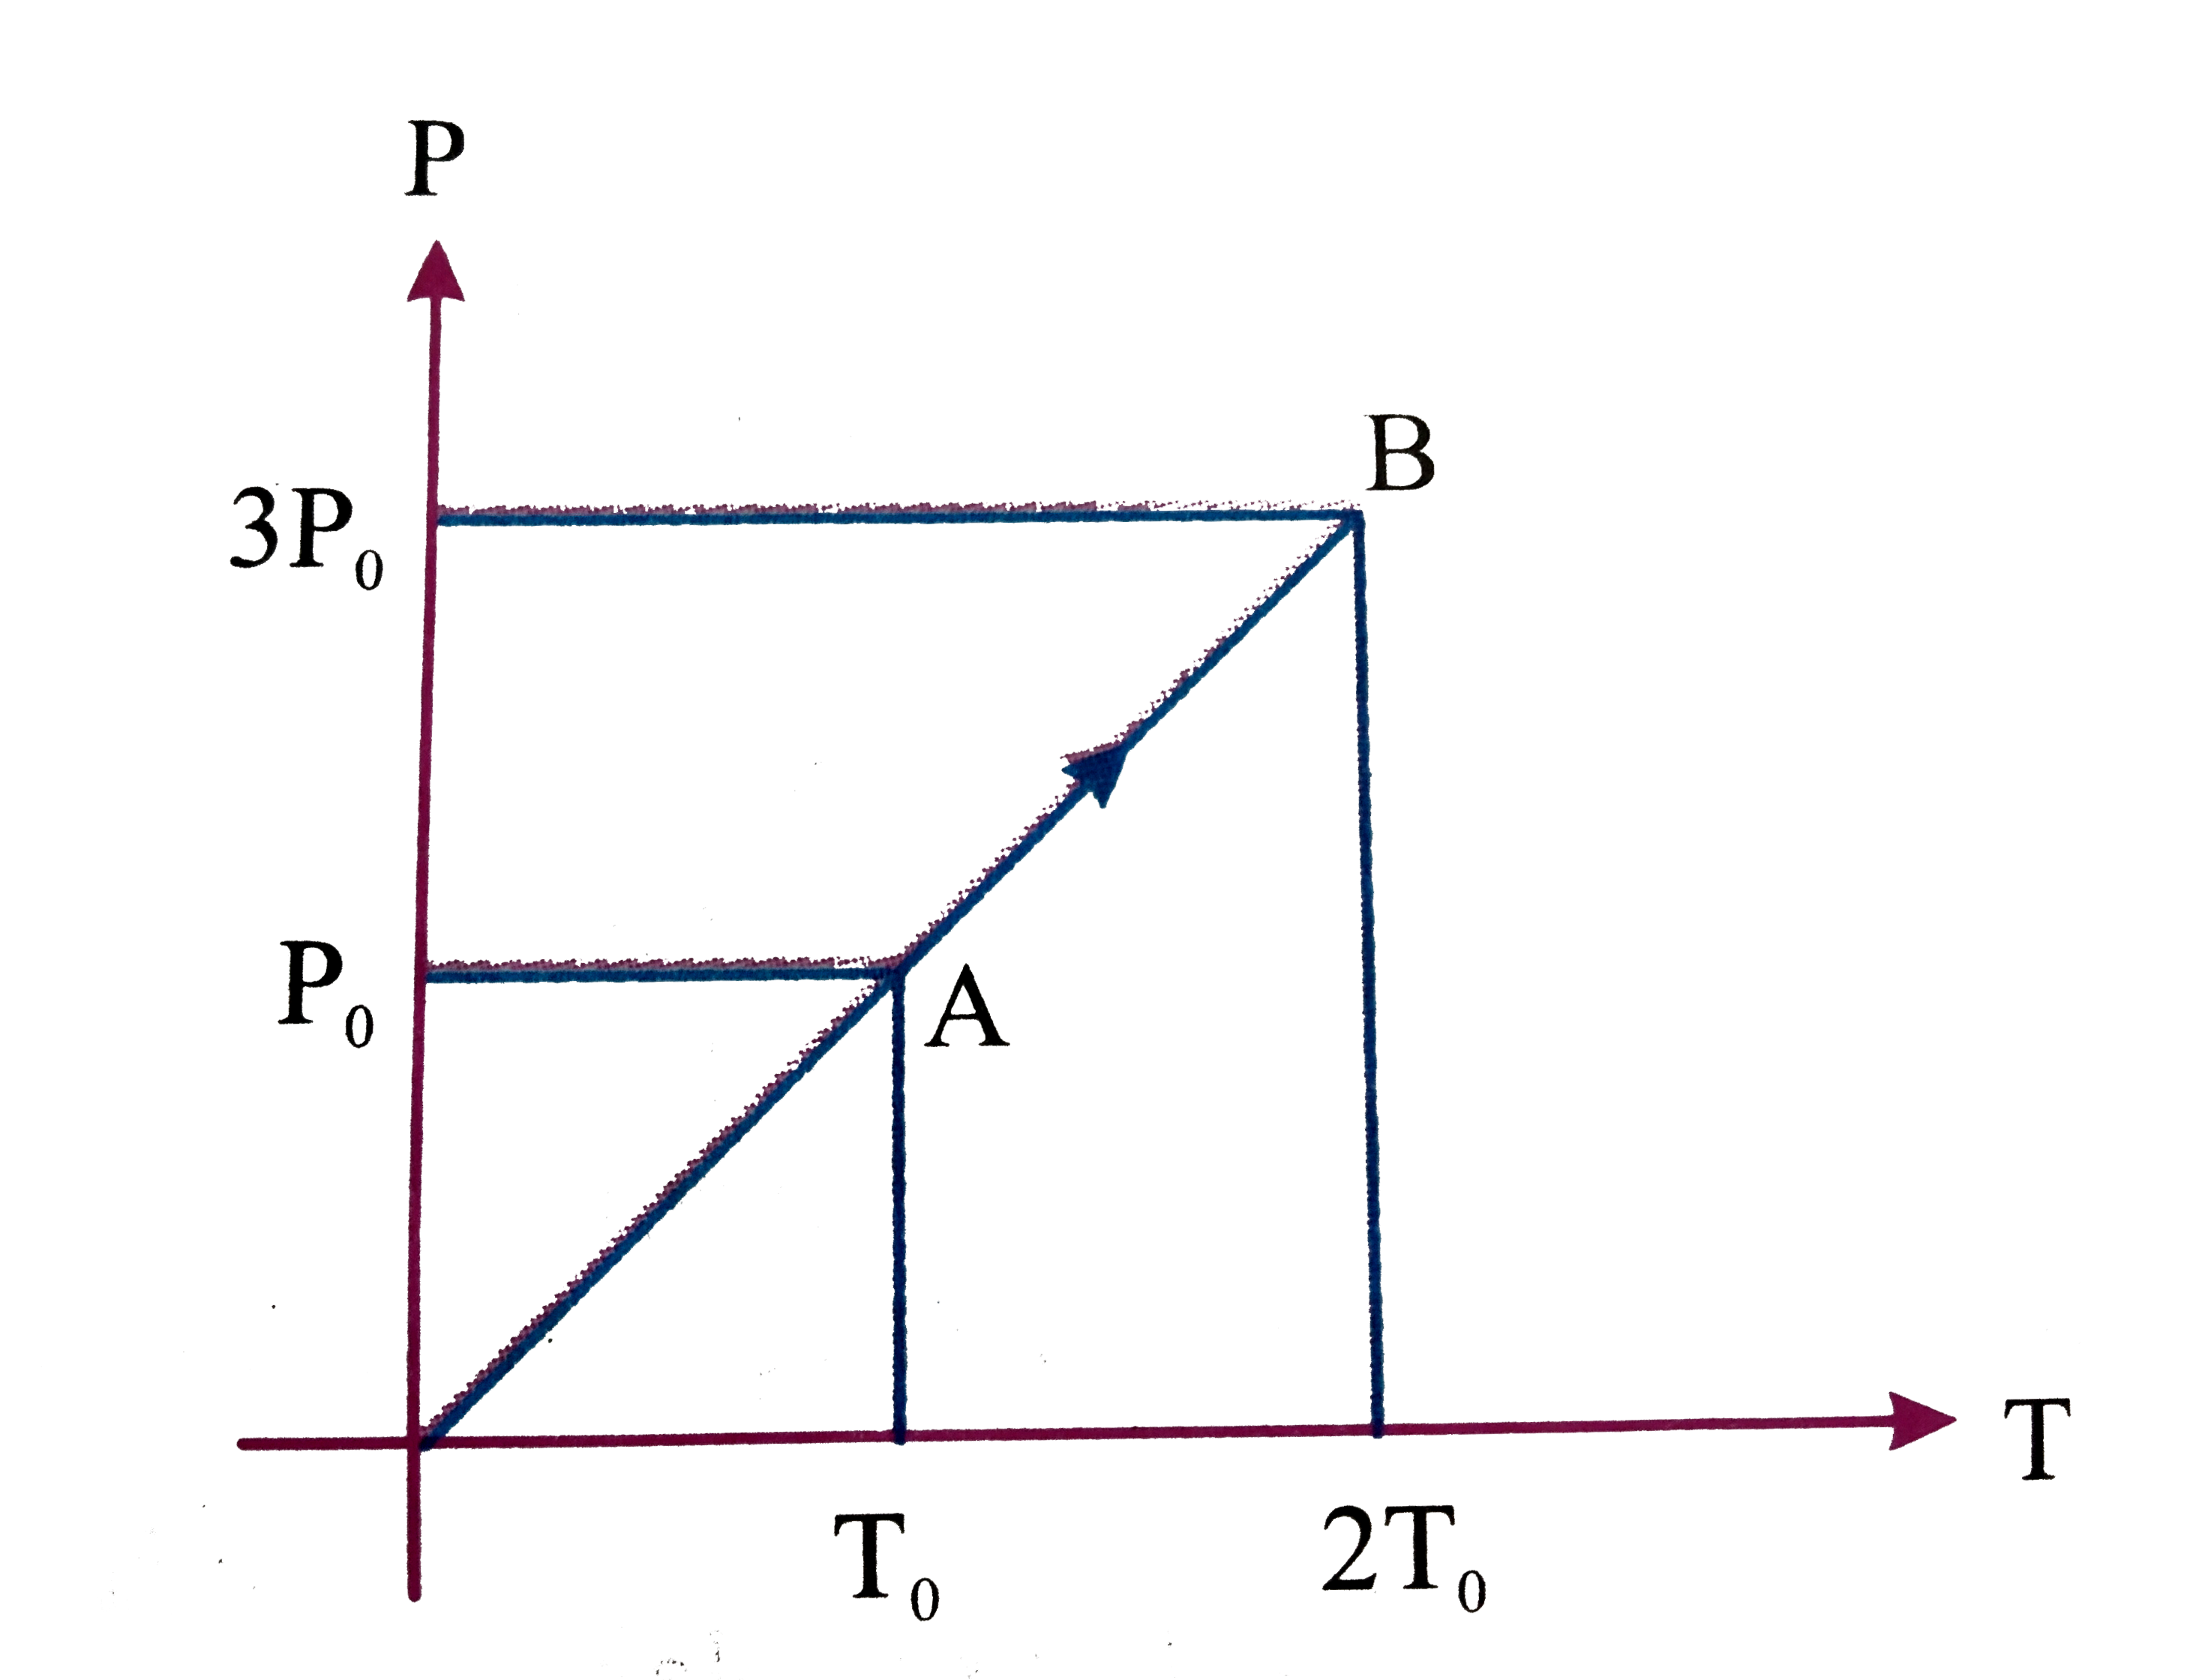
Pressure versus temperature graph of an ideal gas is as shown in figure. Density of the gas at point A is ρ0 . Density at point B will be ____
 Solution in Gujrati
34ρ0
32ρ0
43ρ0
2ρ0
The correct Answer is:B
ρ=PMRT or ρ∝PT
∴(PT)A=P0T0 and (PT)B=32(P0T0)
∴(PT)B=32(PT)A
∴ρB=32ρA=32ρ0
Topper's Solved these Questions
- THERMODYANMICS BOOK - KUMAR PRAKASHANCHAPTER - THERMODYANMICS EXERCISE - Section-F Questions from Module
20 Videos
- THERMODYANMICS BOOK - KUMAR PRAKASHANCHAPTER - THERMODYANMICS EXERCISE - Question Paper
11 Videos
- THERMODYANMICS BOOK - KUMAR PRAKASHANCHAPTER - THERMODYANMICS EXERCISE - Section-D Ncert Exemplar Solution (Long Answer )
5 Videos
- THERMAL PROPERTIES OF MATTERBOOK - KUMAR PRAKASHANCHAPTER - THERMAL PROPERTIES OF MATTEREXERCISE - Question Paper (Section - D) (Answer following in brief :) Each carry 4 marks
1 Videos
- UNITS AND MEASUREMENTBOOK - KUMAR PRAKASHANCHAPTER - UNITS AND MEASUREMENTEXERCISE - Section -F (Questions from Module )
20 Videos
Similar Questions
In a thermodynamics process which one of the following statement is not true ?
View SolutionWhy is a steam burn more damaging than a burn with boiling water of the same ?
View SolutionConsider a P-V diagram in which the path followed by one mole of perfect gas in a cylindrical container is shown in figure.

(a) Find the work done when the gas is taken from state 1 to state 2.
(b) What is the ratio of temperature T1T2 if V2=2V1 ?
(c) Given the internal energy for one mole of gas at temperature T is 32RT, find the heat 2 supplied to the gas when it is taken from state 1 to 2, with V2=2V1
View SolutionIn an experiment on the specific heat of a metal, a 0.20 kg block of the metal at 150∘C is dropped in a copper calorimeter (of water equivalent 0.025 kg) containing 150 cm3 of water at 27∘C. The final temperature is 40∘C. Compute the specific heat of the metal. If heat losses to the surroundings are not negligible, is your answer greater or smaller than the actual value for specific heat of the metal ?
View SolutionIf the error in measurement of radius of a shpere is 2% then the error in determination of volume of the sphere will be …………
View SolutionPressure versus temperature graph of an ideal gas as shown in Fig. Corresponding density (rho) versus volume (V) graph will be
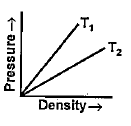
View SolutionFigure shows graphs of pressure versus density for an ideal gas at two temperatures T_(1) and T_(2) Which is correct ? .
View SolutionPressure versus temperature graph of an ideal gas is shown in figure. Density of the gas at point A is P0. Density at B will be

View SolutionPressure versus density graph of an ideal gas is shown in figure
View SolutionFigure shows graphs of pressure versus density for an ideal gas at two temperatures T1 and T2 Then

View SolutionPressure versus temperature graph of an ideal gas is as shown in figure. Density of the gas at point A is rho_0 . Density at B will be:
View SolutionPressure versus density graph of an ideal gas is shown in figure
View SolutionPressure versus temperature graph of an ideal gas is shown in figure. Density of the gas at point A is rho_(0) . Density at B will be
View SolutionFigure shows graphs of pressure versus density for an ideal gas at two temperatures T_(1) and T_(2) Which is correct ? .
View SolutionFigure shows graphs of pressure versus density for an ideal gas at two temperatures T1 and T2. Which is correct:

View Solution
