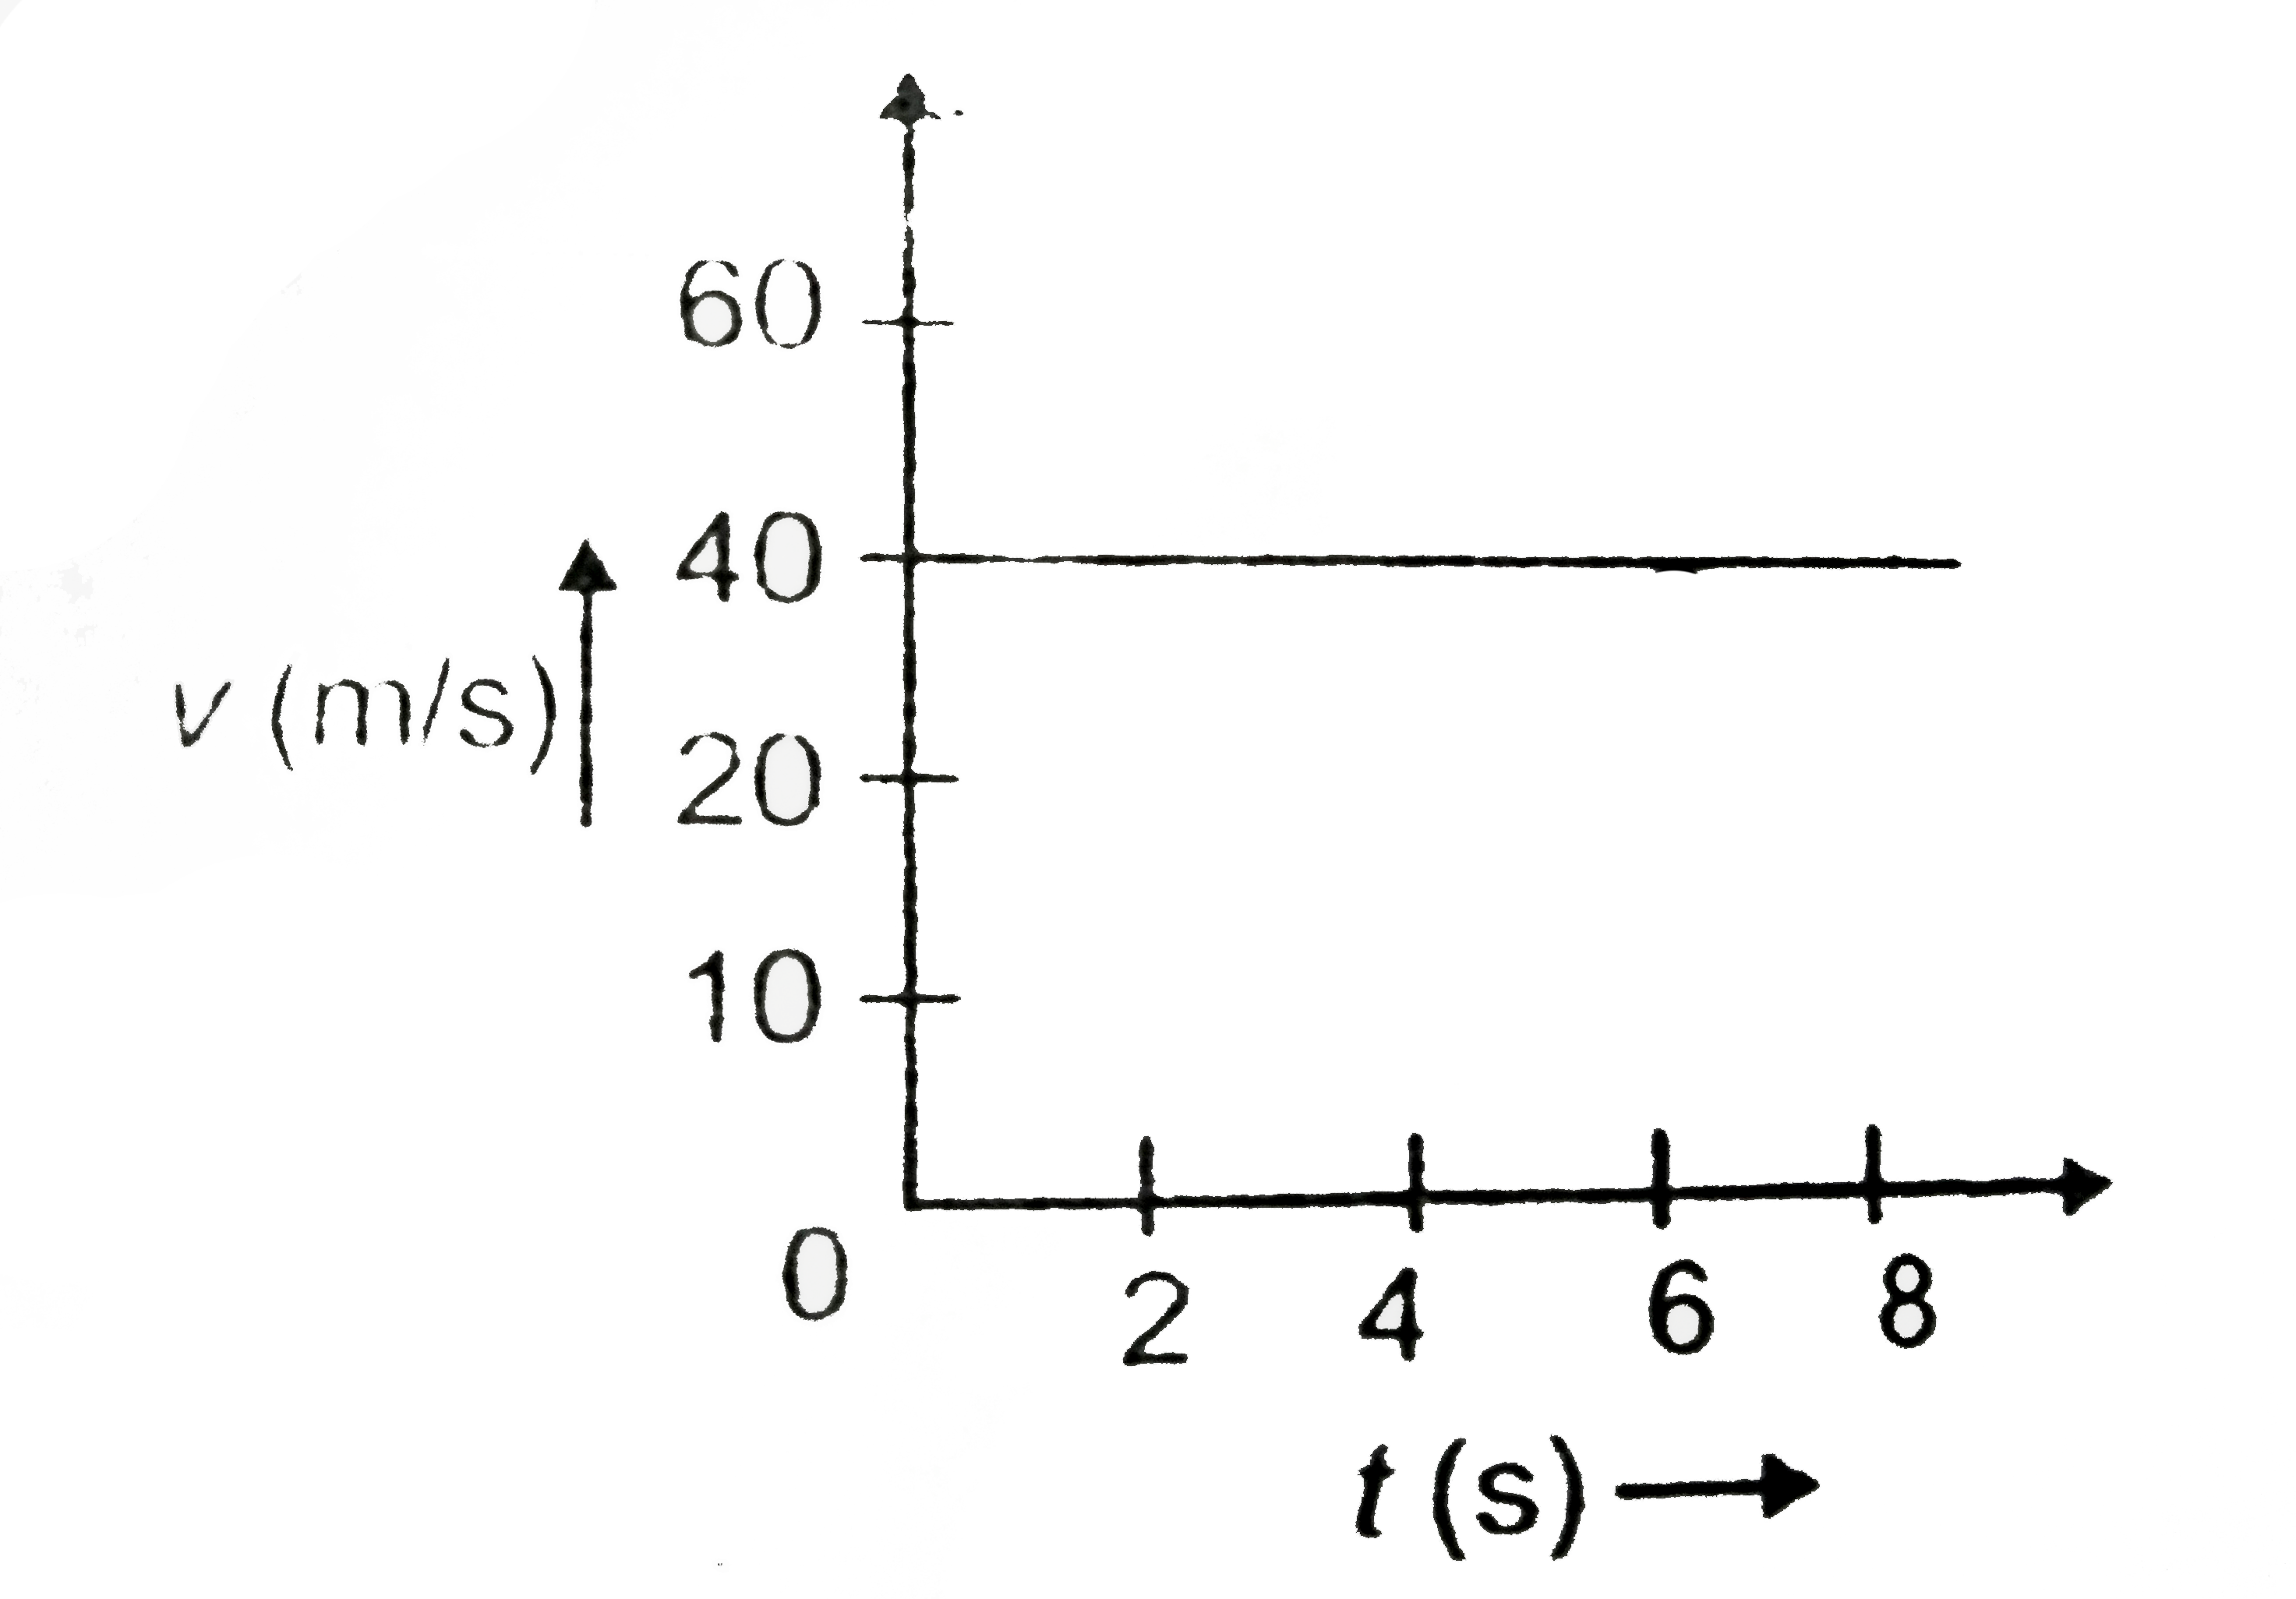
Draw the velocity-time graph of an object whose speed is increasing at uniform rate but moving with negative acceleration.
To solve the problem of drawing the velocity-time graph of an object whose speed is increasing at a uniform rate while moving with negative acceleration, we can follow these steps:
1. Understanding the Problem:
- The object is moving with negative acceleration, which means that the acceleration is acting in the opposite direction to the velocity.
- However, the speed (the magnitude of velocity) is increasing, indicating that the object is initially moving in one direction and then starts moving faster in the opposite direction.
2. Choosing a Scenario:
- We can consider an object (like a ball) thrown upwards with an initial velocity u. The acceleration due to gravity g acts downwards, which is negative acceleration in the upward motion.
3. Analyzing the Motion:
- As the ball moves upwards, its velocity decreases until it reaches the maximum height (where velocity becomes zero).
- After reaching the maximum height, the ball starts falling downwards, and its speed increases as it falls due to gravity.
4. Identifying Key Points:
- Let’s denote the time taken to reach the maximum height as t1. At this point, the velocity is zero.
- The time taken to reach maximum height can be calculated using the formula v=u−gt. Setting v=0 gives us t1=ug.
5. Drawing the Graph:
- On the velocity-time graph:
- The y-axis represents velocity and the x-axis represents time.
- The graph starts at (0,u) (initial velocity).
- It slopes downwards to the point (t1,0) where the velocity becomes zero.
- After t1, the graph will slope upwards, indicating that the speed is increasing in the negative direction (falling downwards).
6. Finalizing the Graph:
- The graph will be a straight line from (0,u) to (t1,0) with a negative slope, and then another straight line starting from (t1,0) moving upwards indicating increasing speed in the negative direction.
Summary of the Graph:
- The graph consists of two segments:
- A downward sloping line from (0,u) to (t1,0).
- An upward sloping line starting from (t1,0) indicating increasing speed in the negative direction.
- The object is moving with negative acceleration, which means that the acceleration is acting in the opposite direction to the velocity.
- However, the speed (the magnitude of velocity) is increasing, indicating that the object is initially moving in one direction and then starts moving faster in the opposite direction.
- We can consider an object (like a ball) thrown upwards with an initial velocity u. The acceleration due to gravity g acts downwards, which is negative acceleration in the upward motion.
- As the ball moves upwards, its velocity decreases until it reaches the maximum height (where velocity becomes zero).
- After reaching the maximum height, the ball starts falling downwards, and its speed increases as it falls due to gravity.
- Let’s denote the time taken to reach the maximum height as t1. At this point, the velocity is zero.
- The time taken to reach maximum height can be calculated using the formula v=u−gt. Setting v=0 gives us t1=ug.
- On the velocity-time graph:
- The y-axis represents velocity and the x-axis represents time.
- The graph starts at (0,u) (initial velocity).
- It slopes downwards to the point (t1,0) where the velocity becomes zero.
- After t1, the graph will slope upwards, indicating that the speed is increasing in the negative direction (falling downwards).
- The graph will be a straight line from (0,u) to (t1,0) with a negative slope, and then another straight line starting from (t1,0) moving upwards indicating increasing speed in the negative direction.
- The graph consists of two segments:
- A downward sloping line from (0,u) to (t1,0).
- An upward sloping line starting from (t1,0) indicating increasing speed in the negative direction.
Topper's Solved these Questions
- MOTION IN STRAIGHT LINEBook:AAKASH INSTITUTE ENGLISHChapter:MOTION IN STRAIGHT LINEExercise:Try Yourself
Explore 40 Videos
- MOTION IN STRAIGHT LINEBook:AAKASH INSTITUTE ENGLISHChapter:MOTION IN STRAIGHT LINEExercise:Assignment (SECTION - A)
Explore 50 Videos
- MOTION IN A STRAIGHT LINEBook:AAKASH INSTITUTE ENGLISHChapter:MOTION IN A STRAIGHT LINEExercise:ASSIGNMENT (SECTION - D)
Explore 15 Videos
- MOVING CHARGE AND MAGNESIUMBook:AAKASH INSTITUTE ENGLISHChapter:MOVING CHARGE AND MAGNESIUMExercise:SECTION D
Explore 16 Videos
Similar Questions
Draw the velocity-time graph of an object moving with uniform negative acceleration.
View SolutionDraw areal velocity time graph for Mars.
View SolutionPosition - time graph for motion with negative acceleration is
View SolutionDraw the position-time graph of a stationary object.
View SolutionDraw the x-t graph of an object in uniform motion.
View SolutionThe velocity-time graph of an object is shown below. The acceleration of the object is

View SolutionDraw the position-time graph of an object moving with positive accceleration.
View SolutionIf the velocity of an object is increasing and changing at a uniform rate then the acceleration of the object is:
View SolutionIf the velocity of an object is increasing and changing at a uniform rate then the acceleration of the object is
(i) Positive (ii) Zero
(iii) Negative (iv) Not defined
View SolutionDraw the position-time graph of a moving object, moving with zero acceleration.
View Solution
