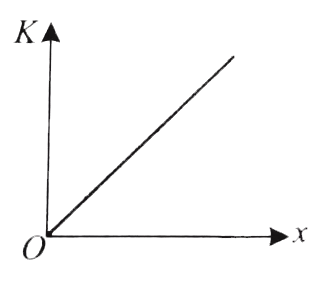
A body moves from rest with a constant acceleration. Which one of the following graphs represents the variation of its kinetic energy K with the distance travelled x?


The correct Answer is:C
When body moves under action of constant force then kinetic energy acquired by the body K.E.=F×S
Ke∝S(if F=constant)
So the graph will be straight line.
Similar Questions
Which of the following graphs best represents the variation of acceleration 'a' with displacement x?
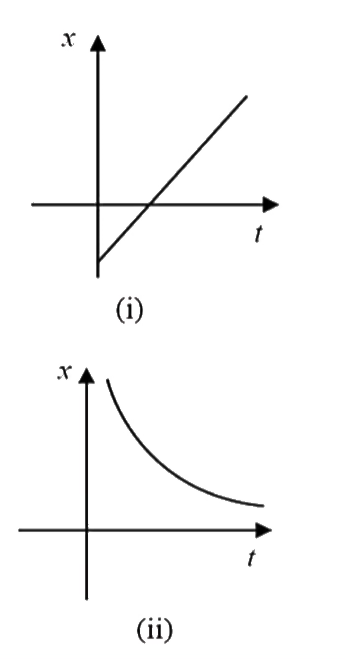
View SolutionWhich of the following graphs represents the motion of a particle moving with constant velocity?


View SolutionWhich one of the following graphs represents the variation of electric field with distance r from the centre of a charged spherical conductor of radius R?
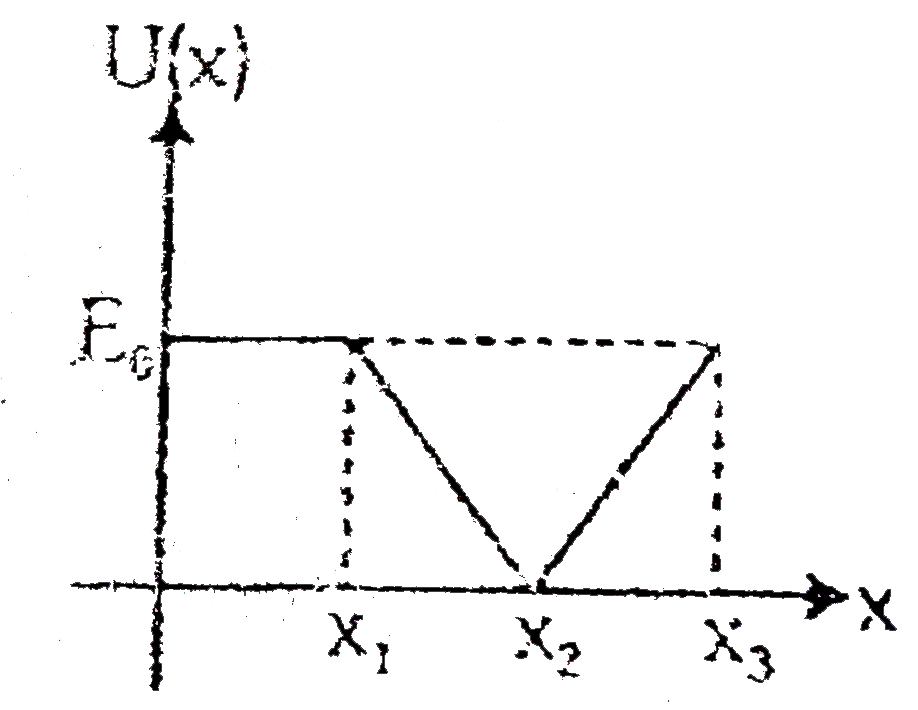
View SolutionThe potential energy U(x) of a particle moving along x−axis is shown in figure. Which one of the following graphs represents the variation of kinetic energy of this particel if its total mechanical enery is E0

View SolutionWhich of the following graph represents the variation of amount of chemisorption of a gas by a solid with temperature under constant pressure?
View SolutionThe graph which represents the variation of mean kinetic energy of moleules with temperature ∘C is ?
View SolutionThe velocity v of a particle moving along x - axis varies with ist position (x) as v=α√x, where α is a constant. Which of the following graph represents the variation of its acceleration (a) with time (t)?
View SolutionWhich of the following graphs correctly represents the variation of β=−dV/dPV
with P for an ideal gas at constant temperature?
View SolutionWhich of the following graphs correctly represents the variation of β=−dV/dPV
with P for an ideal gas at constant temperature?
View SolutionThe graph shown the variation with times t of the velocity v of an object . Which one of the following graphs best represents the variation of acceleration a of the object with time t?

View Solution
