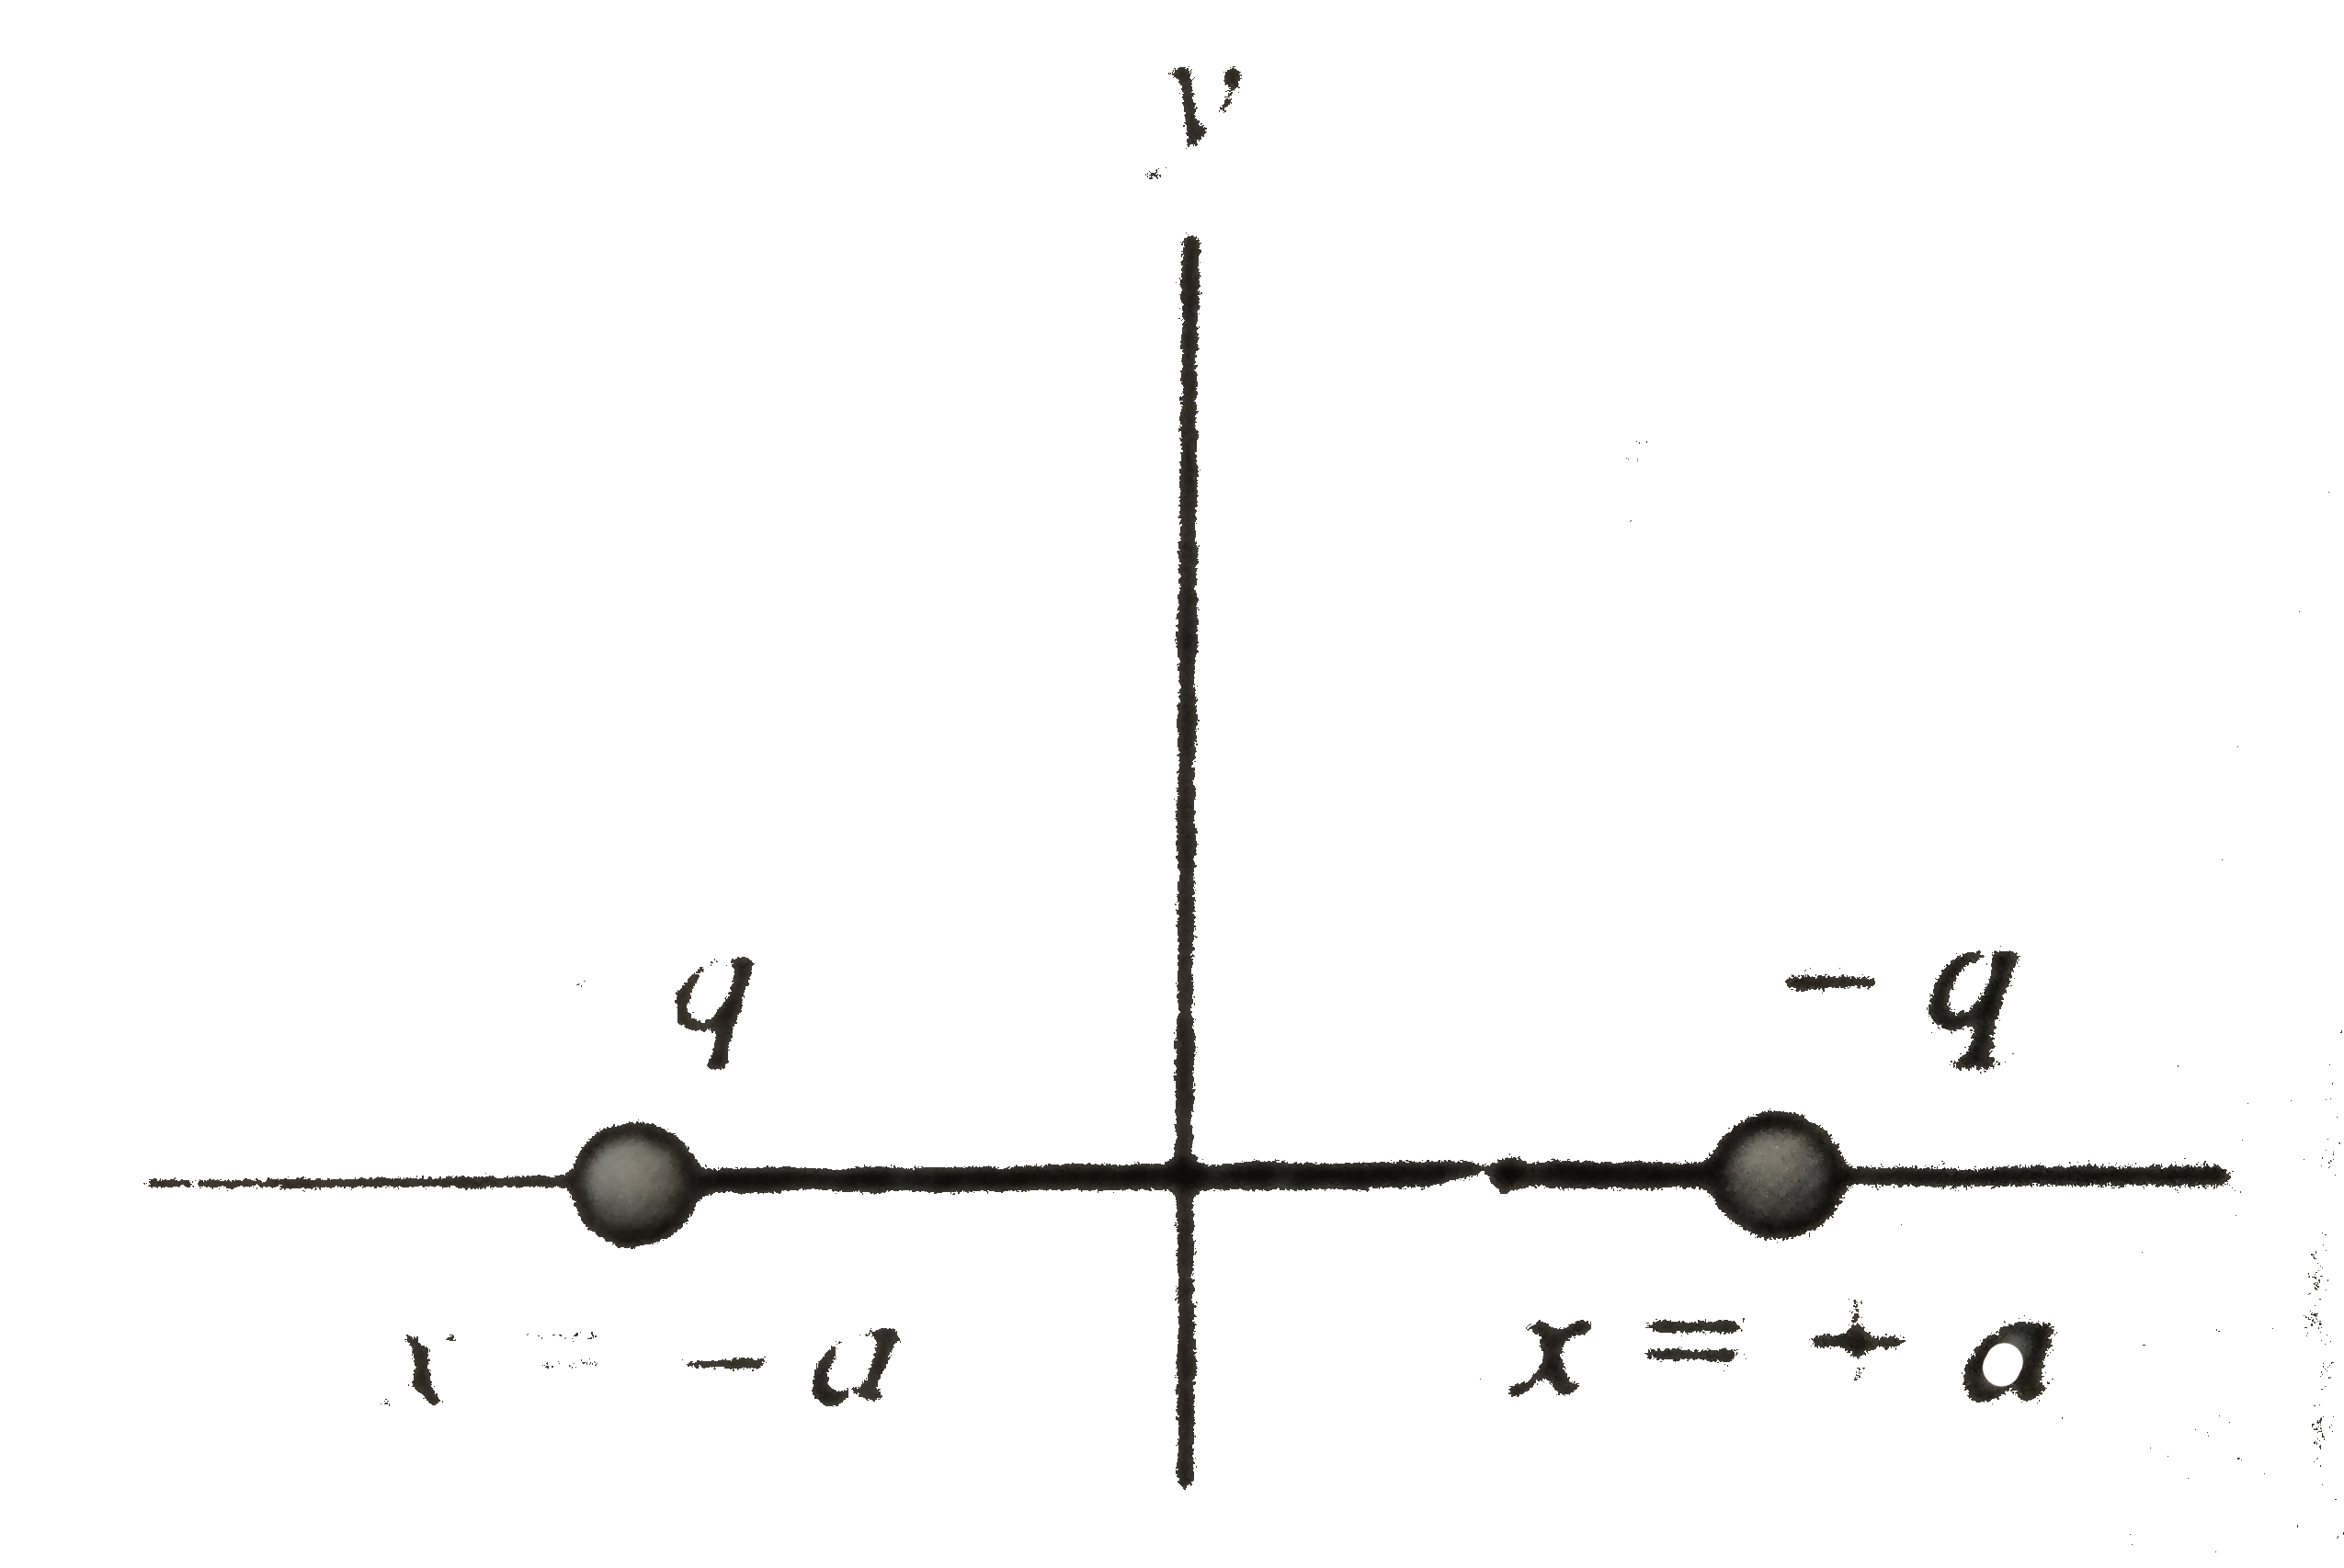
Two point charge ±q are placed on the axis at x=−a and x=+a, as shown in fig.
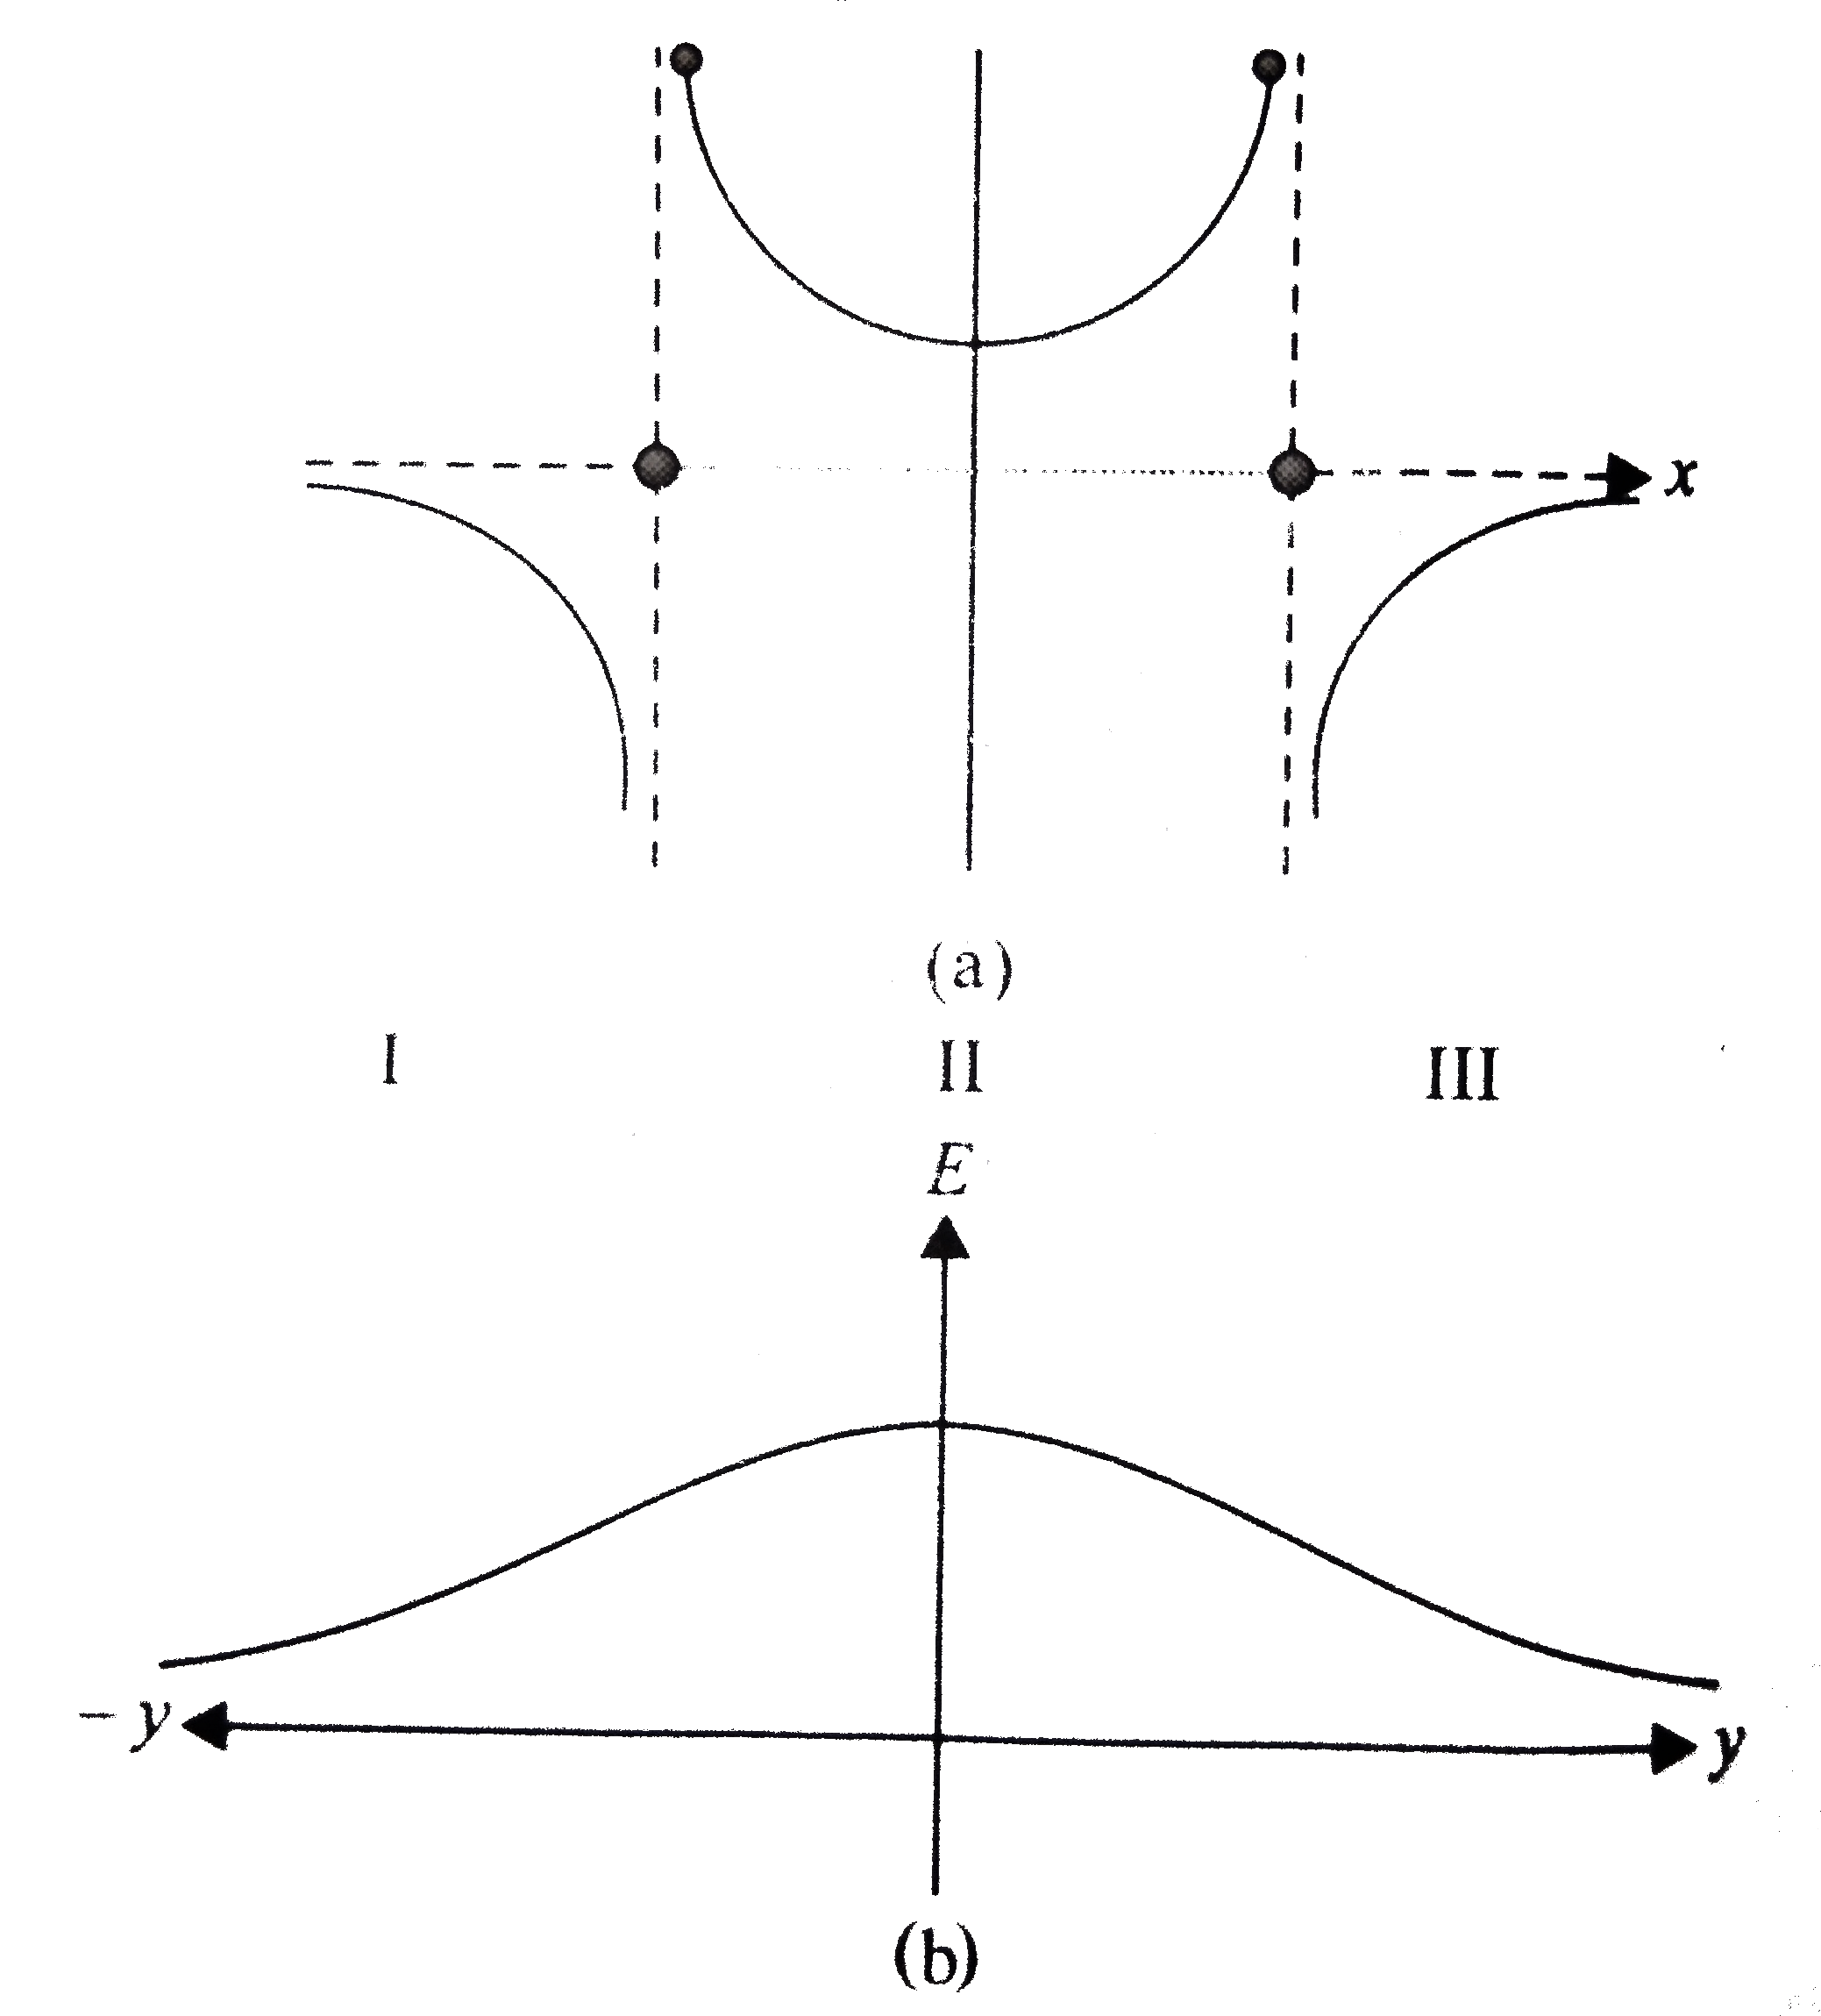
(i) Plot the variation of E along the x-axis.
(ii) Plot the variation of E along the y-axis.
(i) Variation of E along the x-axis is shown in fig.
(ii) Variation of E along the y-axsi is shown in fig.
This case field will be maximum at origin beacause at origein filed due to both charge is directly added.
Topper's Solved these Questions
- BOOK - CENGAGE PHYSICS ENGLISHCHAPTER - COULOMB LAW AND ELECTRIC FIELDEXERCISE - Subjective Type15videos
COULOMB LAW AND ELECTRIC FIELD
- BOOK - CENGAGE PHYSICS ENGLISHCHAPTER - COULOMB LAW AND ELECTRIC FIELDEXERCISE - Subjective32videos
COULOMB LAW AND ELECTRIC FIELD
- BOOK - CENGAGE PHYSICS ENGLISHCHAPTER - COULOMB LAW AND ELECTRIC FIELDEXERCISE - Solved examples10videos
COULOMB LAW AND ELECTRIC FIELD
- BOOK - CENGAGE PHYSICS ENGLISHCHAPTER - CENGAGE PHYSICS DPPEXERCISE - subjective type51videos
CENGAGE PHYSICS DPP
- BOOK - CENGAGE PHYSICS ENGLISHCHAPTER - ELECTRIC CURRENT & CIRCUITSEXERCISE - Kirchhoff s law and simple circuits15videos
ELECTRIC CURRENT & CIRCUITS
Similar Questions
Three charges are placed along x-axis at x = - a x = 0 and x = a as shown in the figure. The potential energy of the system is
 View Solution
Three charges are placed along x- axis at x=−a,x=0 and x=a as shown . Calculate the potential energy of the system.
 View Solution
In the figure, two point charges +qand−q are placed on the x-axis at (+a,0)and(−a,0) respectively. A tiny dipole of dipolem moment (p) is kept at the origin along the y-axis. The torque on the dipole equals
 View Solution
Two identical positive charges are placed at x=−a and x=a. The correct variation of potential V along the x-axis is given by
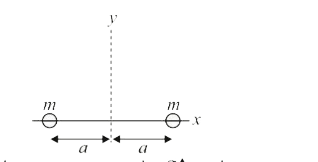
View SolutionTwo identical spherical balls, each of mass m, are placed as shown in figure. Plot the variation of g(gravitation intensity) along the x-axis due to both the masses.
 View Solution
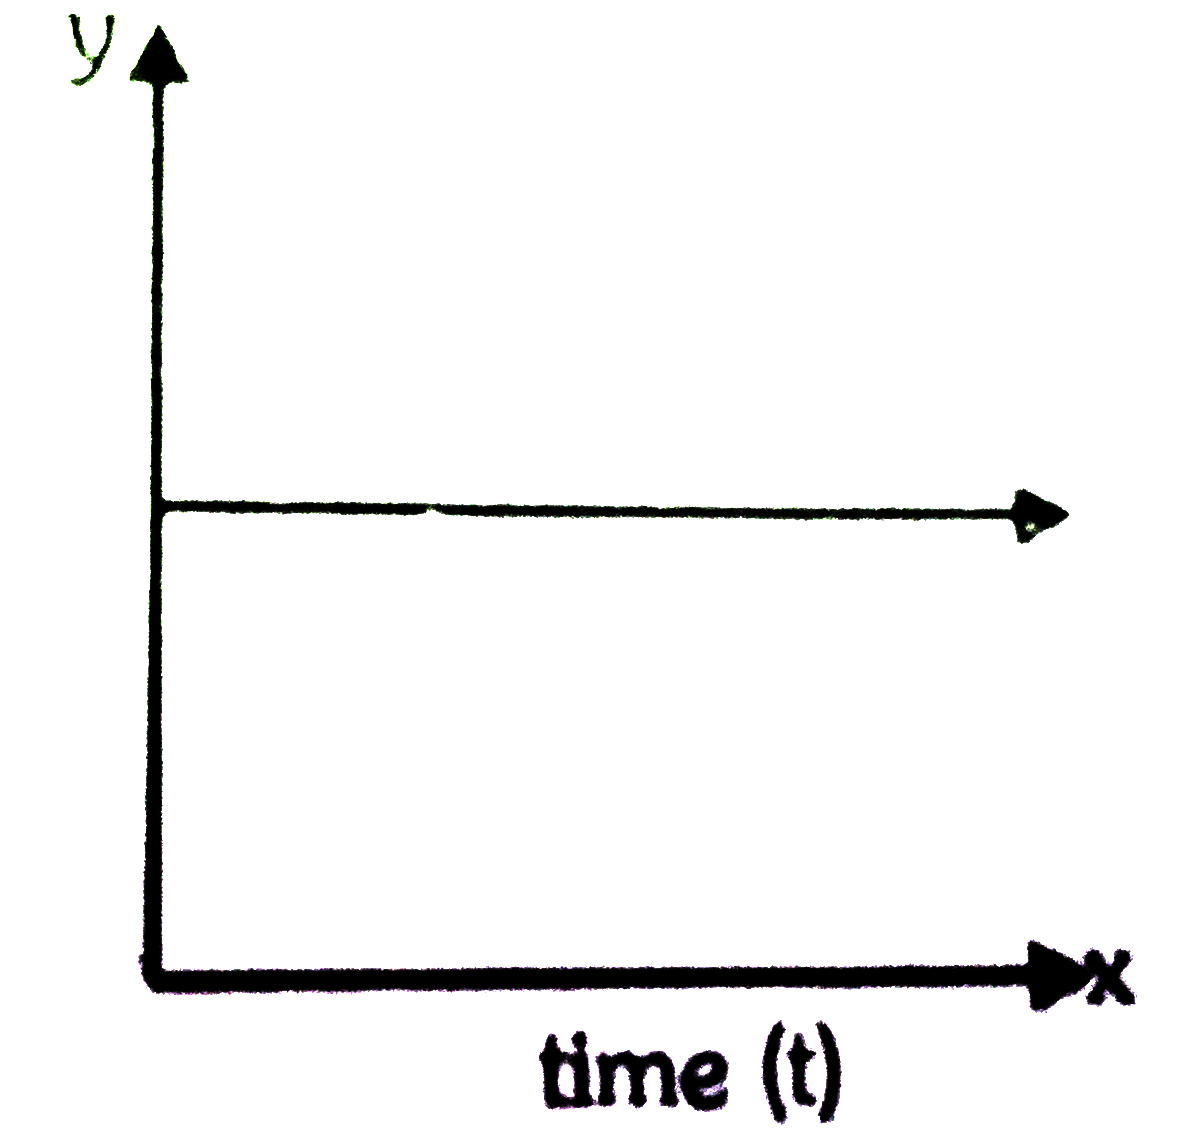
In the graph shown in fig. the time is plotted along x-axis. Which quantity associated with the projectile motion is plotted along the y -axis:-
 View Solution
Two point charges (Q each are placed at (0,y) and (0-y) A point charge q of the same polarity can move along the x-axis. Then
View SolutionThe charges - q, Q, -q are placed along x-axis at x = 0, x = a and x = 2a. If the potential energy of the system is zero, then Q:q is
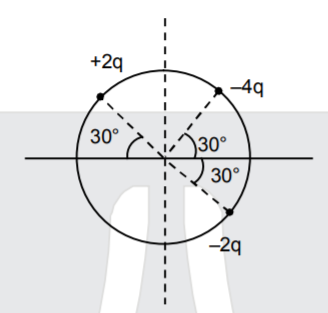
View Solution3 charges are placed in a circle of radius d as shown in figure. Find the electric field along x-axis at centre of circle.
 View Solution
3 charges are placed in a circle of radius d as shown in figure. Find the electric field along x-axis at centre of circle.
 View Solution
