A vehicle is driven along a straight horizontal track by a motor which exerts a constant driving force. The vehicle starts from rest at t=0 and the effects of friction and air resistance are negligible. If the kinetic eneryg of the vehicle at time t is E and power developed by the motor is P, which of the following graphs are correct?
(a) 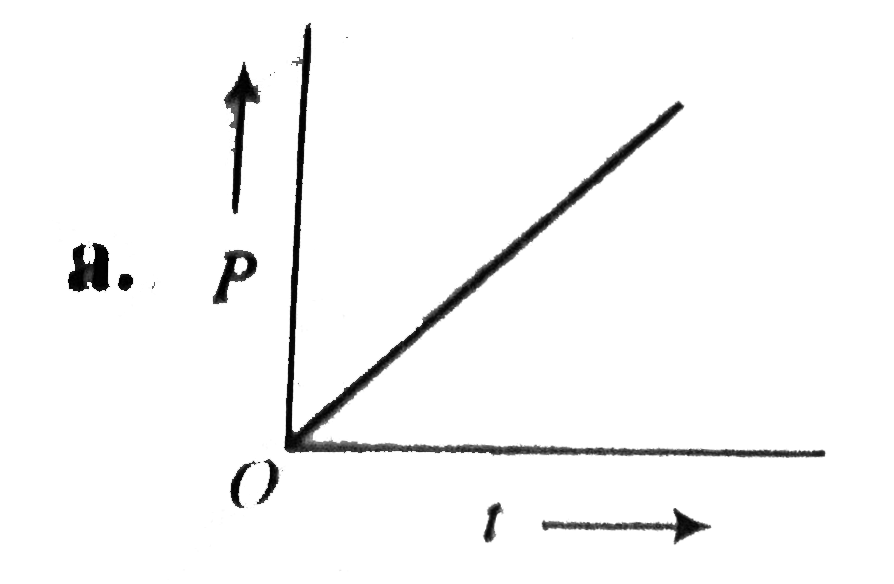
(b) 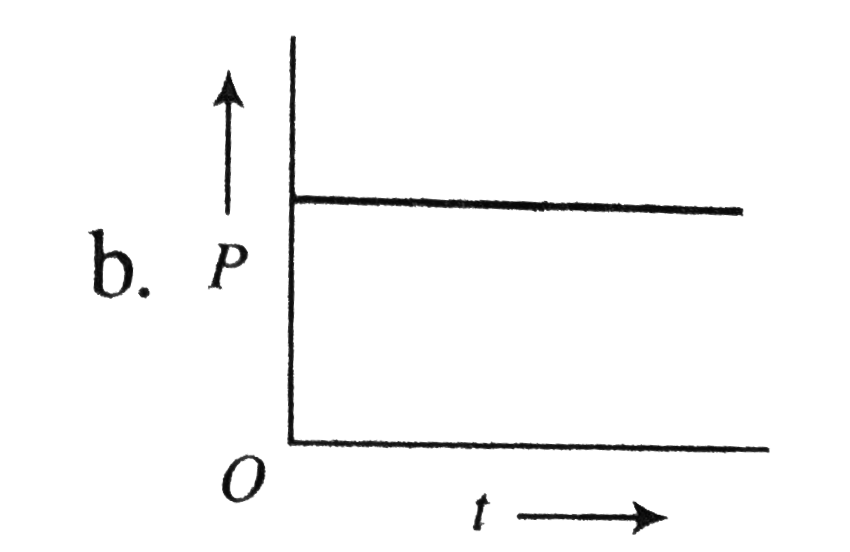
(c) 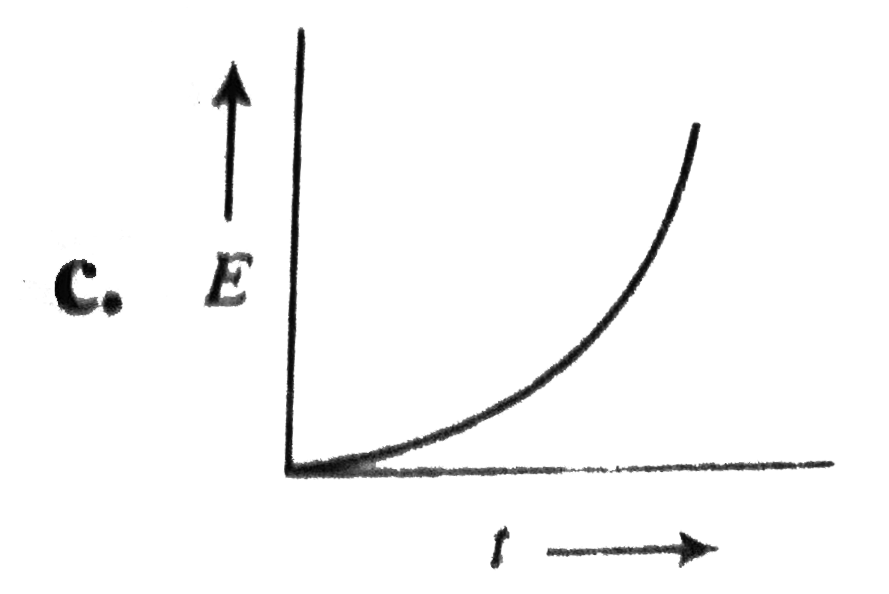
(d) 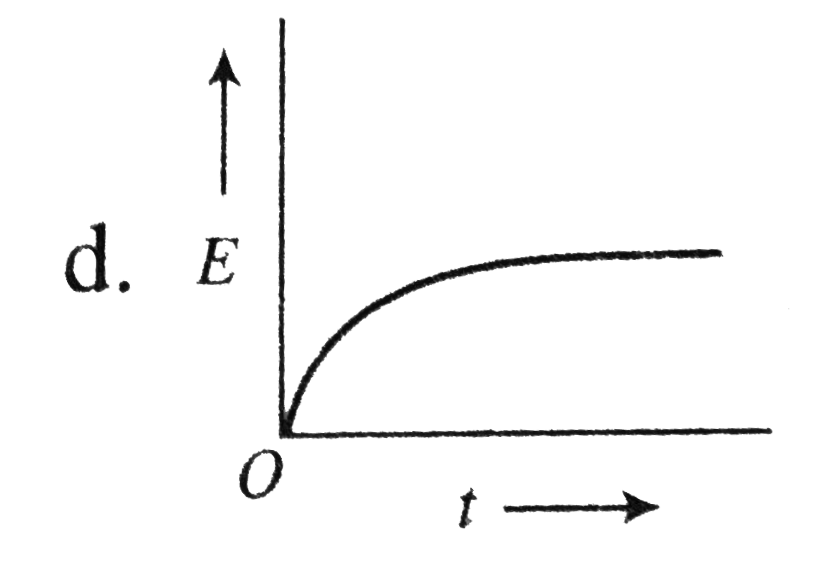
The correct Answer is:A, C
To solve the problem, we need to analyze the motion of the vehicle under the influence of a constant driving force. We will derive the expressions for kinetic energy and power, and then determine the correct graphs for each.
1. Understanding the Motion:
- The vehicle starts from rest, which means the initial velocity u=0.
- The driving force F is constant, and since there are negligible effects of friction and air resistance, the vehicle will experience constant acceleration.
2. Finding Acceleration:
- According to Newton's second law, the acceleration a can be expressed as:
a=Fm
- Here, m is the mass of the vehicle.
3. Velocity as a Function of Time:
- Since the vehicle starts from rest and accelerates uniformly, the velocity v at time t can be given by:
v=u+at=0+Fmt=Fmt
4. Kinetic Energy:
- The kinetic energy E of the vehicle at time t is given by:
E=12mv2
- Substituting the expression for v:
E=12m(Fmt)2=F22mt2
- This shows that kinetic energy E varies with the square of time t2, indicating a parabolic relationship.
5. Power Developed by the Motor:
- Power P is defined as the rate of doing work or the rate of change of energy. It can also be expressed as:
P=F⋅v
- Substituting the expression for v:
P=F⋅(Fmt)=F2mt
- This indicates that power P varies linearly with time t.
6. Graph Analysis:
- For kinetic energy E, since it varies as t2, the graph of E vs. t will be a parabola starting from the origin.
- For power P, since it varies linearly with time, the graph of P vs. t will be a straight line starting from the origin.
Conclusion:
- The correct graphs are:
- Kinetic Energy E vs. Time t: Parabolic curve (option C).
- Power P vs. Time t: Straight line (option A).
- The vehicle starts from rest, which means the initial velocity u=0.
- The driving force F is constant, and since there are negligible effects of friction and air resistance, the vehicle will experience constant acceleration.
- According to Newton's second law, the acceleration a can be expressed as:
a=Fm
- Here, m is the mass of the vehicle.
- Since the vehicle starts from rest and accelerates uniformly, the velocity v at time t can be given by:
v=u+at=0+Fmt=Fmt
- The kinetic energy E of the vehicle at time t is given by:
E=12mv2
- Substituting the expression for v:
E=12m(Fmt)2=F22mt2
- This shows that kinetic energy E varies with the square of time t2, indicating a parabolic relationship.
- Power P is defined as the rate of doing work or the rate of change of energy. It can also be expressed as:
P=F⋅v
- Substituting the expression for v:
P=F⋅(Fmt)=F2mt
- This indicates that power P varies linearly with time t.
- For kinetic energy E, since it varies as t2, the graph of E vs. t will be a parabola starting from the origin.
- For power P, since it varies linearly with time, the graph of P vs. t will be a straight line starting from the origin.
- The correct graphs are:
- Kinetic Energy E vs. Time t: Parabolic curve (option C).
- Power P vs. Time t: Straight line (option A).
Topper's Solved these Questions
- WORK, POWER & ENERGYBOOK - CENGAGE PHYSICS ENGLISHCHAPTER - WORK, POWER & ENERGYEXERCISE - Linked Comprehension
55 Videos
- WORK, POWER & ENERGYBOOK - CENGAGE PHYSICS ENGLISHCHAPTER - WORK, POWER & ENERGYEXERCISE - Integer
14 Videos
- WORK, POWER & ENERGYBOOK - CENGAGE PHYSICS ENGLISHCHAPTER - WORK, POWER & ENERGYEXERCISE - Single Correct
100 Videos
- VECTORSBOOK - CENGAGE PHYSICS ENGLISHCHAPTER - VECTORSEXERCISE - Exercise Multiple Correct
5 Videos
Similar Questions
A particle is projected from a point of an angle with the horizontal. At any instant t, if p is the linear momentum and E the kinetic energy, then which of the following graph is/are correct?
View SolutionFigure shows acceleration versus time graph of a particle starting from rest and moving along a straight line. Which of the following staement (s) is/are correct ?
View SolutionA motor drives a body along a straight line with a constant force. The power P developed by the motor must vary with time t as
View SolutionA particie of mass 10 kg is driven by a machine that delivers a constant power of 20 watts. If particle starts from rest and moves along a straight line, then force (in Newton) on particle at time t(t> 0) is
View SolutionAcceleration versus time curve for a particle moving in a straight line is shown in the figure. If particle starts from rest at t=0, then which of the following curve is correct for the same particle.

View SolutionA car, starting from rest, has a constant acceleration for a time interval t1 during which it covers a distance In the next time interval the car has a constant retardation and comes to rest after covering a distance in time Which of the following relations is correct?
View SolutionA particle starts moving from rest the origin & moves along positive x− direction . Its rate of change of kinetic energy with time shown on y− axis veries with time t as shown in the graph. If position, velocity , acceleration & kinetic energy of the particle at any time t are x,v,a,&k respectively then which of the option (s) may be correct ?
View SolutionA particle is resting over a smooth horizontal floor. At t=0, a horizontal force starts acting on it. Magnitude of the force increases with time according to law F=αt, Where alpha is a positive constant. From figure, which of the following statements are correct ?
View SolutionA body is at rest at x=0 . At t=0, it starts moving in the positive x−direction with a constant acceleration . At the same instant another body passes through x=0 moving in the positive x−direction with a constant speed . The position of the first body is given by x1(t) after time 't', and that of the second body by x2(t) after the same time interval . which of the following graphs correctly describes (x1−x2) as a function of time 't' ?
View SolutionA particle is projected at t=0 from a point on the ground with certain velocity at an angle with the horizontal. The power of gravitation force is plotted against time. Which of the following is the best representation?
View Solution
