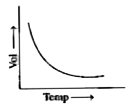
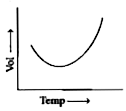
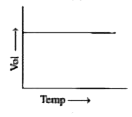
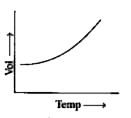
The relation between volume and temperature of a sample of water in the range 0∘C to 100∘C is best represented by
The correct Answer is:A
To solve the question regarding the relationship between volume and temperature of a sample of water from 0°C to 100°C, we need to analyze the behavior of water in this temperature range.
1. Understanding Water's Anomalous Behavior:
- Water exhibits an anomalous behavior between 0°C and 4°C. As the temperature increases from 0°C to 4°C, the volume of water actually decreases. This is because water is densest at 4°C.
2. Volume Change from 0°C to 4°C:
- At 0°C, the volume of water is at a certain value. As we increase the temperature to 4°C, the volume decreases, reaching a minimum at 4°C.
3. Volume Change from 4°C to 100°C:
- Beyond 4°C, as we continue to heat the water up to 100°C, the volume starts to increase. This means that the density of water decreases as the temperature rises from 4°C to 100°C.
4. Graphical Representation:
- The graph representing this relationship would start at a certain volume at 0°C, decrease to a minimum volume at 4°C, and then increase again up to 100°C.
5. Identifying the Correct Option:
- Among the provided options, we need to select the graph that shows this behavior: a decrease in volume from 0°C to 4°C, followed by an increase in volume from 4°C to 100°C.
- The correct option is the one that reflects this pattern, which is identified as option 2.
Final Answer:
The relation between volume and temperature of a sample of water in the range 0°C to 100°C is best represented by option 2.
- Water exhibits an anomalous behavior between 0°C and 4°C. As the temperature increases from 0°C to 4°C, the volume of water actually decreases. This is because water is densest at 4°C.
- At 0°C, the volume of water is at a certain value. As we increase the temperature to 4°C, the volume decreases, reaching a minimum at 4°C.
- Beyond 4°C, as we continue to heat the water up to 100°C, the volume starts to increase. This means that the density of water decreases as the temperature rises from 4°C to 100°C.
- The graph representing this relationship would start at a certain volume at 0°C, decrease to a minimum volume at 4°C, and then increase again up to 100°C.
- Among the provided options, we need to select the graph that shows this behavior: a decrease in volume from 0°C to 4°C, followed by an increase in volume from 4°C to 100°C.
- The correct option is the one that reflects this pattern, which is identified as option 2.
The relation between volume and temperature of a sample of water in the range 0°C to 100°C is best represented by option 2.
Topper's Solved these Questions
- COMPETITION CARE UNITBook:ICSEChapter:COMPETITION CARE UNITExercise:OBJECTIVE QUESTIONS FROM PREVIOUS IAS EXAMINATIONS
Explore 50 Videos
- COMPETITION CARE UNITBook:ICSEChapter:COMPETITION CARE UNITExercise:WAVES
Explore 98 Videos
- CIRCULAR MOTION Book:ICSEChapter:CIRCULAR MOTION Exercise:MODULE 2 (FROM ROTATIONAL KINETIC ENERGY , WORK ,POWER)
Explore 24 Videos
- DIMENSIONSBook:ICSEChapter:DIMENSIONSExercise:SELECTED PROBLEMS (FROM CONVERSIONS OF ONE SYSTEMS OF UNITS INTO ANOTHER)
Explore 9 Videos
Similar Questions
On heating water from 0∘C to 100∘C its volume
View SolutionWhen water is heated from 0∘C to 10∘C , its volume
View SolutionWhen water is heated from 0∘C to 10∘C, its volume
View SolutionBy which reaction best yield of H2 gas forms:
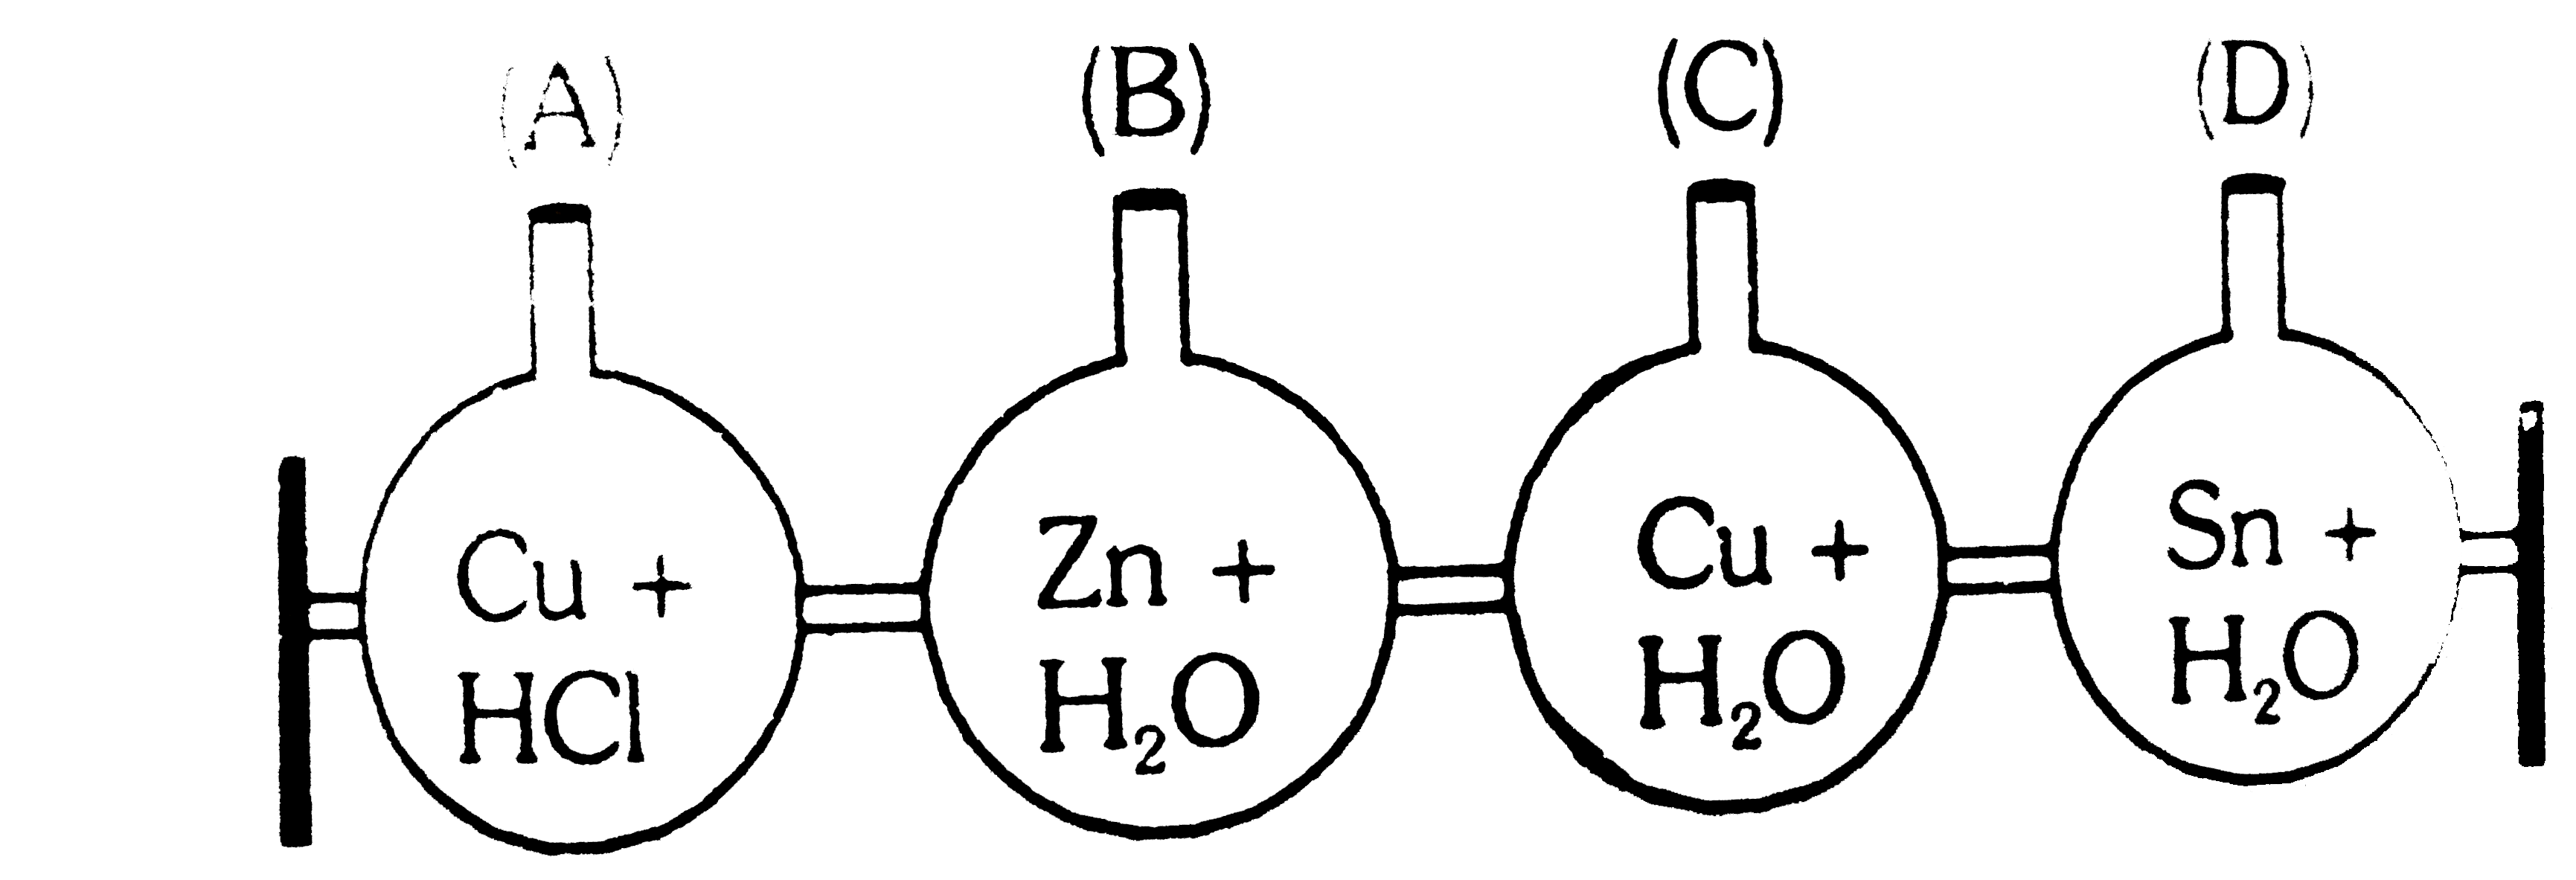
temperature of all flask More then 100∘C
View SolutionMost substances contract on freezing . However, water does not belong to this category. We know that water expands on freezing. Further , coefficient of volume expansion of water in the temperature range from 0∘C to 4∘C is negative and above 4∘C it is positive . This behaviour of water shapes the freezing of lakes as the atmospheric temperature goes down and it is still above 4∘C.
If the atmospheric temperature is below 0∘C and ice begins to form at t = 0 , thickness of ice sheet formed up to a time 't' will be directly proprotional to
View SolutionState the volume changes observed when a givenmass of water is heated from 0∘C to 10∘C. Sketch a temperature volume graph to show the behaviour.
View SolutionMost substances contract on freezing . However, water does not belong to this category. We know that water expands on freezing. Further , coefficient of volume expansion of water in the temperature range from 0∘C to 4∘C is negative and above 4∘C it is positive . This behaviour of water shapes the freezing of lakes as the atmospheric temperature goes down and it is still above 4∘C.
If the atmospheric temperature is below 0∘C
View SolutionMost substances contract on freezing . However, water does not belong to this category. We know that water expands on freezing. Further , coefficient of volume expansion of water in the temperature range from 0∘C to 4∘C is negative and above 4∘C it is positive . This behaviour of water shapes the freezing of lakes as the atmospheric temperature goes down and it is still above 4∘C.
As the atmospheric temperature goes below 4∘C
View SolutionA block of wood is floating in water at 0∘C. The temperature of water is slowly raised from 0∘C to 10∘C. How will the precentage of volume of block above water level change with rise in temperature?
View Solution