Plot a labelled graph of maximum kinetic energy of photo electrons versus frequency of incident radiation. State how you will obtain the value of Planck.s constant h from the graph.
To solve the problem of plotting a graph of maximum kinetic energy of photoelectrons versus frequency of incident radiation and determining Planck's constant from the graph, follow these steps:
Step 1: Understand the Photoelectric Effect
The photoelectric effect is described by Einstein's photoelectric equation, which states that the maximum kinetic energy (K.E.) of photoelectrons is given by:
K.E.=hν−ϕ
where:
- K.E. is the maximum kinetic energy of the emitted photoelectrons,
- h is Planck's constant,
- ν is the frequency of the incident radiation,
- ϕ is the work function of the material.
Step 2: Rearranging the Equation
We can rearrange the equation to express the maximum kinetic energy in terms of frequency:
K.E.=hν−ϕ
This can be rewritten as:
K.E.=hν−ϕ
This shows that the graph of maximum kinetic energy (K.E.) versus frequency (ν) will be a straight line.
Step 3: Identify the Axes for the Graph
- Y-axis: Maximum kinetic energy (K.E.)
- X-axis: Frequency of incident radiation (ν)
Step 4: Determine the Graph Characteristics
From the equation K.E.=hν−ϕ:
- The slope of the graph (rise/run) is equal to Planck's constant h.
- The y-intercept of the graph is −ϕ (the negative of the work function).
Step 5: Plotting the Graph
1. Draw a Cartesian plane.
2. Label the x-axis as "Frequency (ν)" and the y-axis as "Maximum Kinetic Energy (K.E.)".
3. Plot the points based on experimental data of K.E. versus frequency.
4. Draw a straight line through the points, ensuring it extends to the y-axis and x-axis.
Step 6: Finding Planck's Constant
To find the value of Planck's constant h from the graph:
1. Determine the slope of the line (rise/run).
2. The slope of the line represents Planck's constant h.
3. If the slope is calculated as m, then:
h=m
Conclusion
The graph of maximum kinetic energy of photoelectrons versus frequency of incident radiation will be a straight line with a positive slope. The value of Planck's constant h can be obtained from the slope of this line.
The photoelectric effect is described by Einstein's photoelectric equation, which states that the maximum kinetic energy (K.E.) of photoelectrons is given by:
K.E.=hν−ϕ
where:
- K.E. is the maximum kinetic energy of the emitted photoelectrons,
- h is Planck's constant,
- ν is the frequency of the incident radiation,
- ϕ is the work function of the material.
We can rearrange the equation to express the maximum kinetic energy in terms of frequency:
K.E.=hν−ϕ
This can be rewritten as:
K.E.=hν−ϕ
This shows that the graph of maximum kinetic energy (K.E.) versus frequency (ν) will be a straight line.
- Y-axis: Maximum kinetic energy (K.E.)
- X-axis: Frequency of incident radiation (ν)
From the equation K.E.=hν−ϕ:
- The slope of the graph (rise/run) is equal to Planck's constant h.
- The y-intercept of the graph is −ϕ (the negative of the work function).
1. Draw a Cartesian plane.
2. Label the x-axis as "Frequency (ν)" and the y-axis as "Maximum Kinetic Energy (K.E.)".
3. Plot the points based on experimental data of K.E. versus frequency.
4. Draw a straight line through the points, ensuring it extends to the y-axis and x-axis.
To find the value of Planck's constant h from the graph:
1. Determine the slope of the line (rise/run).
2. The slope of the line represents Planck's constant h.
3. If the slope is calculated as m, then:
h=m
The graph of maximum kinetic energy of photoelectrons versus frequency of incident radiation will be a straight line with a positive slope. The value of Planck's constant h can be obtained from the slope of this line.
Similar Questions
(i) Plot a labelled graph of |Vs| where Vs is stopping potential versus frequency f of the incident radiation.
(ii) State how will you use this graph to determine the value of Planck.s constant.
View SolutionMaximum kinetic energy (Ek) of a photoelectron varies with the frequency (v) of the incident radiation as
View Solution
Knowledge Check
According to Einstein's photoelectric equation, the plot of the maximum kinetic energy of the emitted photoelectrons from a metal versus frequency of the incident radiation gives a straight line whose slope
Adepends on the intensity of incident radiation.Bdepends on the nature of the metal and also on the intensity of incident radiation.Cis same for all metals and independent of the intensity of the incident radiation.Ddepends on the nature of the metal.
(i) Plot a labelled graph of |Vs| where Vs is stopping potential versus frequency f of the incident radiation.
(ii) State how will you use this graph to determine the value of Planck.s constant.
View SolutionIn an experiment of photo-electric effect, the graph of maximum kinetic energy Ek of the emitted photoelectrons versus the frequency v of the incident light is a straight line AB as shown in figure below :
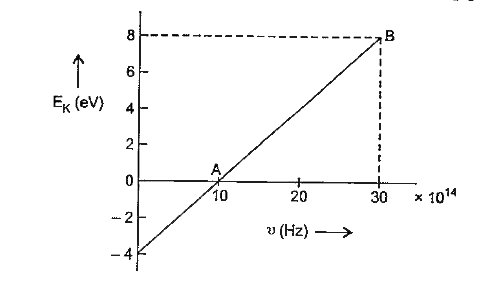
Threshold frequency of the metal.
View SolutionIn an experiment of photo-electric effect, the graph of maximum kinetic energy Ek of the emitted photoelectrons versus the frequency v of the incident light is a straight line AB as shown in figure below :
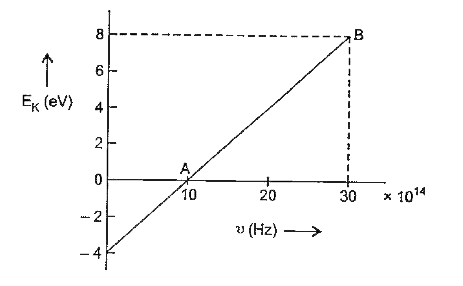
Work function of the metal.
View SolutionIn an experiment of photo-electric effect, the graph of maximum kinetic energy Ek of the emitted photoelectrons versus the frequency v of the incident light is a straight line AB as shown in figure below :
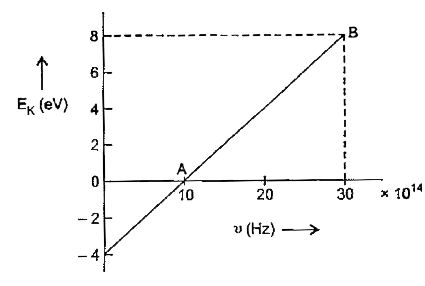
Stopping potential for the photoelectrons emitted by the light of frequency
v=30×1014Hz
View SolutionIn an experiment of photoelectric effect, the graph of maximum kinetic energy EK of the emitted photoelectrons versus the frequency v of the incident light is a straight line AB as shown in Figure below:
Find : (i) Threshold frequency of the metal.
(ii) work function of the metal
(iii) Stopping potential for the photoelectrons emitted by the light of frequency v=30×1014 Hz.
View Solution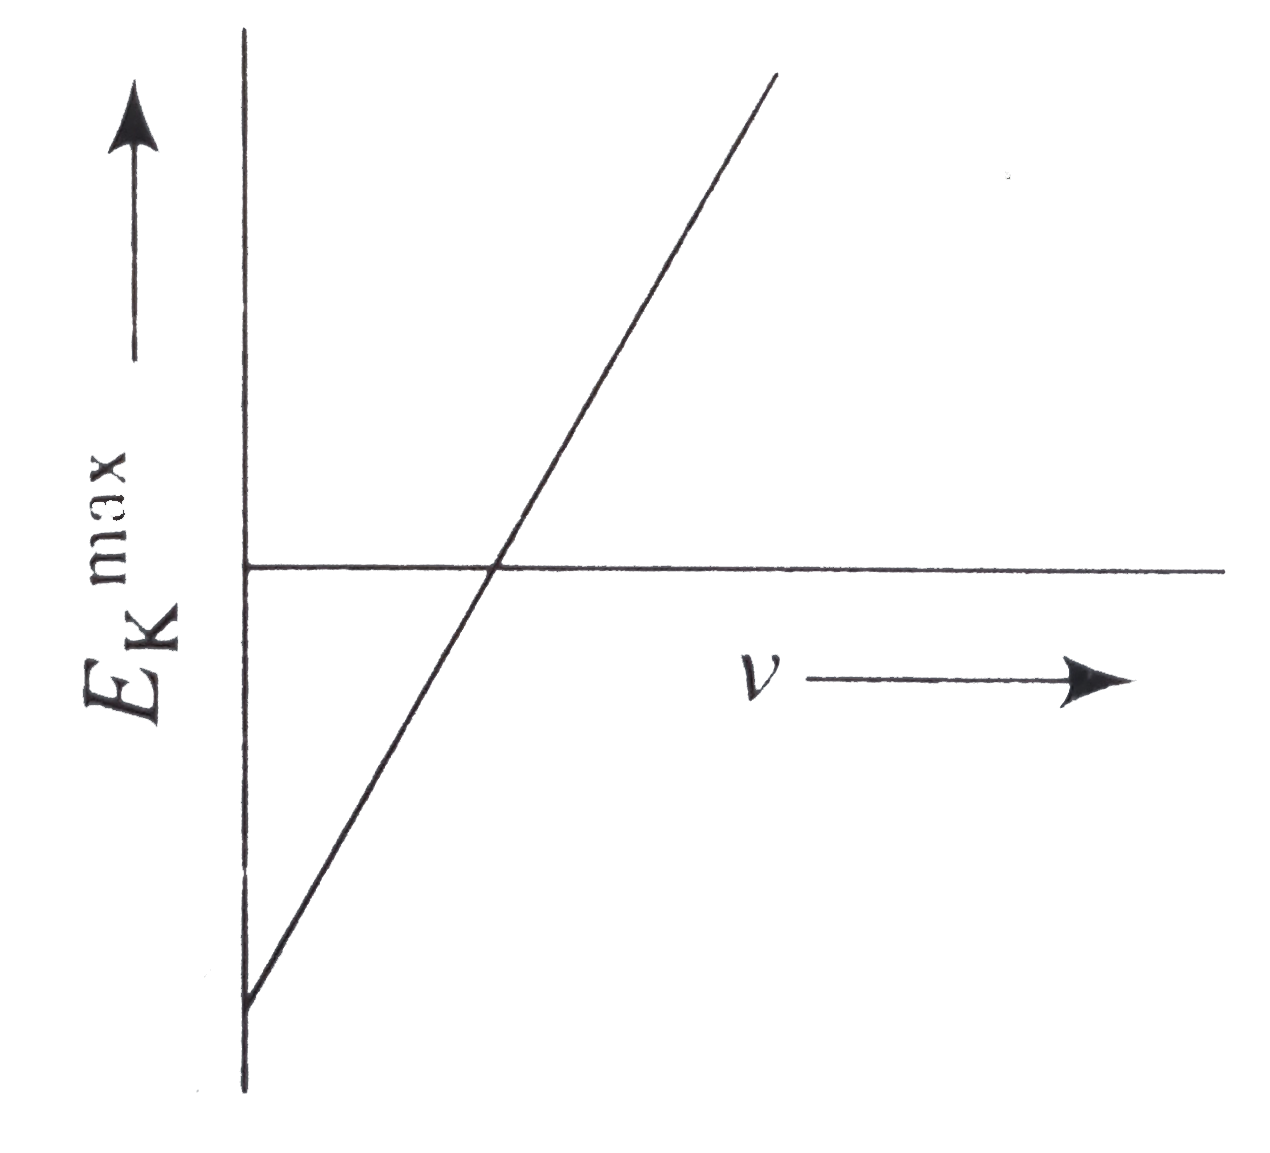
The maximum kinetic energy of the emitted photoelectrons against frequency υ of incident radiation is plotted as shown in Fig. This graph help us in determining the following physical quantities
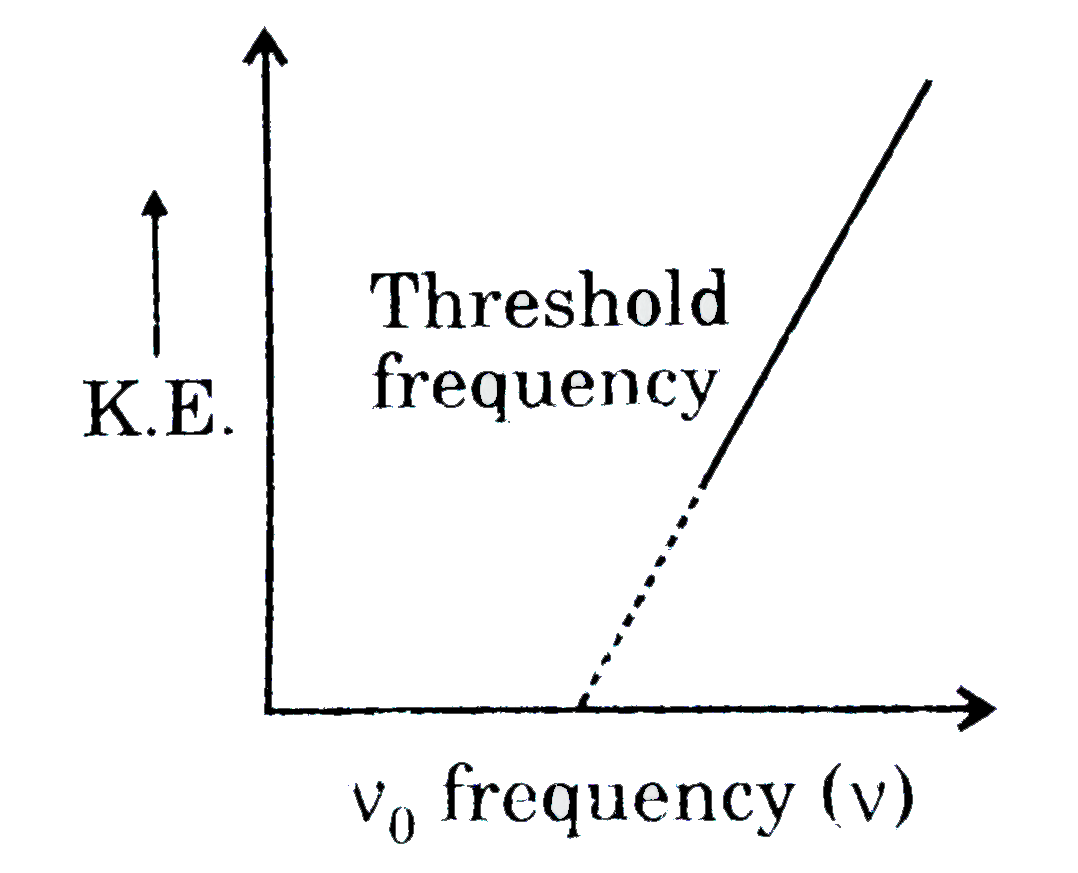
View SolutionIn the photoelectric effect the electrons are emiited instantaneously from a given metal plate when it is irradiated with radiation of frequency equal to or greater than some minimum ferquency, is called the threshold frequency.According to Planck's idea, light may be considered to be made up discrete particles called photons.Each photon carries energy equal to hv.When this photon collides with the electron of the metal, the electron acquires energy of the emitted electron is given by :
hv=K.Emaximum+PE=12mu2+PE
If the incident rediation is of threshold frequency the electron will be emitted without any kinetic energy
i.e hv0
∴12mu2=hv−hv0
A plot of kinetic energy of the emitted electron versus frequency of the incident radiation yields a straight line given as :
A laser producting monochromatic lights of different wavelenght is uesd to eject electrons from the sheet of gold having threshold frequency 6.15×10¹⁴s−1 Which of the following incident rediation will be suitable for the ejecting of electrons ?
View Solution
