In an experiment of photo-electric effect, the graph of maximum kinetic energy Ek of the emitted photoelectrons versus the frequency v of the incident light is a straight line AB as shown in figure below :
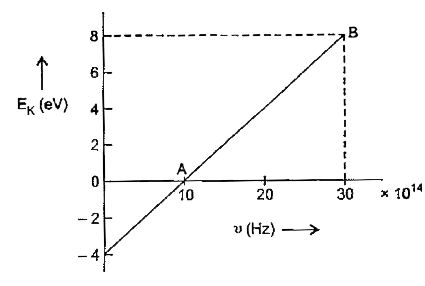
Stopping potential for the photoelectrons emitted by the light of frequency
v=30×1014Hz
Stopping potential =8 eV from graph.
Similar Questions
In an experiment of photo-electric effect, the graph of maximum kinetic energy Ek of the emitted photoelectrons versus the frequency v of the incident light is a straight line AB as shown in figure below :
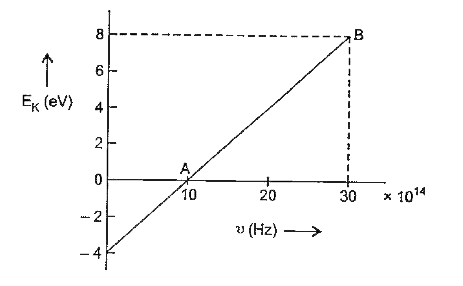
Work function of the metal.View SolutionIn an experiment of photo-electric effect, the graph of maximum kinetic energy Ek of the emitted photoelectrons versus the frequency v of the incident light is a straight line AB as shown in figure below :
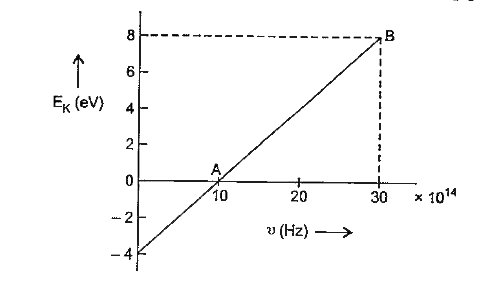
Threshold frequency of the metal.View Solution
Knowledge Check
- Question 1 - Select One
According to Einstein's photoelectric equation, the plot of the maximum kinetic energy of the emitted photoelectrons from a metal versus frequency of the incident radiation gives a straight line whose slope
Adepends on the intensity of incident radiation.Bdepends on the nature of the metal and also on the intensity of incident radiation.Cis same for all metals and independent of the intensity of the incident radiation.Ddepends on the nature of the metal.
Maximum kinetic energy (Ek) of a photoelectron varies with the frequency (v) of the incident radiation as
View SolutionIn an experiment of photoelectric effect, the graph of maximum kinetic energy EK of the emitted photoelectrons versus the frequency v of the incident light is a straight line AB as shown in Figure below:
Find : (i) Threshold frequency of the metal.
(ii) work function of the metal
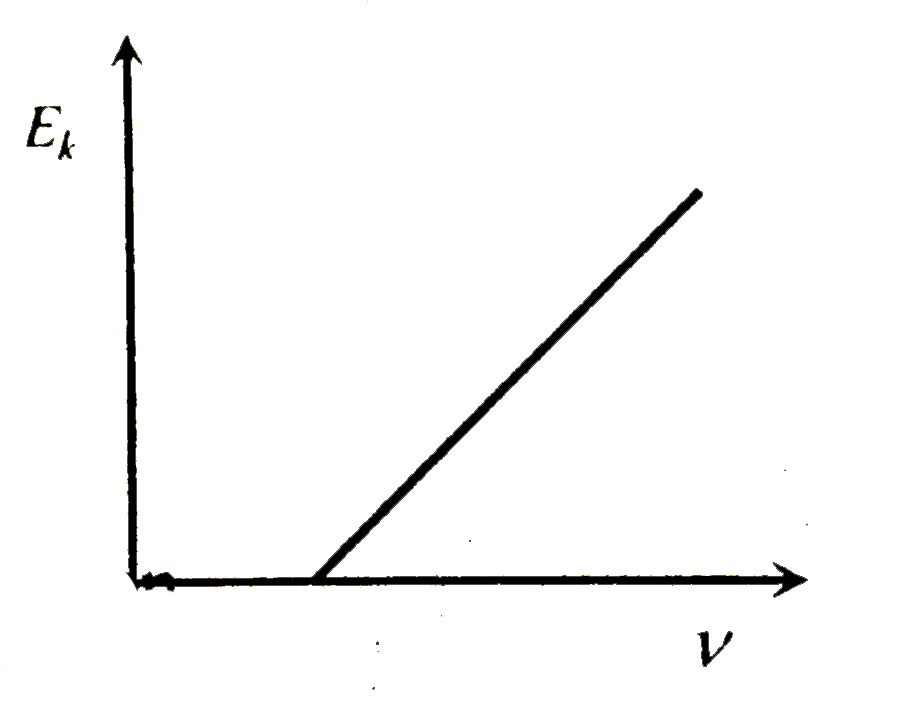
(iii) Stopping potential for the photoelectrons emitted by the light of frequency v=30×1014 Hz.View SolutionFor the photoelectric effect, the maximum kinetic energy Ek of the emitted photoelectrons is plotted against the frequency of the incident photons as shown in the figure. The slope of the curve gives
 View Solution
The stopping potential in an experiment on photoelectric effect is 2V. What is the maximum kinetic energy of the photoelectrons emitted ?
View SolutionThe correct graph respectivley the relation between energy (E) of photoelectrons and frequency v of incident light is
View SolutionThe stopping potential in an experiment on a photo electric effect is 1.5 V. What is the maximum kinetic energy of the photoelectrons emitted?
View Solution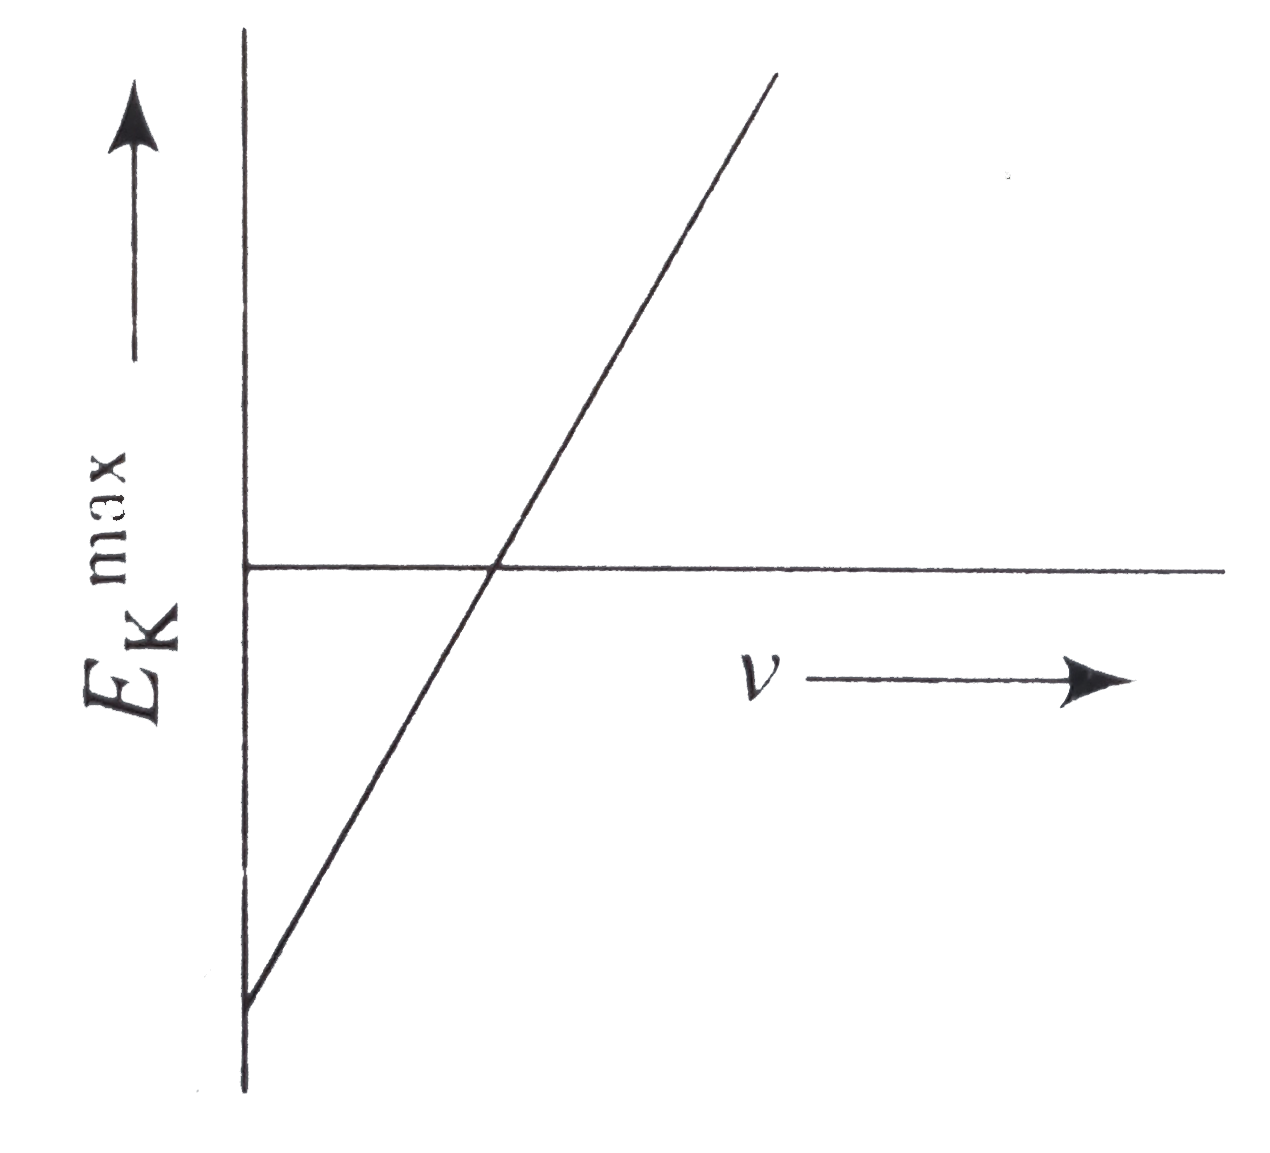
The maximum kinetic energy of the emitted photoelectrons against frequency υ of incident radiation is plotted as shown in Fig. This graph help us in determining the following physical quantitiesView Solution
